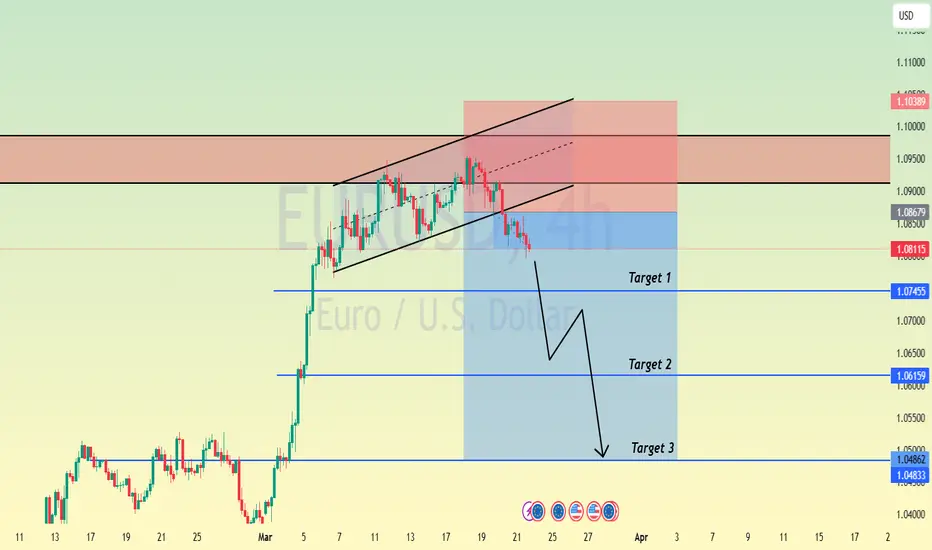
EURUSD Will be in bearish directionHello Traders
In This Chart EURUSD HOURLY Forex Forecast By FOREX PLANET
today EURUSD analysis 👆
🟢This Chart includes_ (EURUSD market update)
🟢What is The Next Opportunity on EURUSD Market
🟢how to Enter to the Valid Entry With Assurance Profit
This CHART is For Trader's that Want to Improve Their Technical Analysis Skills and Their Trading By Understanding How To Analyze The Market Using Multiple Timeframes and Understanding The Bigger Picture on the Charts
Eurusdlong
EURUSD Analysis todayHello traders, this is a complete multiple timeframe analysis of this pair. We see could find significant trading opportunities as per analysis upon price action confirmation we may take this trade. Smash the like button if you find value in this analysis and drop a comment if you have any questions or let me know which pair to cover in my next analysis.

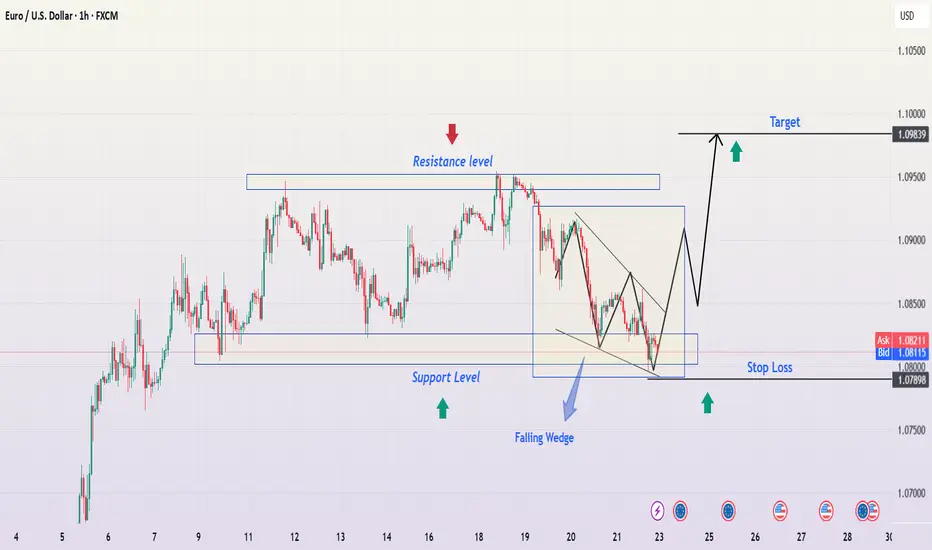
EUR/USD Trading Analysis – Falling Wedge Breakout StrategyChart Overview
The EUR/USD 1-hour chart presents a classic falling wedge pattern, which is a bullish reversal setup indicating that selling momentum is weakening and a breakout to the upside is imminent. This chart provides a structured trading plan, highlighting support and resistance levels, entry points, stop-loss placement, and a target price.
Traders can use this setup to capitalize on the potential bullish move while effectively managing risk. Let’s break it down step by step.
1. Understanding the Falling Wedge Pattern
A falling wedge is formed when price action moves within two downward-sloping trendlines that converge. It signals decreasing bearish pressure, as the price forms lower highs and lower lows within a narrowing range. The decreasing range indicates that sellers are losing control, and an upside breakout is likely.
In this chart, we observe the following key characteristics of a falling wedge:
✅ Two converging downward trendlines that contain price movement.
✅ Lower highs and lower lows showing seller exhaustion.
✅ Decreasing volume as the price approaches the breakout zone.
✅ Support near 1.08000, which has held price several times before.
A breakout above the wedge signals a shift from bearish to bullish sentiment, making this a strong trade setup.
2. Key Support & Resistance Levels
🔹 Support Level (Demand Zone)
The horizontal blue zone at 1.07898 – 1.08000 is a critical support level.
This level has been tested multiple times, making it a strong demand zone where buyers step in.
The falling wedge bottom aligns with this area, reinforcing its importance.
If price stays above this zone, it confirms the potential for a bullish breakout.
🔹 Resistance Level (Supply Zone)
The resistance zone at 1.09300 - 1.09839 has acted as a barrier to upward movement.
Price previously reversed from this zone, making it a logical take-profit area.
If the breakout happens, this level will be tested again.
A break above 1.09839 would signal further bullish momentum.
3. Trading Strategy – Step-by-Step Execution
📌 Entry Confirmation
To enter this trade with confidence, traders should wait for a confirmed breakout above the wedge.
A strong bullish candle breaking above the wedge’s upper trendline signals entry.
Ideally, a pullback and retest of the breakout level would provide additional confirmation before entering long.
📌 Stop-Loss Placement
Risk management is key, and stop-loss placement should be strategic to avoid unnecessary losses.
A stop-loss is set just below 1.07898, slightly under the recent low.
This placement ensures protection against false breakouts.
📌 Take-Profit Target
The take-profit target is set at 1.09839, aligning with key resistance and the projected wedge breakout distance.
This level has historically acted as resistance, making it an ideal zone to exit profits.
Partial profit-taking can be considered near 1.09300, before the final target.
📌 Risk-to-Reward Ratio
With a tight stop-loss and a higher profit target, this trade offers a favorable risk-reward ratio (RRR).
A minimum RRR of 1:3 is recommended, meaning potential reward is three times the risk taken.
4. Expected Market Behavior & Possible Scenarios
📊 Scenario 1: Bullish Breakout Confirmation 🚀
If price breaks and closes above the wedge, we expect a rally towards 1.09300 - 1.09839.
Pullback to retest the breakout zone would further confirm bullish strength.
Strong volume would validate the breakout, leading to a high-probability move.
📉 Scenario 2: Bearish Breakdown (Invalidation) ❌
If price breaks below 1.07898, the bullish setup is invalidated.
A downside move could push the price lower, possibly towards 1.07500 or below.
Traders should exit long positions if this scenario unfolds.
5. Additional Technical Indicators for Confirmation
To strengthen this trade setup, traders can use:
✅ RSI (Relative Strength Index) – Look for RSI divergence or a move above 50, confirming bullish strength.
✅ MACD (Moving Average Convergence Divergence) – A bullish crossover on MACD would reinforce the breakout.
✅ Volume Analysis – A spike in volume at the breakout level adds confidence in the move.
6. Conclusion & Trading Plan
This falling wedge setup suggests a high-probability bullish breakout if the price confirms above the resistance zone.
🔹 Trading Plan Summary:
✅ Wait for a breakout above the wedge before entering.
✅ Confirm breakout with a retest or strong bullish candle.
✅ Set stop-loss below 1.07898 to limit downside risk.
✅ Take profit at 1.09839, securing profits at resistance.
This strategy offers an excellent risk-to-reward ratio, making it a well-structured trade setup. Always manage risk and avoid premature entries without confirmation.
📌 TradingView Tags for Maximum Visibility
#EURUSD #Forex #TechnicalAnalysis #FallingWedge #Breakout #PriceAction #ForexSignals #SupportResistance #TradingSetup #DayTrading #SwingTrading
EURUSD is about to riseThe information of the Federal Reserve is about to be released. We need to get into the market one step ahead.
EURUSD
🎁 Buy@ 1.08500
🎁 SL 1.07500
🎁 TP 1.10000
Traders, if you liked this idea or if you have your own opinion about it, write in the comments. I will be glad
If you also aspire to achieve financial freedom,Follow the link below to get my daily strategy updates

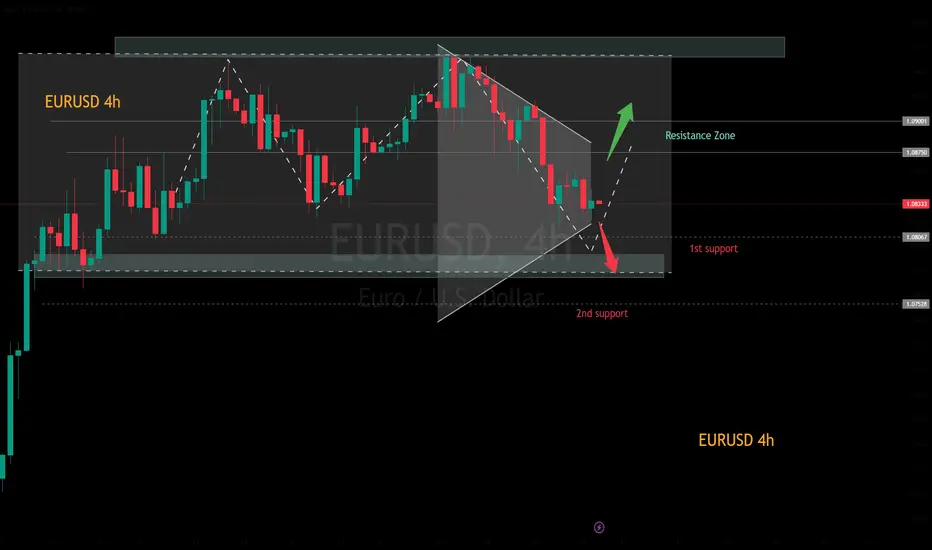
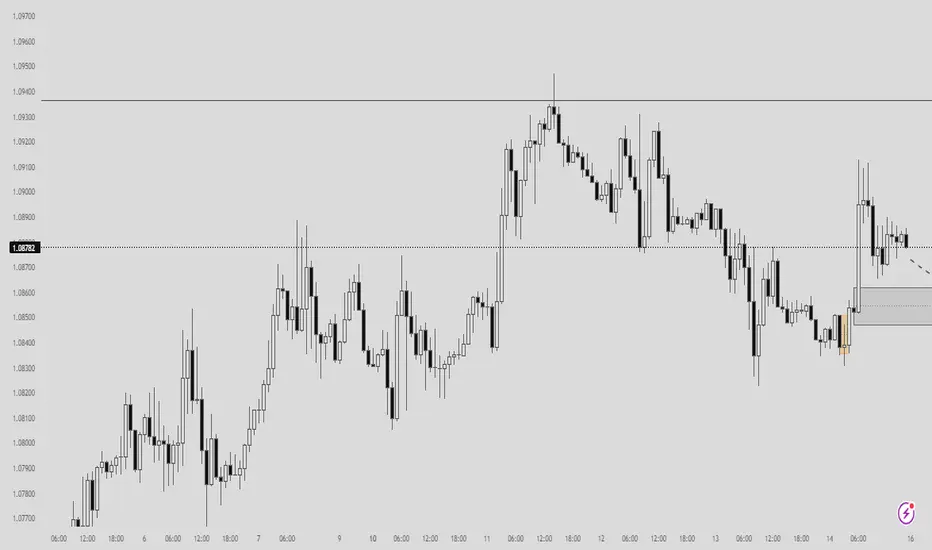
EUR/USD: Key Levels and Short-Term OutlookRecently, although inflation data in the United States has declined, it remains elevated, and the labour market continues to be tight. The Federal Reserve may maintain a hawkish stance, which is supportive of the US dollar. Meanwhile, the economic recovery in the eurozone has slowed. Weak manufacturing PMI data has dampened business and consumer confidence, exerting downward pressure on the euro.
From the 4-hour candlestick chart, EUR/USD is currently in a triangular consolidation pattern, with the price hovering around 1.08343. The resistance zone lies between 1.08760 and 1.09090, whilst the first support level is at 1.08067 and the second at 1.07528. In this context, EUR/USD is more likely to test the support levels in the short term.
I will share trading signals every day. All the signals have been accurate for a whole month in a row. If you also need them, please click on the link below the article to obtain them.
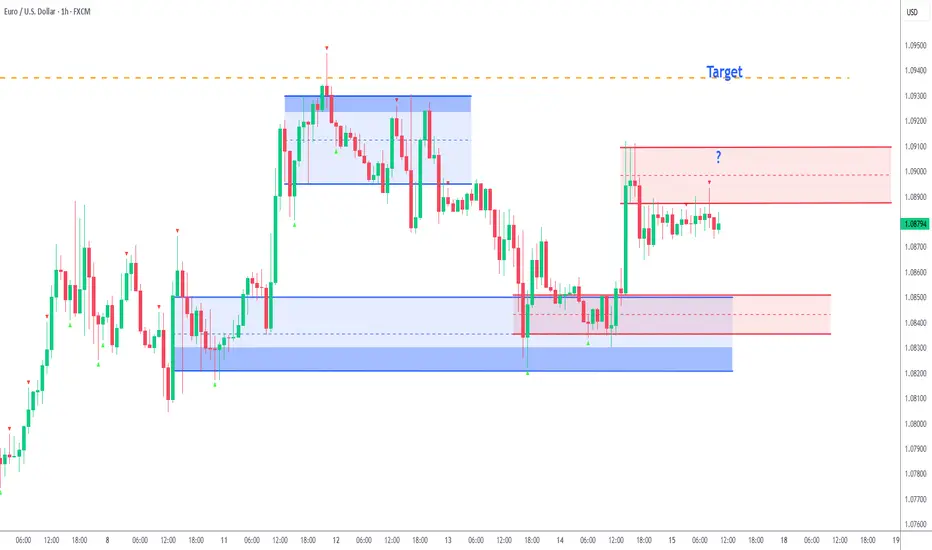
EURUSD BUY/LONGBy utilizing Fibonacci retracement levels, historical patterns, , we can formulate a hypothesis that the market might follow a similar trajectory if bullish sentiment prevails.
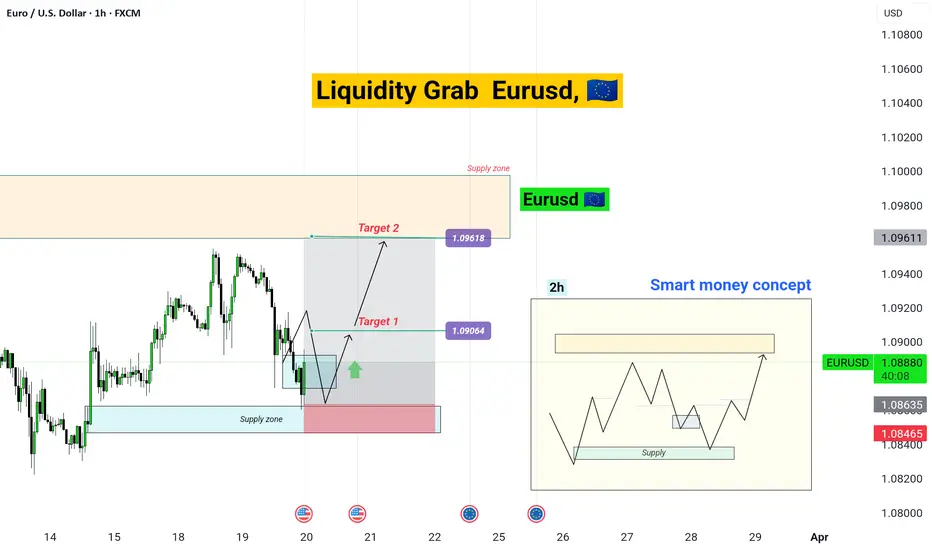
Liquidity Grab eurusd Supply & Demand Zones:
🔻 A major supply zone (resistance) is marked above 1.09618, where institutional selling pressure may appear.
🔹 A demand zone (support) is established below 1.09064, providing potential entry opportunities.
📈 Trading Plan & Targets:
✅ Expecting a bullish move from the demand zone as price reacts positively.
🎯 Target 1: 1.09064 – Mid-level liquidity area.
🎯 Target 2: 1.09618 – Major resistance & supply zone.
📌 Smart Money Concept (SMC):
🔹 Price is forming a liquidity sweep before a potential bullish push.
🔹 The structure suggests an accumulation phase, with a breakout confirmation above key levels.
💡 Key Takeaways:
🔹 Bullish bias unless price invalidates the demand zone.
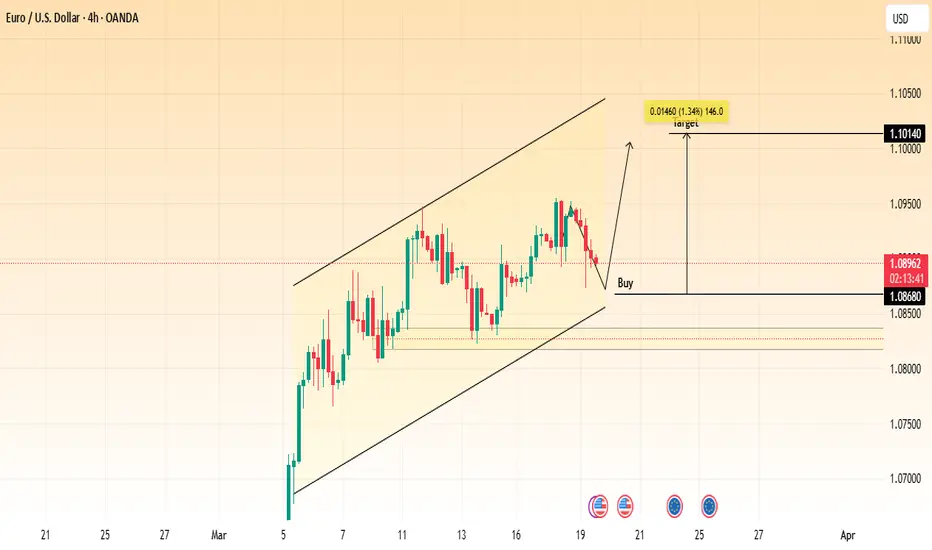
EUR/USD Bullish Continuation Setup📈 Trend Analysis:
The price is trading within a rising channel, suggesting an overall bullish trend.
The market recently pulled back to a key support level, presenting a potential buy opportunity.
🔍 Key Levels:
Buy Zone: Around 1.08680 - 1.08966, marking strong support.
Target: 1.10140, aligning with the upper trendline resistance.
📌 Trade Plan:
Look for buy entries near the lower boundary of the ascending channel.
Confirmation through bullish candlestick patterns (e.g., engulfing, pin bar) strengthens the setup.
⚠ Risk Management:
Stop loss: Below the 1.08680 support level.
Take profit: Gradually scale out at 1.10140 resistance.
EURUSD is Ready for a Bullish Move Hello Traders
In This Chart EURUSD HOURLY Forex Forecast By FOREX PLANET
today EURUSD analysis 👆
🟢This Chart includes_ (EURUSD market update)
🟢What is The Next Opportunity on EURUSD Market
🟢how to Enter to the Valid Entry With Assurance Profit
This CHART is For Trader's that Want to Improve Their Technical Analysis Skills and Their Trading By Understanding How To Analyze The Market Using Multiple Timeframes and Understanding The Bigger Picture on the Charts

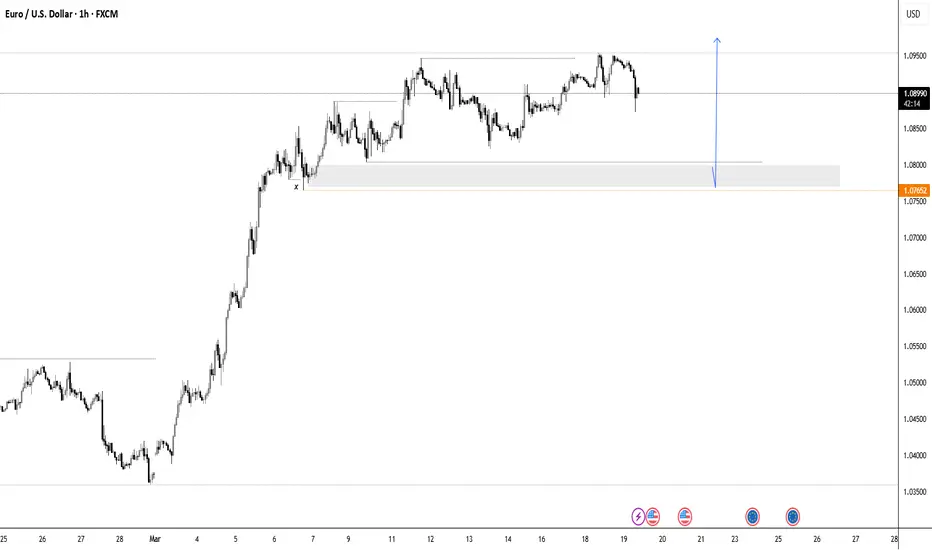
EURUSD LONGPossible long opportunity on EURUSD . I would be a bit careful on this looking that there is some form of imbalance right below my invalidation level 1.07652. Drop a comment and tell me what you think
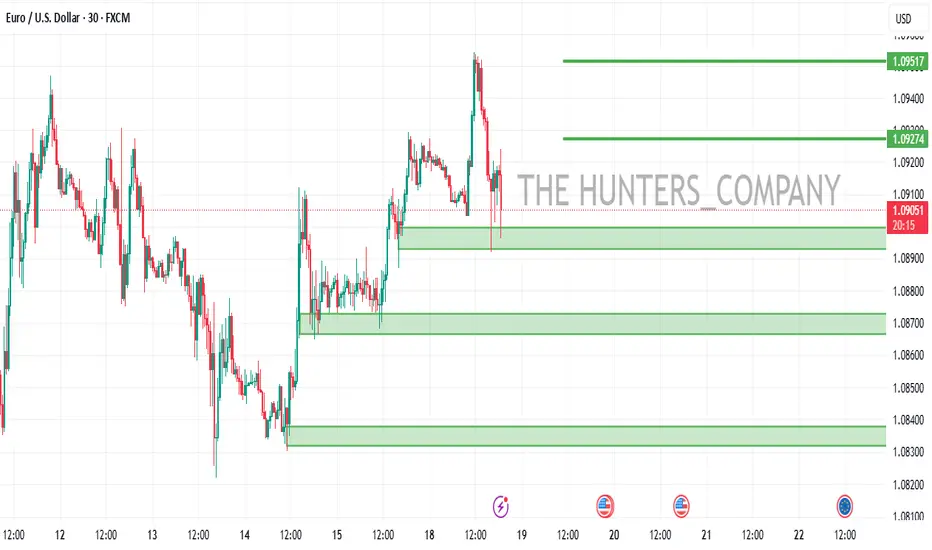
EURUSD Bullish EURUSD bullish setup on the H1 chart. The 1.0910 level is strong resistance, but the H4 uptrend is strong enough to break it. Waiting for buy signal on lower TimeFrames.
EURUSDHello friends
Given the good price growth, we can now buy in the support areas during the pullbacks that the price makes, of course with capital management...
*Trade safely with us*
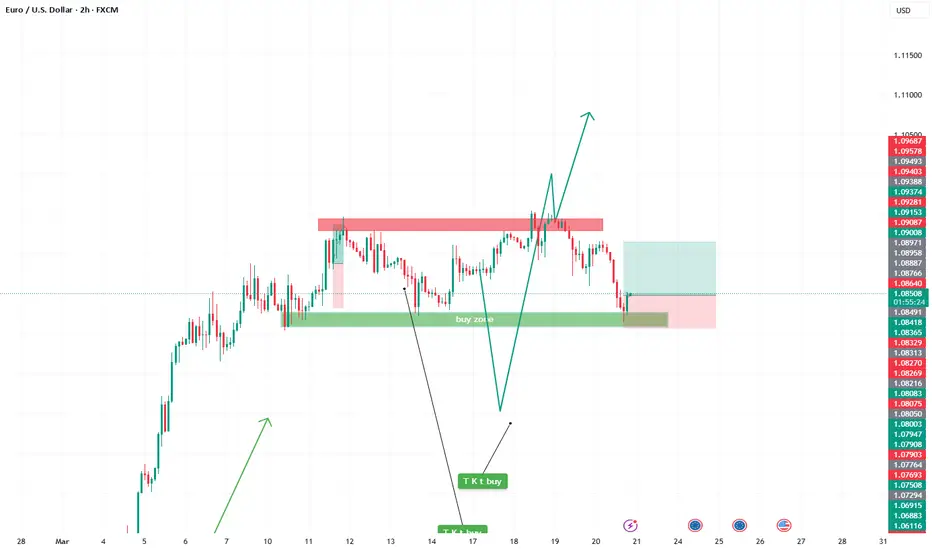
EURUSD TODAYToday's analysis shows most likely EU may continue it's bullish trend. with two POI levels below and Inducements that are located before them.
let's sit and react to price movements.

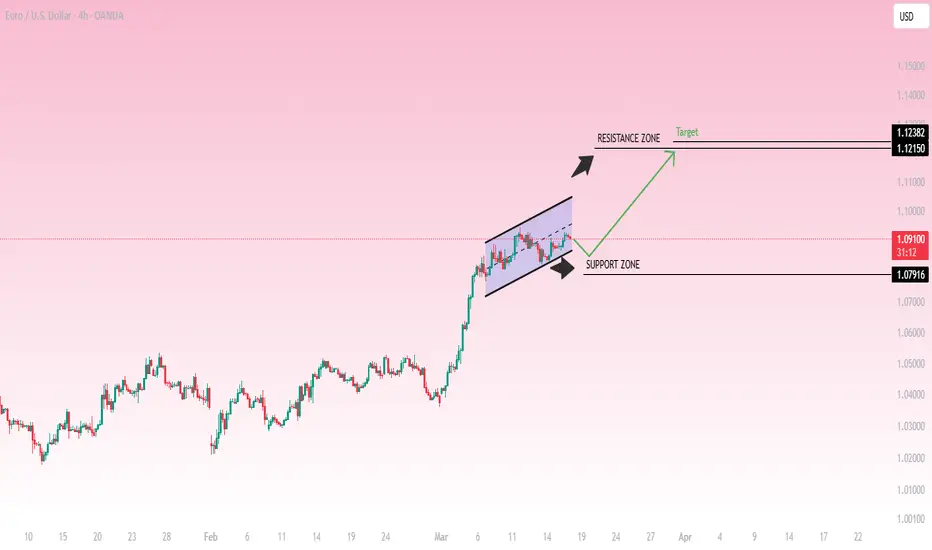
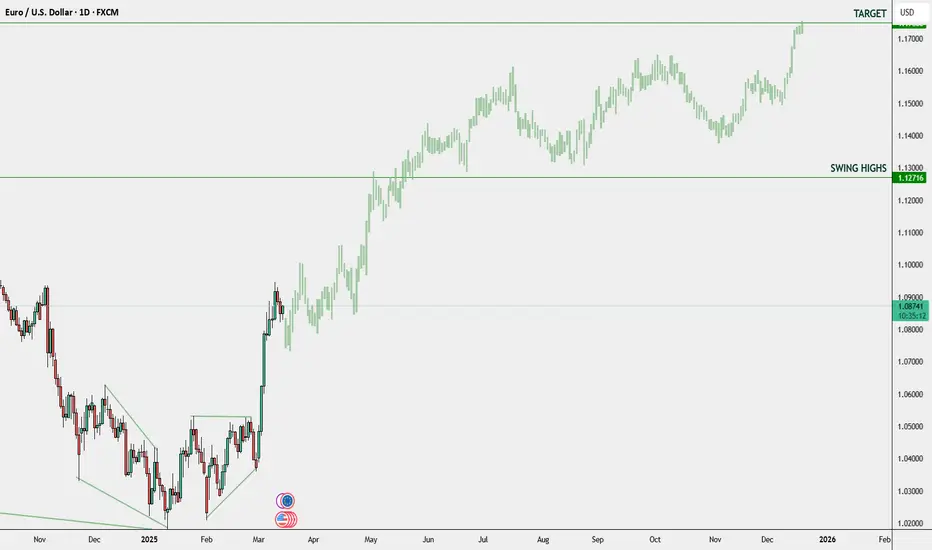
EUR/USD – Bullish Breakout Setup 🔹 Overview:
EUR/USD remains in an ascending channel and is currently near the support zone. A bullish move is anticipated toward the 1.12150 - 1.12382 resistance zone, aligning with the overall trend.
🔹 Technical Analysis:
✅ Support Zone: Holding at 1.07916, acting as a key demand area.
✅ Ascending Channel: Price structure remains bullish, with higher highs and higher lows.
✅ Target: Resistance around 1.12382 aligns with a possible breakout.
🔹 Trade Idea:
📌 Long Entry: Around the support zone if bullish confirmation appears.
📌 Target: 1.12150 - 1.12382 resistance zone.
📌 Invalidation: Break below 1.07916 could shift momentum bearish.
📊 Sentiment: Bullish bias, waiting for confirmation.
📢 Will EUR/USD hit the target? Let’s discuss! 👇
EURUSD TO GO UP (FOMC RATES THIS WEDNESDAY)As FOMC rates will approach this Wednesday for USD, we can see EURUSD is going up as it is most likely to break resistance at the top. Therefore, it is good to buy.
Entry: 1.092
TP: 1.0935-1.10
EURUSD analysis todayHello traders, this is a complete multiple timeframe analysis of this pair. We see could find significant trading opportunities as per analysis upon price action confirmation we may take this trade. Smash the like button if you find value in this analysis and drop a comment if you have any questions or let me know which pair to cover in my next analysis.

EURUSD Will be in bearish directionHello Traders
In This Chart EURUSD HOURLY Forex Forecast By FOREX PLANET
today EURUSD analysis 👆
🟢This Chart includes_ (EURUSD market update)
🟢What is The Next Opportunity on EURUSD Market
🟢how to Enter to the Valid Entry With Assurance Profit
This CHART is For Trader's that Want to Improve Their Technical Analysis Skills and Their Trading By Understanding How To Analyze The Market Using Multiple Timeframes and Understanding The Bigger Picture on the Charts

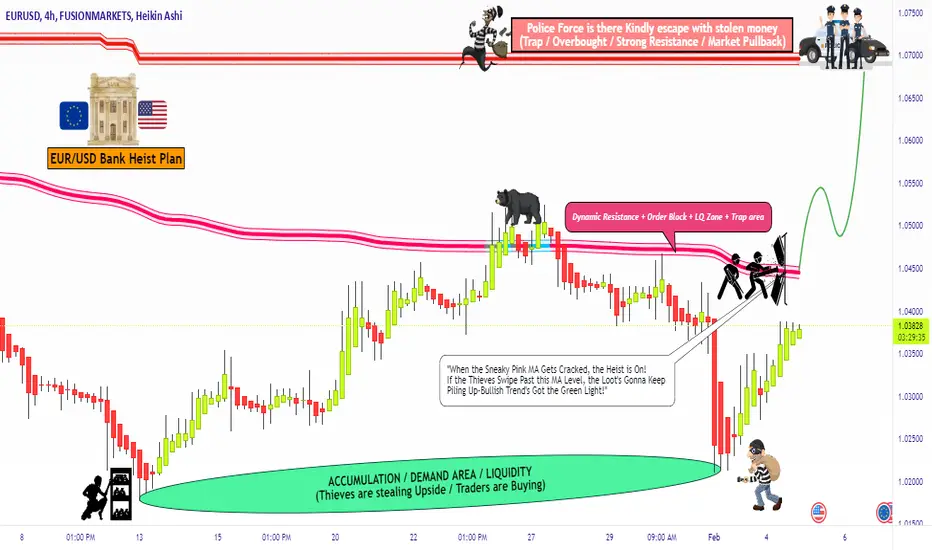
EUR/USD "The Dollar Crusher" Forex Market Bullish Heist Plan🌟Hi! Hola! Ola! Bonjour! Hallo!🌟
Dear Money Makers & Thieves, 🤑 💰🐱👤
Based on 🔥Thief Trading style technical and fundamental analysis🔥, here is our master plan to heist the EUR/USD "The Dollar Crusher" Forex market. Please adhere to the strategy I've outlined in the chart, which emphasizes long entry. Our aim is the high-risk Red Zone. Risky level, overbought market, consolidation, trend reversal, trap at the level where traders and bearish robbers are stronger. 🏆💸Be wealthy and safe trade.💪🏆🎉
Entry 📈 : "The heist is on! Wait for the breakout (1.04500) then make your move - Bullish profits await!"
however I advise placing Buy Stop Orders above the breakout MA or Place Buy limit orders within a 15 or 30 minute timeframe. Entry from the most recent or closest low or high level should be in retest.
Stop Loss 🛑: Thief SL placed at 1.03500(swing Trade) Using the 2H period, the recent / nearest low level.
SL is based on your risk of the trade, lot size and how many multiple orders you have to take.
Target 🎯: 1.07000 (or) Escape Before the Target
Scalpers, take note 👀 : only scalp on the Long side. If you have a lot of money, you can go straight away; if not, you can join swing traders and carry out the robbery plan. Use trailing SL to safeguard your money 💰.
📰🗞️Fundamental, Macro, COT, Sentimental Outlook:
EUR/USD "The Dollar Crusher" Forex Market market is currently experiencing a bullish trend,., driven by several key factors.
🔴Fundamental Analysis
- The Eurozone's economic growth is expected to slow down, while the US economy is expected to grow at a moderate pace.
- The European Central Bank (ECB) is expected to keep interest rates steady, while the Federal Reserve is expected to maintain its accommodative monetary policy.
🟤Macro Analysis
- The Eurozone's inflation rate is expected to remain low, while the US inflation rate is expected to remain above the Federal Reserve's target.
- The Eurozone's trade balance is expected to remain in surplus, while the US trade balance is expected to remain in deficit.
🟠Sentimental Analysis
- Institutional investors have a bullish sentiment towards the EUR/USD pair, with 55% of investors being bullish.
- Hedge funds have increased their long positions in the EUR/USD pair, with a net long exposure of 12%.
🟣COT Analysis
- The Commitments of Traders (COT) report shows that commercial traders have increased their long positions in the EUR/USD pair, with a net long exposure of 10%.
- Non-commercial traders have also increased their long positions, with a net long exposure of 15%.
🟡Trader Sentiment
- Retail traders have a bullish sentiment towards the EUR/USD pair, with 52% of traders being bullish.
- Commercial banks have increased their EUR/USD holdings, with a growth rate of 5%.
🔵Bullish and Bearish Data:
- Bullish Sentiment: Institutional investors have a bullish sentiment towards the EUR/USD pair, with 55% being bullish. Hedge funds have increased their long positions, with a net long exposure of 12%
- Bearish Sentiment: Asset managers are trimming their long exposure, and gross shorts are trending higher for large specs and asset managers since Q4
🟢Based on this analysis, the EUR/USD pair is expected to move in a bullish trend, with a 55% chance of an uptrend and a 35% chance of a downtrend. However, please note that market predictions can be unpredictable and influenced by various factors
⚠️Trading Alert : News Releases and Position Management 📰 🗞️ 🚫🚏
As a reminder, news releases can have a significant impact on market prices and volatility. To minimize potential losses and protect your running positions,
we recommend the following:
Avoid taking new trades during news releases
Use trailing stop-loss orders to protect your running positions and lock in profits
📌Please note that this is a general analysis and not personalized investment advice. It's essential to consider your own risk tolerance and market analysis before making any investment decisions.
📌Keep in mind that these factors can change rapidly, and it's essential to stay up-to-date with market developments and adjust your analysis accordingly.
💖Supporting our robbery plan will enable us to effortlessly make and steal money 💰💵 Tell your friends, Colleagues and family to follow, like, and share. Boost the strength of our robbery team. Every day in this market make money with ease by using the Thief Trading Style.🏆💪🤝❤️🎉🚀
I'll see you soon with another heist plan, so stay tuned 🤑🐱👤🤗🤩
EURUSD 15 March Next Week IdeaEuro is still strong . Last day of a week 15 March Friday , it got a good pump. I am looking for buying opportunities for EURUSD pair.
The price closed above 50 percent of previous day.
Stands strong.
USD is crashing.
Best Regards
dzhvush
EURUSD MY VIEW DAILY TIME FRAMEThe Structure looks good to us, waiting for this instrument to correct and then give us these opportunities as shown on this instrument (Price Chart).
Note: Its my view only and its for educational purpose only. Only who has got knowledge about this strategy, will understand what to be done on this setup. its purely based on my technical analysis only (strategies). we don't focus on the short term moves, we look for only for Bullish or Bearish Impulsive moves on the setups after a good price action is formed as per the strategy. we never get into corrective moves. because it will test our patience and also it will be a bullish or a bearish trap. and try trade the big moves.
We do not get into bullish or bearish traps. We anticipate and get into only big bullish or bearish moves (Impulsive Moves). Just ride the Bullish or Bearish Impulsive Move. Learn & Know the Complete Market Cycle.
Buy Low and Sell High Concept. Buy at Cheaper Price and Sell at Expensive Price.
Please keep your comments useful & respectful.
Keep it simple, keep it Unique.
Thanks for your support
Tradelikemee Academy
Saanjayy KG
EURUSD Analysis todayHello traders, this is a complete multiple timeframe analysis of this pair. We see could find significant trading opportunities as per analysis upon price action confirmation we may take this trade. Smash the like button if you find value in this analysis and drop a comment if you have any questions or let me know which pair to cover in my next analysis.

EURUSD Analysis todayHello traders, this is a complete multiple timeframe analysis of this pair. We see could find significant trading opportunities as per analysis upon price action confirmation we may take this trade. Smash the like button if you find value in this analysis and drop a comment if you have any questions or let me know which pair to cover in my next analysis.
