EUR/USD Long📍 Entry (Buy Limit):
1.1085
This is just above the 1.1000 psychological level but below previous minor structure at 1.1100.
Captures a shallow retest without risking being front-run by liquidity sweeps.
🛑 Stop Loss (SL):
1.0910
Below consolidation zone and wicks around 1.10
Provides enough space beneath the major breakout level while staying tight for R:R
🎯 Take Profit Targets:
TP1: 1.1500 (Previous weekly resistance, already tested but not broken)
TP2: 1.2000 (Next clean monthly structure level)
TP3 (macro): 1.2400 (Upper range of long-term channel, highly reactive zone)
⚖️ Risk/Reward:
Risk: ~175 pips
Reward:
• TP1: ~415 pips
• TP2: ~915 pips
• TP3: ~1,315 pips
R:R = 2.4 to 1, 5.2 to 1, 7.5 to 1
Eurusdlong
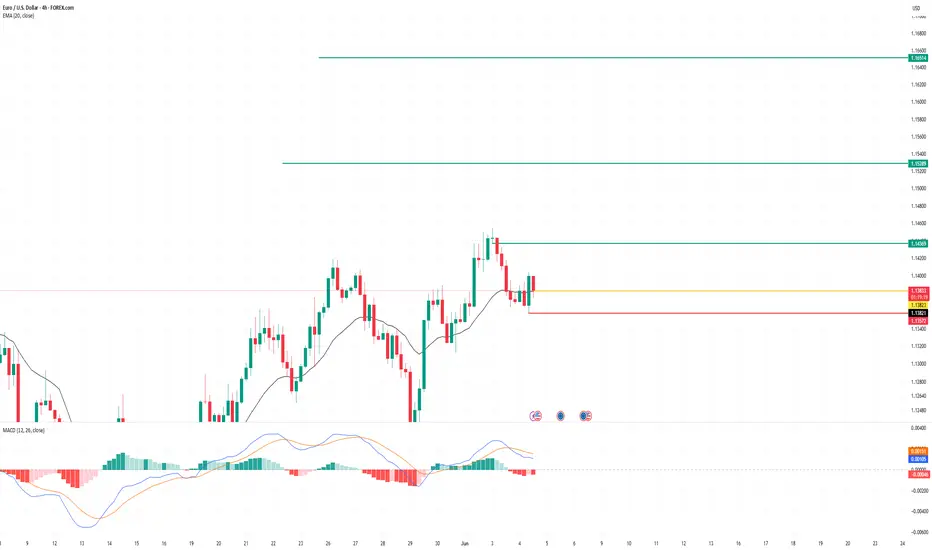
EURUSD Long Setup Above 1.14544 – Trendline in FocusFX:EURUSD is showing a potential long setup if price breaks above the 1.14544 level . The trade's potential is influenced by an ascending trendline around 1.14710 . If the market hesitates at this level, it may be wise to close the position or move the stop loss to breakeven .

ECB rate announcement in focusthe European Central Bank (ECB) will be in focus today at 12:15 pm GMT and is anticipated to reduce rates amid recent CPI inflation (Consumer Price Index) softening by more-than-expected in May to 1.9% at the headline year-on-year (YY) level from 2.2% in April. YY core inflation – a measure that excludes volatile energy, food, alcohol, and tobacco prices – also softened to 2.3% in May from 2.7% in April.
I believe the last thing the ECB wants to do is shock the markets today, so I would be very surprised if they maintained rates at current levels. The decision, however, will be far from unanimous, with divisions among the 26 members who make up the ECB’s decision-making body. Markets expect the central bank to reduce all three benchmark rates by 25 bps, which would lower the deposit facility rate to 2.00% and the refinancing rate to 2.15%. If the ECB proceeds with another rate cut, this would mark the eighth reduction since the central bank commenced its easing cycle in mid-2024.
With a rate cut already baked in, I think the question top of mind among investors is what comes next. The ECB will likely want to signal a pause following today's cut, albeit a ‘dovish pause’. In the ECB’s macroeconomic projections, analysts are also expecting notable downward revisions to inflation and growth. Therefore, it will be interesting to see how they convey this via language in their rate statement and in ECB President Christine Lagarde’s press conference.
However, I find it very unlikely that forward guidance will provide a clear path, and the central bank is likely to remain in a data-dependent mode.
While a dovish cut from the ECB could send the EUR/USD southbound today, I expect it to be short-lived if US employment data comes in lower than expected on Friday.
Despite a temporary push lower potentially unfolding in the pair today, I remain bullish EUR/USD. As shown on the chart, the pair is shaking hands with monthly resistance from US$1.1457. Those who regularly follow my research will know that I am not enthusiastic about this level, given the inability of price to push through monthly support at US$1.1134 in May. Should follow-through buying emerge and US$1.1457 bids are consumed, I will be watching monthly resistance as far north as US$1.2028-US$1.1930.
Written by FP Markets Chief Market Analyst Aaron Hill
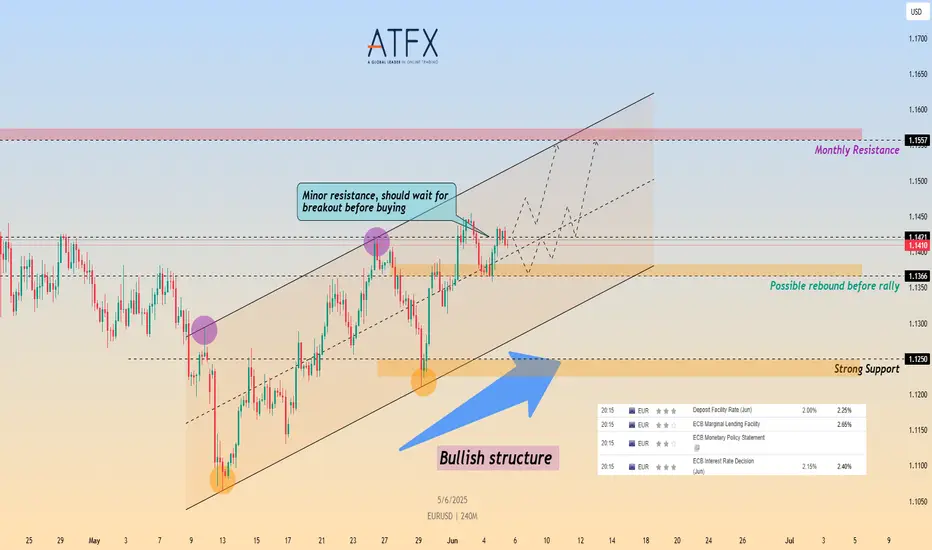
EUR/USD Awaits ECB Decision Near 1.1400 Amid Rate Cut BetsCMCMARKETS:EURUSD FX:EURUSD EUR/USD is consolidating above the 1.1400 psychological level as markets brace for the European Central Bank’s monetary policy announcement. The ECB is widely expected to cut its Deposit Facility Rate by 25bps to 2.00%, marking its seventh consecutive rate cut since June 2024.
Technically, the pair continues to trade within a well-defined ascending channel, reflecting a broader bullish structure. Current price action is facing a minor resistance near 1.1421, which is the top of the short-term range and also a key trendline rejection zone. A clean breakout above this area could expose the monthly resistance near 1.1557.
However, if OANDA:EURUSD EUR/USD fails to breach this level initially, a pullback toward 1.1366 (channel base support) is possible before bulls regain control. The bullish setup remains valid as long as price holds above this support zone.
Traders should monitor the ECB press conference for signals on whether the central bank may pause further easing later this year.
Resistance : 1.1421 , 1.1557
Support : 1.1366 , 1.1250
Can it stabilize above 1.14?The euro against the US dollar traded in a narrow range during the North American session, with the current exchange rate consolidating near the 1.14 level as the market awaits the European Central Bank's (ECB) interest rate decision this Thursday.
In the US, the ADP employment data far missed expectations, with private sector employment increasing by only 37,000 in May—significantly below the market forecast of 115,000. This weak data triggered a decline in the US dollar, pushing the EUR/USD exchange rate to rebound to the 1.1400 zone. While the exchange rate is expected to continue its rebound momentum, its upside potential remains limited. If the key resistance level of 1.1418 is effectively broken, it could open the door for further upward movement to the 1.1450-1.1480 range.
Humans need to breathe, and perfect trading is like breathing—maintaining flexibility without needing to trade every market swing. The secret to profitable trading lies in implementing simple rules: repeating simple tasks consistently and enforcing them strictly over the long term.

EUR/USD Bearish Reversal Setup Analysis EUR/USD Bearish Reversal Setup Analysis 🧠💼
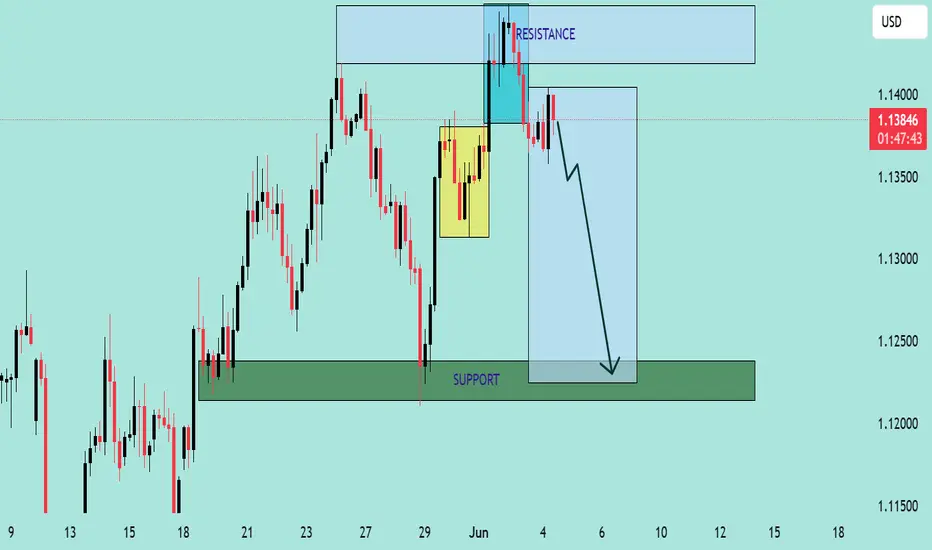
The chart presents a clear bearish outlook on EUR/USD, with well-defined resistance and support zones, along with a projected short-term price trajectory. Here's a professional breakdown:
🔍 Key Technical Highlights
🔵 Resistance Zone (~1.1400 - 1.1430)
Price recently tested this resistance area and formed multiple wicks, signaling strong seller presence.
A bullish liquidity grab is evident in the highlighted cyan box, suggesting a fake breakout before reversal.
🟡 Supply Zone / Order Block
The yellow box marks a previous consolidation area (potential order block), which was revisited and rejected — reinforcing bearish intent.
🔽 Current Price Action
Price is trading around 1.1378, having broken structure and failed to maintain momentum above the resistance.
Sharp rejections and bearish engulfing candles imply strong selling pressure.
🟢 Support Zone (~1.1230 - 1.1260)
This is a previous demand area where price rallied strongly.
The large blue projection box and arrow suggest a bearish continuation targeting this support region.
📉 Bias: Bearish
Structure: Lower highs forming after liquidity grab.
Price Action: Bearish engulfing after resistance rejection.
Market Sentiment: Sellers appear in control after failing bullish breakout attempt.
🎯 Trade Idea
Entry: After confirmed rejection from resistance (~1.1370–1.1385)
TP: Around 1.1240 (support zone)
SL: Above recent highs (~1.1420)
Risk/Reward: Favorable R:R as the setup targets a large swing down.
EURUSD and GBPUSD Breakout?Hello traders, this is a complete multiple timeframe analysis of this pair. We see could find significant trading opportunities as per analysis upon price action confirmation we may take this trade. Smash the like button if you find value in this analysis and drop a comment if you have any questions or let me know which pair to cover in my next analysis.

EURUSD Trade Setup: Heres My Trade Plan!📈 EUR/USD Trade Outlook: Bullish Trend in Focus 🇪🇺💵
I'm currently watching EUR/USD, and it’s holding a strong bullish trend — with clear higher highs and higher lows across the board 🔁. On the 4-hour timeframe, price has pulled back into equilibrium, and I’m eyeing a potential buy opportunity if the structure continues to hold 🛒.
📚 Looking at historical price action, this setup has played out reliably in the past. That said, it's important to acknowledge that deeper pullbacks can occur — often sweeping liquidity below previous lows before resuming the trend 💧.
⚠️ This is a real risk, so consider conservative position sizing and always manage your risk appropriately.
💬 Drop a comment below if you're watching this setup too — I’d love to hear your take!
❗️Disclaimer: This is not financial advice. The content shared is for educational and informational purposes only. Please do your own analysis and trade responsibly.

Euro Pulls Back – Eyes on ECB and Tariff TurmoilCMCMARKETS:EURUSD FX:EURUSD EUR/USD pulled back from a six-week high of 1.1454 to trade near 1.1379, down 0.52% on Tuesday, as strong U.S. labor market data and revived trade tensions lifted the dollar. April JOLTS job openings rose to 7.39M, beating expectations, signaling a resilient U.S. economy despite a 3.7% drop in factory orders.
In parallel, Trump’s announcement to double tariffs on steel and aluminum has reignited trade war concerns. Markets are also watching for a potential Trump–Xi call later this week.
Meanwhile, the Euro lost ground after May HICP inflation in the Eurozone fell to 1.9%, below the ECB’s 2% target. With core inflation slowing as well, markets have priced in a 25 bps rate cut at Thursday’s ECB meeting.
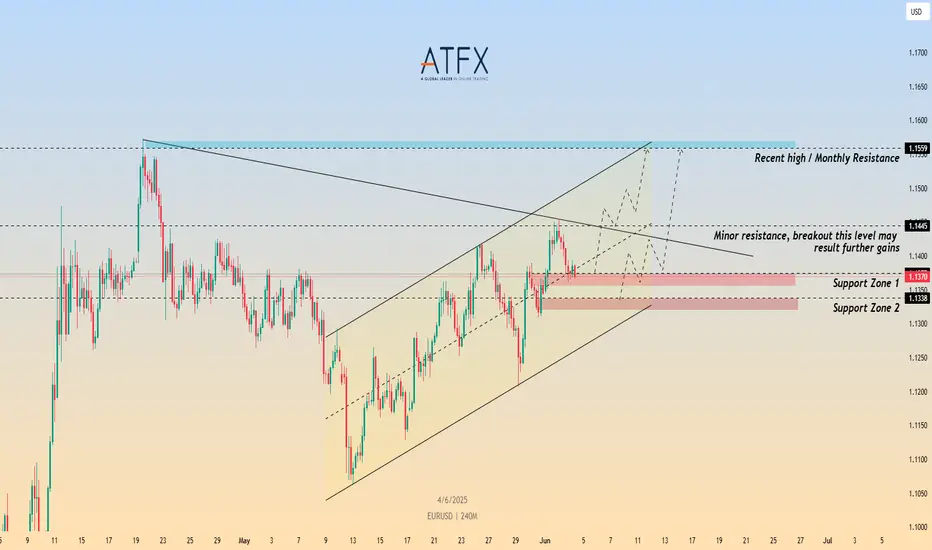
Technically, OANDA:EURUSD EUR/USD is still trading within a rising channel but rejected key minor resistance zone just below the descending trendline. A confirmed breakout above this area could open the path toward monthly resistance near 1.1559. On the downside, Support Zone 1 (around 1.1375) must hold to maintain the bullish bias; further weakness may expose Support Zone 2 (around 1.1338)
Resistance : 1.1445 , 1.1559
Support : 1.1375 , 1.1338
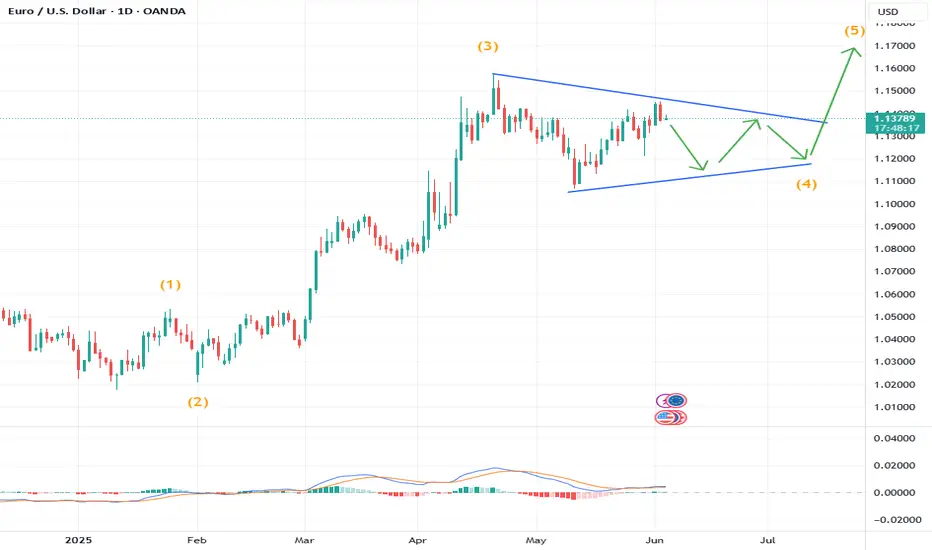
Elliott Wave Insight Into EUR/USD’s Recent MovesThe EUR/USD chart has delivered a clean Elliott Wave sequence, which helps us forecast what may come next.
Wave Count Overview
The structure leading up to the high shows a clear five-wave impulsive rally, ending at Wave 3 in yellow.
This was followed by a corrective A-B-C zigzag, with:
A sharp Wave A down
A shallow Wave B bounce
A clean Wave C drop, matching Wave A in length, bottoming at the 100% Fibonacci projection around 1.10711.
Why This Matters
Elliott Wave theory tells us that a completed zigzag correction—especially when followed by a consolidation like a triangle—often leads to a continuation in the direction of the larger trend. If this consolidation is indeed a Wave 4 triangle, Wave 5 may soon emerge with strength.
What to Watch For:
Breakout from the current flag/triangle pattern.
Confirmation via price closing above the Wave B high.
Strong bullish momentum and rising volume as signs Wave 5 is kicking off.
Conclusion
EUR/USD may be gearing up for a Wave 5 breakout, following a classic zigzag correction and potential triangle consolidation. If this pattern breaks to the upside, it could offer a great trend continuation trade opportunity.
Has EUR/USD entered a medium-term correction?The EUR/USD has experienced a corrective pullback in a range-bound manner, touching the 1.14 level during the European session, approaching the Bollinger Band Midline support at 1.129. Earlier, the exchange rate retreated after encountering resistance near the 1.1450 key resistance level. Influenced by Euro-U.S. economic data divergences, the broader European market weakened, exerting downward pressure on the euro. Ahead of this week's ECB monetary policy meeting, the pair is likely to remain range-bound between the 1.1350 support and 1.1500 resistance levels.
If the ECB signals further monetary easing, the exchange rate may decline to test the 1.1350 support zone, with a potential extension of the downward move targeting the Bollinger Band Midline at 1.1292. Conversely, if the market deems the rate-cut expectations to be fully priced in and the ECB delivers a neutral policy stance, this could prompt the EUR/USD to retest the 1.1500 resistance level.
Humans need to breathe, and perfect trading is like breathing—maintaining flexibility without needing to trade every market swing. The secret to profitable trading lies in implementing simple rules: repeating simple tasks consistently and enforcing them strictly over the long term.
Trading Strategy:
buy@1.13500-1.13600
TP:1.13800-1.13900
EUR USD Trade Setup 1 hour timeframe EUR USD Trade Setup 1 hour timeframe
EUR USD has formed a Bullish Break and Retest pattern on the 1 hour timeframe and the price is currently at the retest level.
EURUSD Bullish Signal | Technical + Custom AlgoSmart Trend Signal | Technical Analysis + Custom Algorithm
This signal is the result of a combination of classic technical trend analysis and a proprietary software I personally developed.

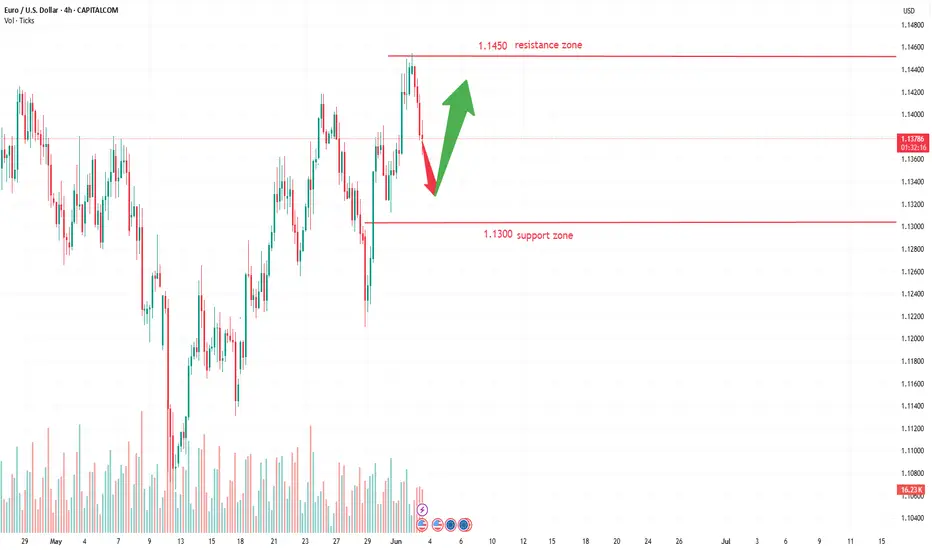
EUR/USD Eyes More Upside PotentialDuring the European session, the price showed a trend of first fluctuating and then rising sharply. Currently, the price is at 1.1433, higher than the intraday moving average of 1.1380, indicating that the bulls are in the dominant position. According to ING (International Netherlands Group), the EUR/USD has some intraday resistance at 1.1425, and above this level, it is expected to rise to 1.1500 in the short term. The euro has formed a bottom above 1.1200 and started a new round of upward movement against the US dollar. The EUR/USD has broken through the resistance level of 1.1280, with a bullish trend. The first major resistance level is at 1.1450. If the closing price is above the 1.1450 level, it may lay the foundation for another wave of upward movement. In this case, the currency pair may even break through the resistance level of 1.1500. The next major target for the bulls may be near the resistance level of 1.1580.
Humans need to breathe, and perfect trading is like breathing—maintaining flexibility without needing to trade every market swing. The secret to profitable trading lies in implementing simple rules: repeating simple tasks consistently and enforcing them strictly over the long term.
Trading Strategy:
buy@1.1300-1.1350
TP:1.1450-1.1500

EURUSD 4hEURUSD 4h
I threw a bucket into the sea, God
I have no control over my heart
I'm done today's speech, an analysis of the Euro to Dollar currency pair on the 4-hour time frame
which I published in early May
on the Trading View site
Let's see how far it turns out to be right, okay?
EURUSD Long Setup Brewing – Here's My Trade Plan!Keeping an eye 👀 on EURUSD – price has just broken market structure 📈 to the upside, and we're seeing clear higher highs 🔼 and higher lows 🔽 forming on the 4H timeframe 🕓.
Price has now rallied into a premium zone 💰, and i'm watching for a retracement 🔁 into my Fibonacci 61.8% 📐✨ point of interest for a potential long entry 🟢.
✅ Entry criteria?
Wait for price to pull back ⬅️ and then give us a break of market structure again 💥.
I'll be looking for confirmations on the 30min or 15min ⏱️ timeframes.
🚫 Not financial advice ✌️

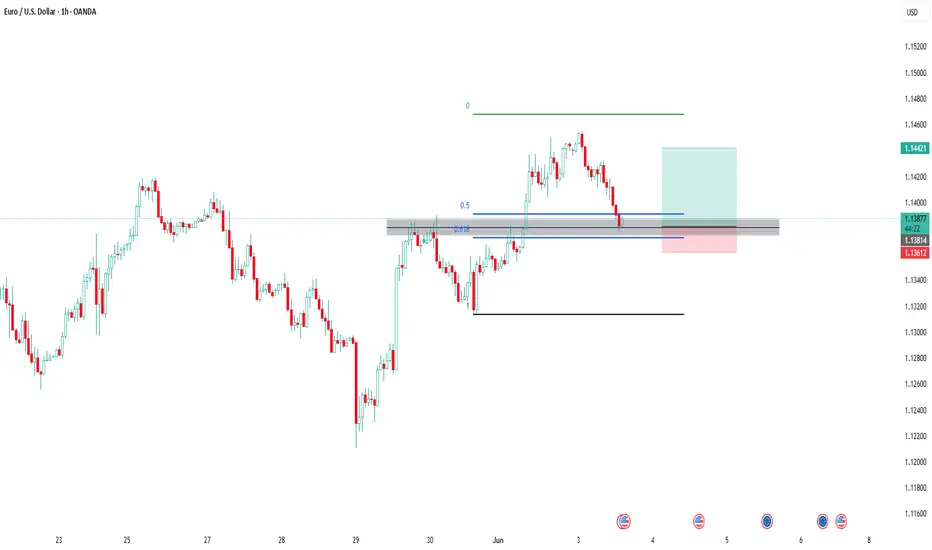
EUR/USD 1-Hour Timeframe – Long Position Setup
Entry Point: Initiate a long position slightly below 1.13513.
Stop-Loss Range: Set between 1.13056 and 1.13041 to manage risk.
Target Levels:
Primary Target: A breakout above 1.13822.
Secondary Target: A potential retest of 1.14304.
Important Note:
Avoid entering a long position if the price falls below 1.13056, as this may indicate a bearish reversal.
Tags: OANDA:EURUSD

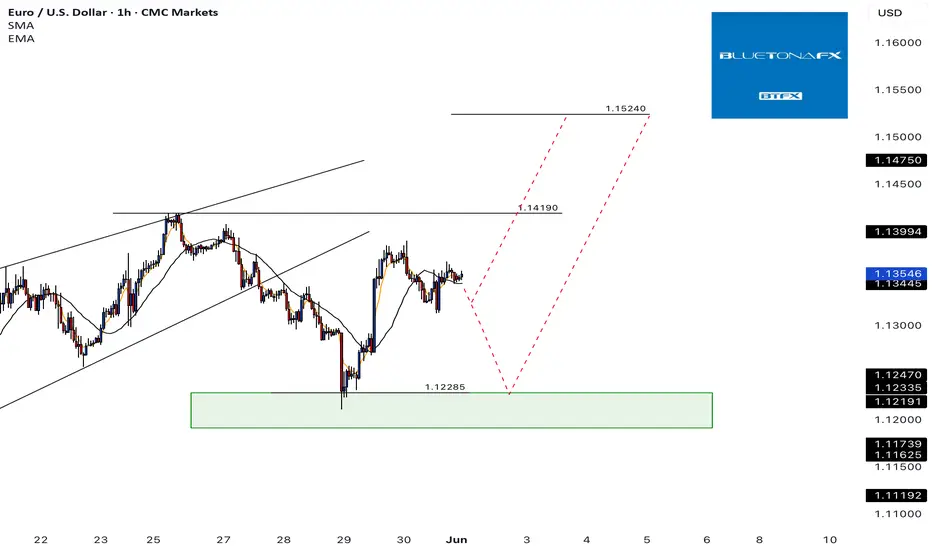
EUR/USD Update: Bullish Outlook Towards 1.14190 and BeyondHi Everyone,
As we projected in our analysis last week, EUR/USD corrected throughout the week and approached a retest of the 1.12000 level.
We expect the price to potentially retest 1.12000 and confirm it as support before advancing further to challenge the May 26 high of 1.14190. This would further reinforce our outlook for a potential long-term bullish trend.
Of course, the price could also challenge the 1.14190 high without a second retracement, should there be strong buying pressure early in the week. A successful breach of this level would likely drive the price higher towards the 1.15240 level.
We will provide further updates on the expected path for EUR/USD should the price reach this target.
The longer-term outlook remains bullish, with expectations for the rally to extend toward the 1.2000 level, provided the price holds above the key support at 1.10649.
We will continue to update you throughout the week with how we’re managing our active ideas and positions. Thanks again for all the likes/boosts, comments and follows — we appreciate the support!
All the best for the week ahead. Trade safe.
BluetonaFX
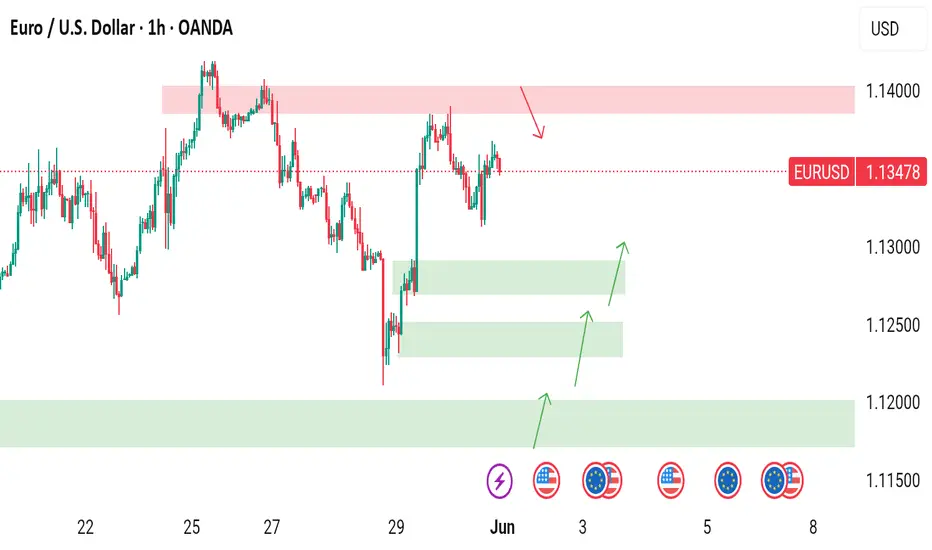
Can look for buy opportunities?EUR/USD Analysis Based on Engulfing Zones:
The red zone that has been marked is based on a weekly engulfing sell. The market has already touched this zone and dropped from there.
Now, among the green zones marked, the first one is taken from a 4H (4-hour) engulfing pattern, which has slightly less potential compared to the weekly one. However, the market can still go for a buy from here.
For now, wait until the market taps into any of the buy zones—then we can look for buy opportunities.
Three zones have been marked.
DYOR (Do Your Own Research)! Not Financial Advice.
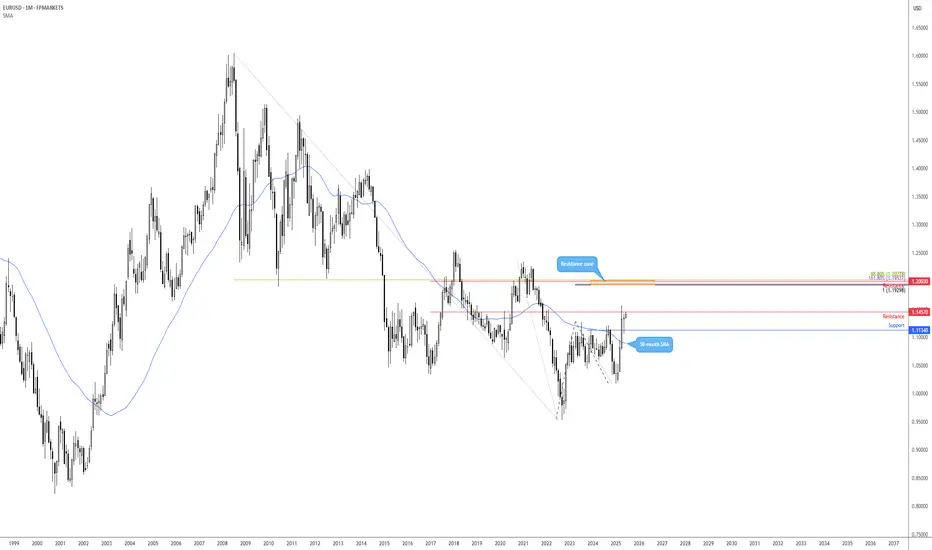
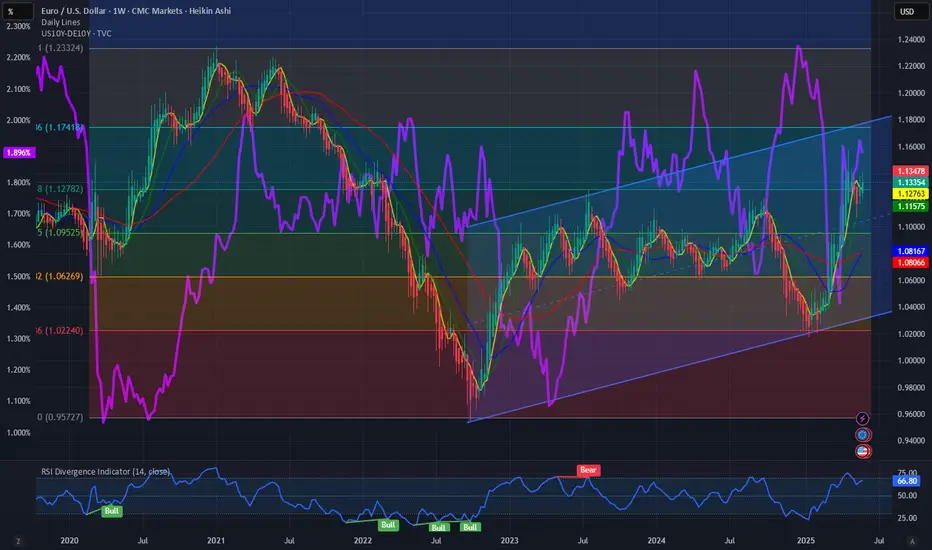
Story behind EURUSD chart and US10Y and DE10Y risk premiumLet’s have a look at the Currency and Bond markets today after an eventful last few weeks in both markets. After Moody’s downgrade of the US Gov bonds the markets look seemingly quiet. There has been no sudden spike in the US10Y. But it makes lot of sense to look beneath the hood and compare the Bond and the currency markets. Today we are looking into the 2 largest currency pairs, i.e. FX:EURUSD and the largest bond markets i.e. US10Y and German 10Y.
It is astounding to observe how the Fib retracement levels from the peak and troughs in the FX:EURUSD and TVC:US10 - TVC:DE10Y charts coincide. Both indicators at @ 0.618 Fib levels. As anyone would expect when the FX:EURUSD makes new highs the diff between TVC:US10Y and TVC:DE10Y hits new highs as investors long the FX:EURUSD chart and in that way hedge the risk in the TVC:US10Y without going short TVC:US10Y which will then adversely affect the investors portfolio. Institutional investors have been unwinding the long position in the TVC:US10Y by going long EUR, YEN and CHF in the currency markets without explicitly selling the US10Y.
Going back to the charts, what can we expect in the medium to long term? In my expectation both the charts can reach 0.786 Fib level and subsequently the 1.0 Levels. This will take the FX:EURUSD from 1.13 to 1.18 by the end of 2025 and then to our long-term target of 1.25. If those levels hold onto in the currency markets, then the risk premium of TVC:US10Y over TVC:DE10Y which is denoted in the chart by TVC:US10Y - TVC:DE10Y will go from 1.9% to 2.1% and then top out at 2.3%. May be this is the way USD will lose some of its market share as world reserve currency status.
Verdict: USD Reserve currency status weakening. Buoyant FX:EURUSD marching towards 1.25. TVC:US10Y - TVC:DE10Y can reach 2.3%.
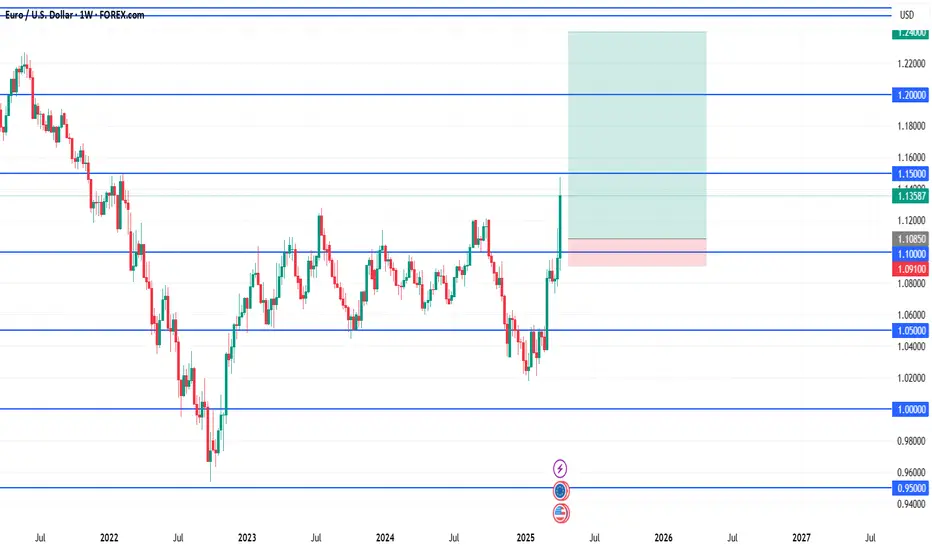
What's your view ( scenerio 1 or 2 )
---
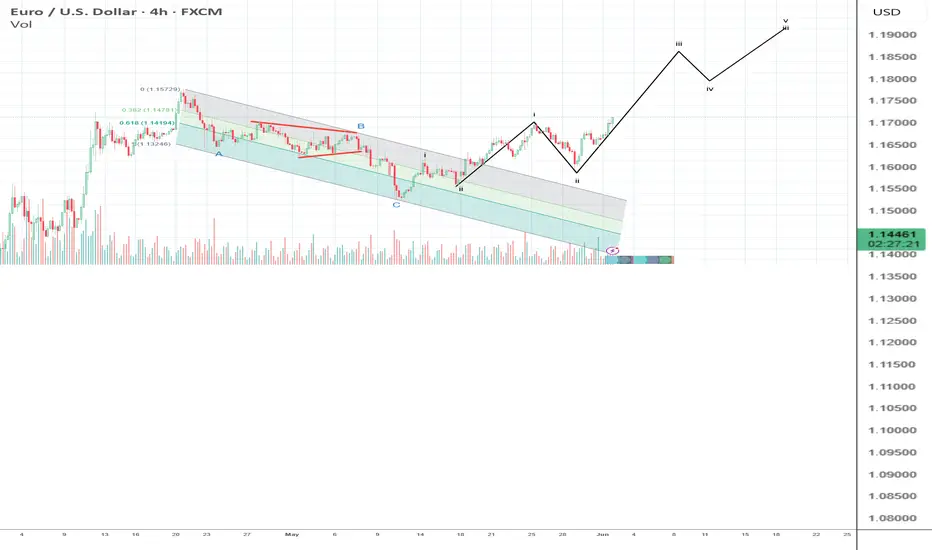
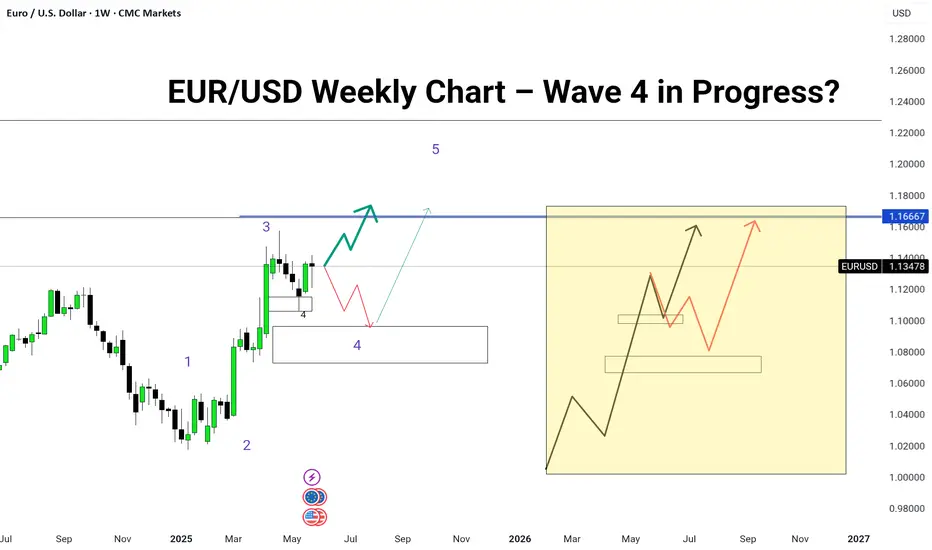
📈 EUR/USD Weekly Chart – Wave 4 in Progress?
Wave 3 looks complete and price is now hovering in a key correction zone, hinting at the start of Wave 4.
Two possible paths are unfolding:
🔴 Scenario 1: Shallow Wave 4 correction → breakout to Wave 5, targeting 1.16667 and beyond.
🔵 Scenario 2: Deeper Wave 4 correction → retest of demand zone near 1.08, followed by a strong Wave 5 rally.
🧠 Elliott Wave traders, it’s time to stay sharp!
The reaction near the mid-box and support zone could define the next major move for the Euro.
💬 What’s your bias here — is this the start of Wave 5 or a fakeout before a deeper drop?
Comment your view 👇
#EURUSD #ElliottWave #ForexWeekly #GreenFireForex #WaveAnalysis #TechnicalAnalysis #SupplyAndDemand
---
EUR/USD Potential longs to the upsideEU Weekly Outlook — Bullish Pro-Trend Setup in Focus
This week, my EU analysis is centered around the pro-trend movement to the upside. Price has recently broken structure and in doing so, has left behind clean demand zones on the 5H and 3H timeframes. I’ll be watching closely to see when price decides to mitigate these levels for a potential long setup.
Since price is still a bit far from these zones, short-term sells may be possible, but with no strong nearby supply, I’ll be staying patient and letting price action guide me. The key is to avoid marrying any one bias and remain adaptable.
Confluences for EU Buys:
- Strong bullish structure on higher timeframes
- Clean and unmitigated 5H and 3H demand zones
- Plenty of liquidity above, including Asia highs
- This is a pro-trend trade, aligning with market flow
- DXY analysis supports a bullish EU outlook
P.S. If price shifts and breaks structure to the downside, then we could consider short-term sell setups — but for now, I’m focused on the long opportunity forming from demand.
Have a great trading week and stay sharp! 🧠💹
