EUR/USD 4H Outlook - Wave 5 SetupElliott Wave Structure:
We're mid-cycle of a larger impulsive wave count:
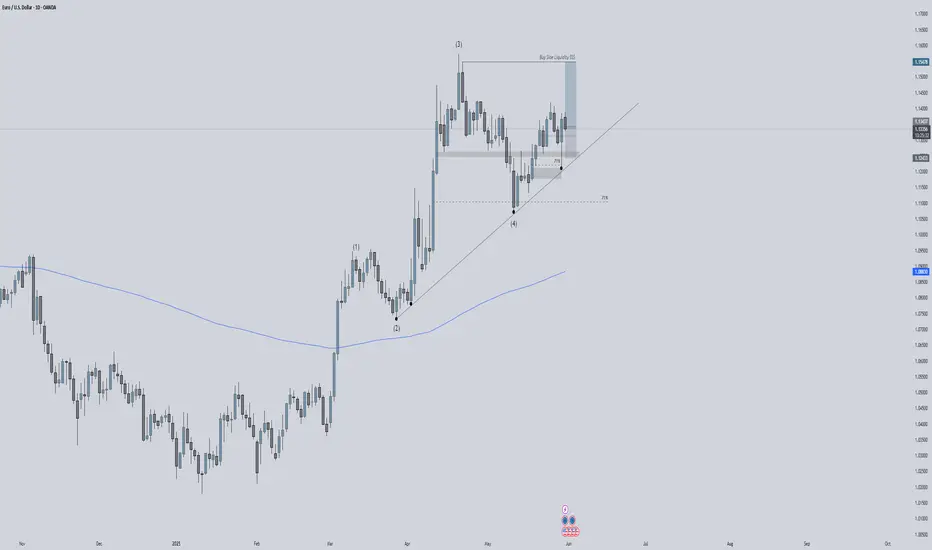
Wave (1) through (4) appear completed
Price is now potentially building the early phase of wave (5)
Subwaves within this current cycle also show clean internal structure:
Latest corrective wave (4) held just above invalidating level at 1.12236
Strong confluence at 71% Fib + demand + structure → ideal wave (4) termination
Price Action & Confluence:
Break and retest of the descending correction confirms bullish continuation
Higher low formed above major structure (X), aligning with wave (4) bottom
Trendline + EMA + volume spike on reaction = institutional interest
Key Levels:
🔴 Invalidation: 1.12236 (break below invalidates wave (4) structure)
📈 Targets for Wave (5):
Short-term: 1.1480 (prior high)
Medium-term: 1.1983 (measured move of wave (5) projection)
🚀 Summary:
EUR/USD is primed for a bullish wave (5) extension. With a clean wave count, a confirmed bounce off the 71% retracement, and price holding above invalidation, bulls are in control unless 1.12236 breaks.
Eurusdlong

EURUSD,GBPUSD and AUDUSD Analysis todayHello traders, this is a complete multiple timeframe analysis of this pair. We see could find significant trading opportunities as per analysis upon price action confirmation we may take this trade. Smash the like button if you find value in this analysis and drop a comment if you have any questions or let me know which pair to cover in my next analysis.

EUR/USD - BUY BUY BUY!Here in my personal Opinion I can see a few potential reasons to buy with high confidence.
Firstly- Weekly timeframe is showing a Bullish movement with us closing last week with a strong volume candle.
Secondly- On the Daily time frame we can see this is a high possibility of a 5th leg of elliots wave to finish this Bullish run.
Thirdly- The Daily has pushed out of the 71% level from the first demand zone. Following this on the 4H Time frame we can notice this previous push has also giving a strong Liqudity Grab into the new 71% level telling me Buyers are still highly in control.
I will be looking to trade into Buy side Liquidity after this Volume gap has been filled
Follow along for more updates
Bullish Breakout in EUR/USD: Key Levels to Watch This WeekHi everyone,
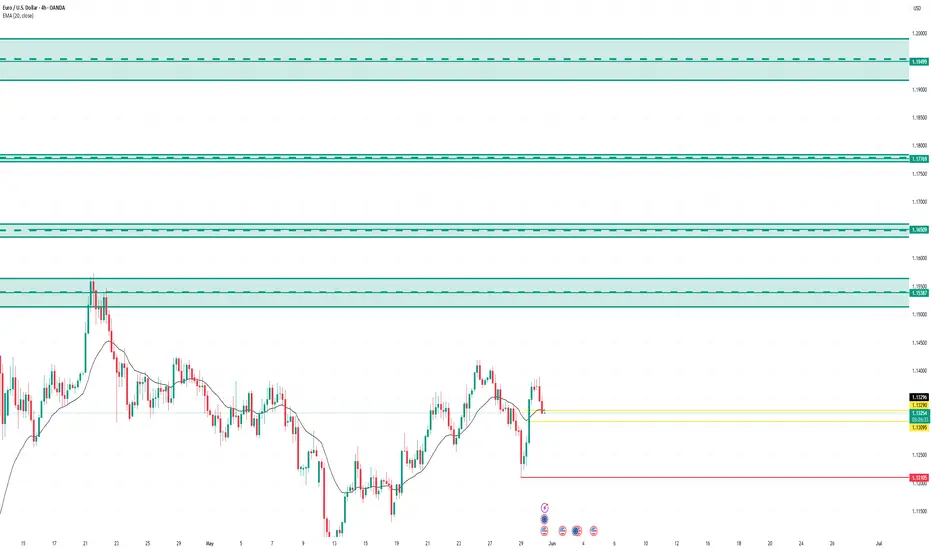
EUR/USD had a strong week, climbing higher from the May 12 low and further reinforcing our view of a potential long-term bullish trend.
We anticipate further upside towards the 1.13768–1.13940 zone, followed by a possible pullback toward the 1.1200 area. We’ll share more updates on the expected path for EUR/USD if and when price reaches that zone.
The longer-term outlook remains bullish, and we expect the rally to extend towards the 1.2000 level, as long as price holds above the 1.10649 support.
We’ll be keeping you updated throughout the week with how we’re managing our active ideas. Thanks again for all the likes/boosts, comments and follows — we appreciate the support!
All the best for the week ahead. Trade safe.
BluetonaFX

EURUSD is Ready for a Bullish MoveHello Traders
In This Chart EURUSD HOURLY Forex Forecast By FOREX PLANET
today EURUSD analysis 👆
🟢This Chart includes_ (EURUSD market update)
🟢What is The Next Opportunity on EURUSD Market
🟢how to Enter to the Valid Entry With Assurance Profit
This CHART is For Trader's that Want to Improve Their Technical Analysis Skills and Their Trading By Understanding How To Analyze The Market Using Multiple Timeframes and Understanding The Bigger Picture on the Charts
EURUSD Analysis - Waiting for movement
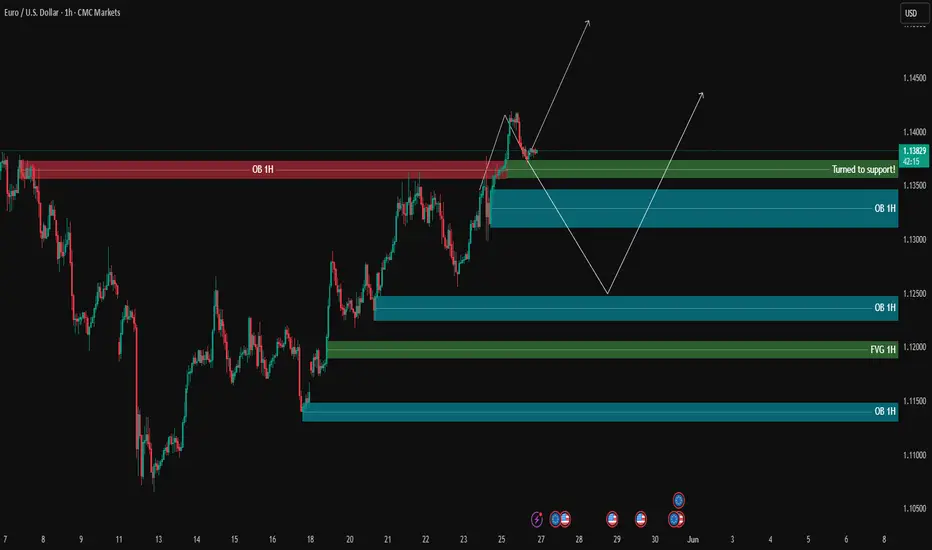
EURUSD has broken above the 1H resistance and has retested it, which is now acting as temporary support.
🔄 If price starts ranging around this level, we could see a short-term bearish move of a few dozen pips, targeting the buy-side liquidity and unfilled orders highlighted on the chart.
📈 However, if price gains bullish momentum from here, there's a potential for a 100-pip upward move.
We’re currently watching how price interacts with the supply and demand zones, to align our entries with it on the lower timeframes.
🔍 Insight by ProfitaminFX
If this outlook aligns with your bias, or if you see it differently, feel free to share your perspective in the comments. Let’s grow together 📈
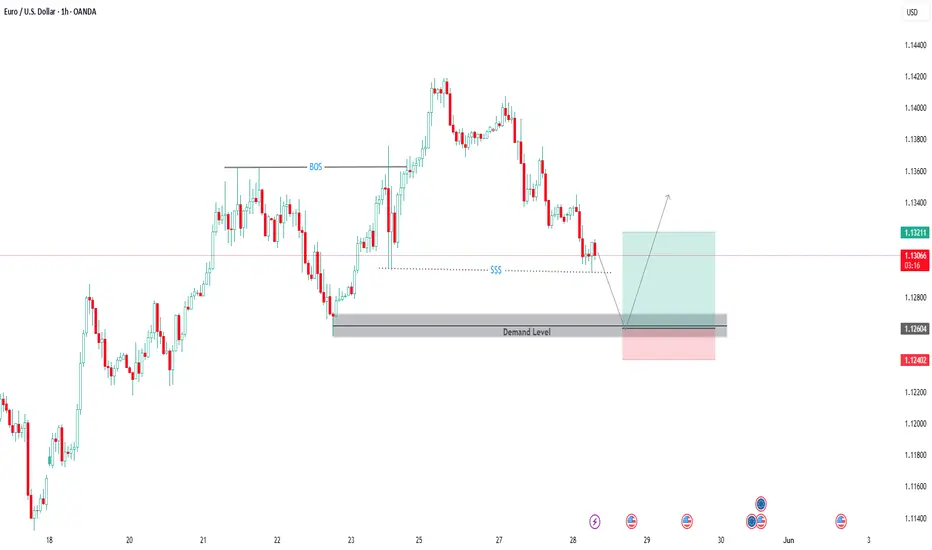
EUR USD Trade Setup 1 hour timeframe EUR USD has formed a demand level around price 1.12600 and the market is slowly approaching this level, we need to wait for price to tap on the demand zone before making any trading decisions.
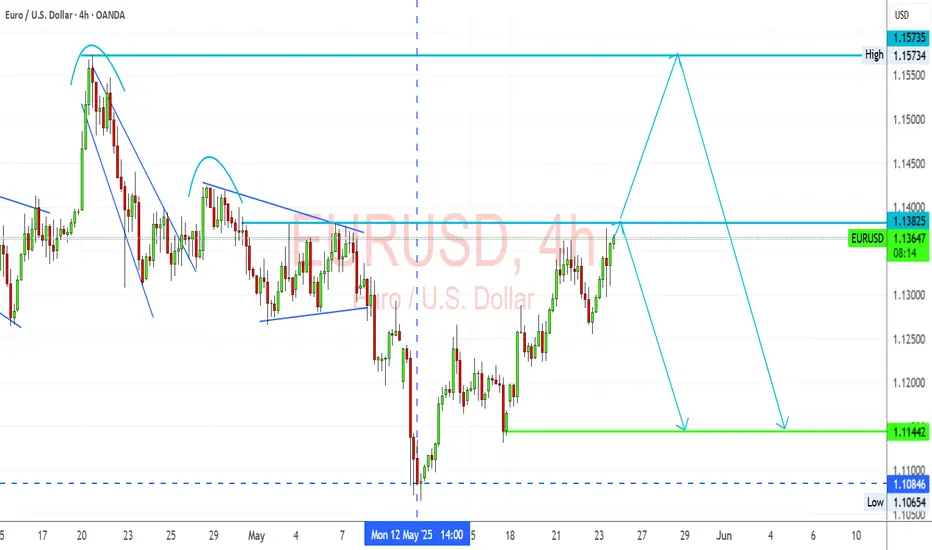
EURUSD Reaches Key Resistance – Reversal or BreakoutEURUSD has rallied back to the 1.1382 resistance level, a zone where price previously rejected multiple times. Current structure suggests price is approaching a decision point, where it may either:
Form a double top or head-and-shoulders reversal
Or break out toward 1.1573, the next major resistance
Key Levels:
Resistance: 1.13825 → Critical decision zone
Support: 1.11442 → First major downside target
Deep Support: 1.10846 → Recent low
Scenarios to Watch:
🔹 Bearish Case (Primary Setup)
Price fails to break above 1.1382
Reversal candlestick forms below resistance
Breakdown may target:
1.1144 (first support)
1.1084 (continuation target)
🔹 Bullish Case (Less Likely Unless Confirmed)
Break and close above 1.1382
Bullish continuation to 1.1573
Would signal shift in medium-term trend bias
Chart Pattern Notes:
Price has made multiple lower highs, but also held structure
A triple top or reversal setup is forming unless bulls break decisively
Bearish wedge and neckline structures from past price action support downside risk
Fundamental Watch:
USD volatility from Fed speakers, PMI data
Eurozone risk sentiment and ECB inflation comments
Correlation with DXY (which is near support)
Conclusion:
📌 Rejection at 1.1382 likely leads to downside toward 1.1144
📌 Break above 1.1382 invalidates bearish setup and targets 1.1573
Wait for confirmation candle or momentum before execution.
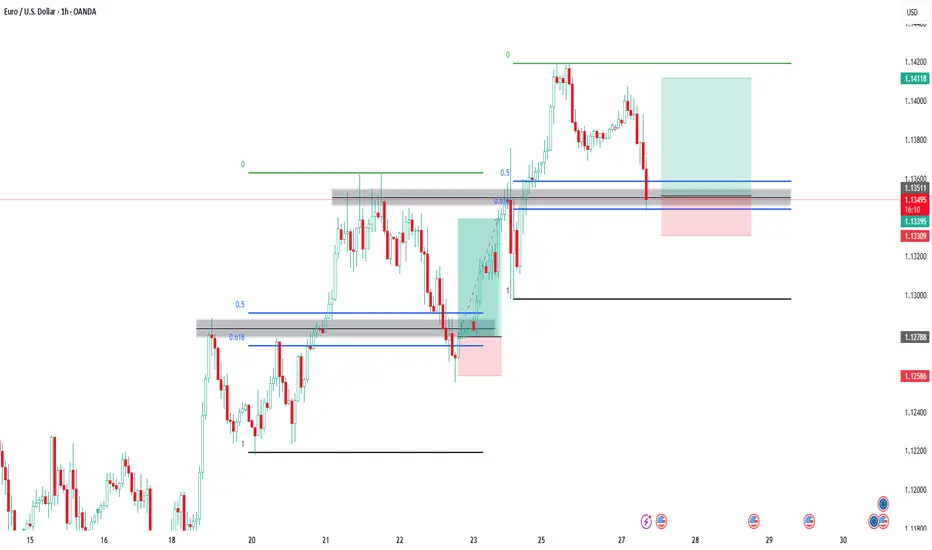
EUR USD Entry Setup EUR USD has formed a bullish break and retest and has also retraced back to the 50-618 FIB retracement level.
The trend is bullish so we will continue to look for buying opportunities
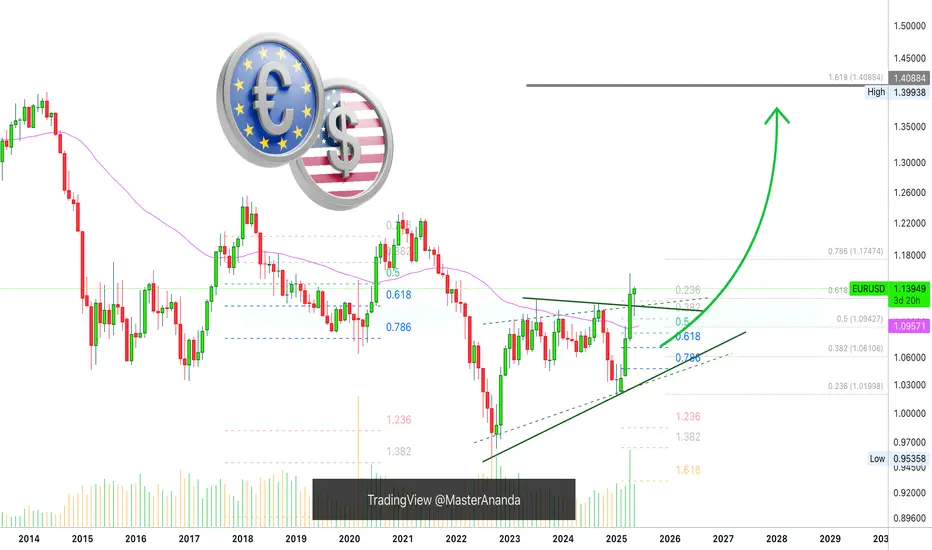
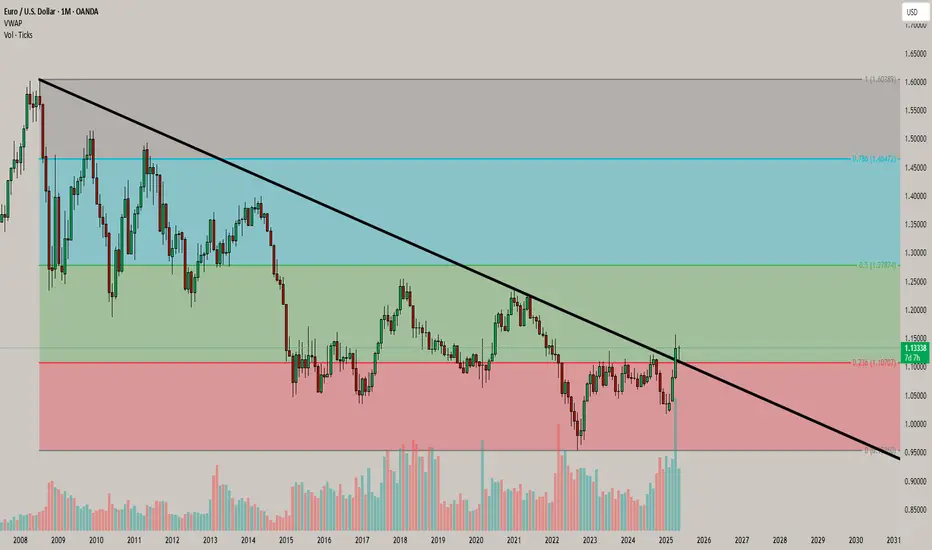
Deciphering EURUSD —Highest Level Since 2018 (1.40)This was a hard chart, I couldn't quite put my finger on it. I had to check multiple timeframes and several indicators, it was all mixed, plus, I had the geopolitical landscape in mind which made it even harder. All is clear after looking at the monthly timeframe. The weekly and daily MACD were also of help. MA200 revealed the trend. The RSI as well.
Here is the conclusion: The Euro is going to rally against the dollar. Next long-term target is 1.40 as shown on the chart. There will be a strong rise on this pair.
Current monthly candle is quite revealing, this month will close ultra-strong, super bullish signal. Four months closing green. Rising volume.
I don't know how you trade this stuff but the trend is up. Betting with the trend can increase positive results. EURUSD is going up. Up, up, up, up, up, up, up.
Namaste.
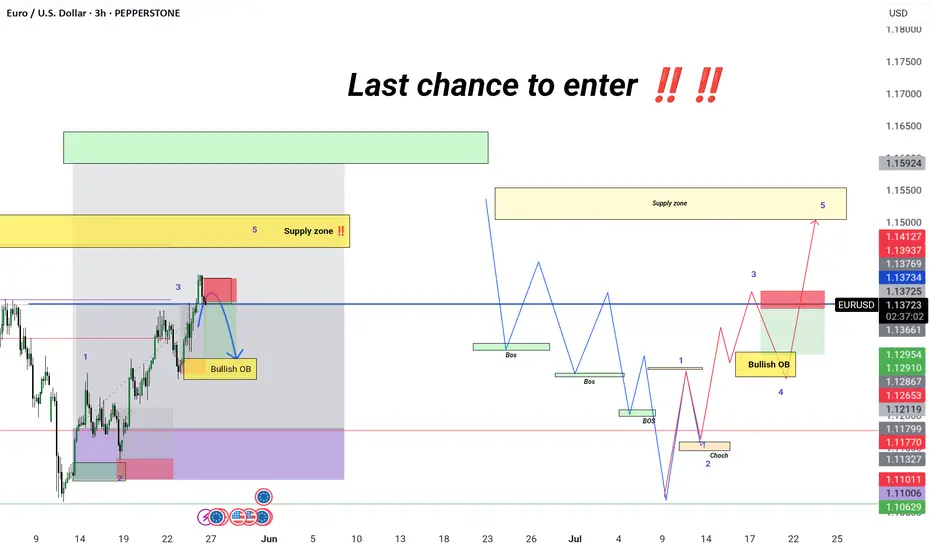
Last. Chance yo meet profit. (EURUSD)
Trade Idea (Short-Term Setup):
1. Sell Setup (Short-term correction - Wave 4)
Entry: Near current price (1.13730), especially if bearish confirmation appears on a lower timeframe (like bearish engulfing, break of structure).
Target: Bullish OB zone around 1.12910–1.12867.
Stop Loss: Just above the recent high or red zone (~1.14127).
Risk-Reward: Looks favorable (~1:2 or more).
EUR/USD Breakdown Imminent – Rising Wedge at Major ResistanceOn the 1H chart, EUR/USD has developed a Rising Wedge pattern, a classical bearish reversal formation. The pair has been moving higher within a tightening structure, marked by converging trendlines—indicating weakening bullish momentum.
What makes this pattern more compelling is that it’s occurring just below a well-defined Major Resistance Zone around 1.1380–1.1400, where previous attempts to break higher have failed. This area has historically acted as a strong supply zone, increasing the probability of a reversal.
🔍 Key Technical Components:
Rising Wedge Pattern: The wedge reflects a temporary uptrend with weakening strength. Bullish candles are getting smaller, and volume appears to be fading (not shown here but typically expected in this setup).
Black Mind Curve Support: A custom support curve illustrating the underlying parabolic trend. Once this is broken, it often leads to a steeper selloff.
Change of Character (CHOCH): Around the 1.1260 level, there's a possible shift from bullish to bearish structure. If price breaks and closes below this level, it will likely confirm a momentum reversal.
Target Projection: The measured move and previous structural support suggest a drop toward 1.11479, which coincides with a prior demand zone. This also aligns with a potential liquidity sweep beneath recent lows.
🔔 Price Action Signals to Watch:
Bearish engulfing candles or strong rejections from the wedge’s upper boundary.
Breakdown below the lower wedge line and the curved support.
CHOCH confirmation – market structure shift from bullish to bearish around 1.1260.
Retest of the wedge breakout level, followed by continuation to the downside.
📌 Trading Plan (Not Financial Advice):
Entry: On break and retest of wedge support.
Stop Loss: Above the wedge high or resistance (~1.1400).
Target: 1.11479 for first take-profit level; partials can be taken at 1.1260 if needed.
📉 Bias:
Short-Term Bearish – Only upon wedge breakdown and confirmation.
🧠 Minds Section (Expanded for Traders' Perspective)
EUR/USD is approaching a critical technical juncture. We are seeing a textbook rising wedge formation into a major resistance zone, signaling exhaustion of bullish strength. While the pair has enjoyed upward momentum, price action is showing signs of slowing, and the structure is no longer sustainable.
This pattern often traps late buyers before reversing. We are closely watching the lower wedge boundary and curved support—a breakdown here will likely trigger bearish momentum, especially with the CHOCH area near 1.1260 acting as a structure-defining level.
If sellers gain control and the breakdown confirms, there’s high probability for a fall to 1.11479, targeting prior demand zones and potential liquidity pockets.
Now is the time to be cautious if long, or begin planning short setups. Wait for confirmation—no need to rush the trade.

EURUSD,GBPUSD,AUDUSD and NZDUSD possible bounce?Hello traders, this is a complete multiple timeframe analysis of this pair. We see could find significant trading opportunities as per analysis upon price action confirmation we may take this trade. Smash the like button if you find value in this analysis and drop a comment if you have any questions or let me know which pair to cover in my next analysis.

EURUSD H4 Chart Outlook for Shorter Term 26-30 May 25You are seeing EURUSD H4 Chart, Right EURUSD is standing in mid-term Bullish Trend with Bullish Channel
Kindly follow the Zones Accordingly and always place SL
Disclaimer: Forex is Risky
EURUSD Weekly PerspectiveOn ICT Cycles, Maybe EUR Can Go Higher To Buyside Equals..
But it needs confirmation from the shorter-term views and confirmation from the dollar index.
Over time, this idea will be updated according to the coming days.
CPI profile was able to make a good climb and probably provides a fairly good confirmation for the continuation of the upward trend.
Have a good week and trades.
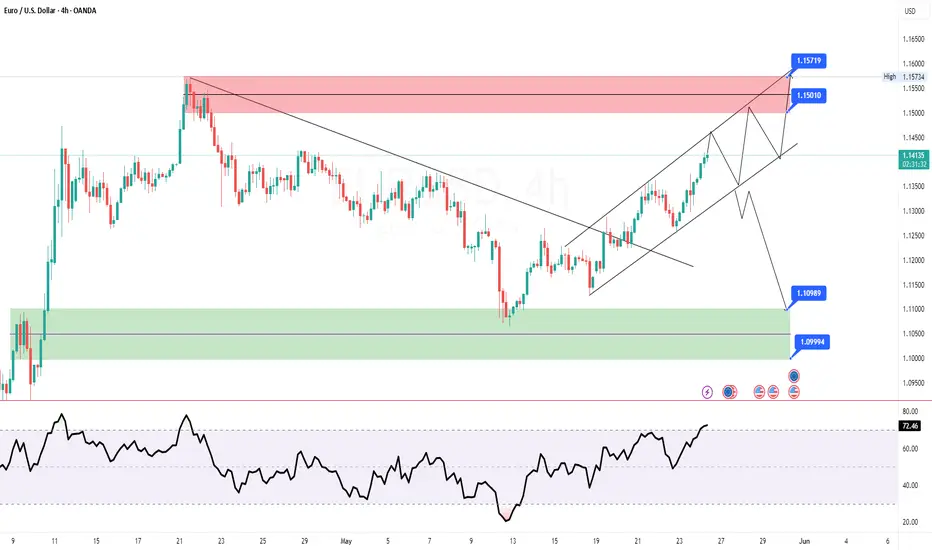
EURUSD Breaking Above Resistance Line; Wave 5 In PlayEURUSD moved nicely higher in April, into the 1.15–1.16 area, a resistance where pair slowed down at the end of wave 3, that put retracement in play. However, a pullback has been made in three waves, so its seen as temporary within the broader uptrend. We saw some deeper retracement down to 1,1, near the 38.2% Fib from where we can see some nice turn up, above the trendline resistance so it appears that bulls are in play for wave 5. Therefore, be aware of more upside afte some intraday dips. Support is at 1.1266 area.
GH

Week of 5/25/25: EU AnalysisExtremely bullish last week leads to my bias being long this week until the weak daily structure is broken.
Thanks for coming, goodluck this week!
Major News:
PMI - Thursday

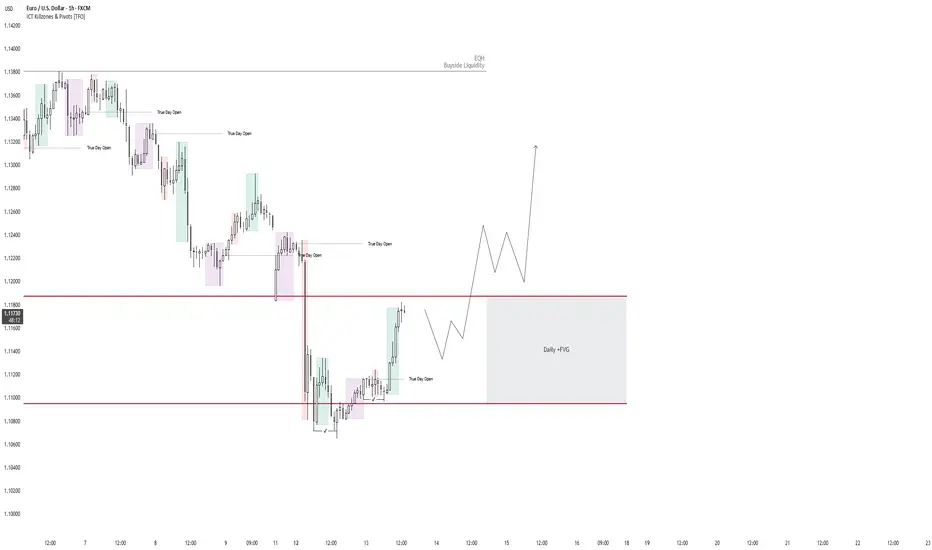
done and dusted, EUR/USD goes, “Hold my beer , lets cheersEUR/USD: Smart Money Just Played a Masterclass
Price dipped below support — looked like a breakdown, right? Wrong.
Here’s the playbook they used:
Liquidity Grab: Took out sell stops sitting below key levels.
Bear Trap: Price snapped back up, leaving bears trapped and confused.
Order Block: Zoom in on the candles before the spike — Smart Money bought heavy there.
Bullish Continuation: With bears trapped and bags full, price is now free to climb.
The fake fall fuels the real rise. Classic Smart Money setup — watch this ride up.

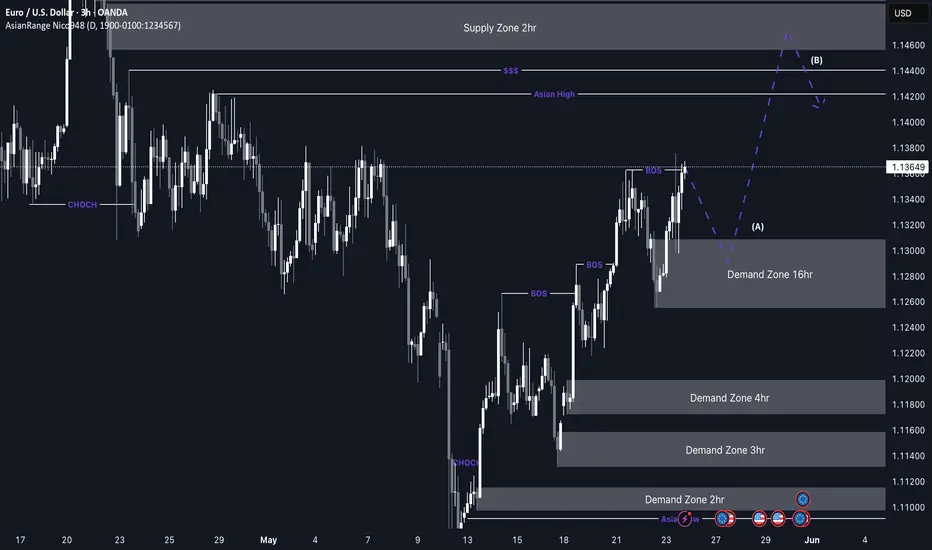
EUR/USD pro trend idea from 1.13000EUR/USD Weekly Outlook – Pro Trend Setup in Focus
My outlook for EUR/USD this week aligns closely with my GBP/USD analysis, as both pairs tend to move in a similar direction. For EU specifically, price is currently much closer to a valid demand zone, making the pro-trend continuation idea more likely in the short term.
After the recent break of structure to the upside, price left behind a well-defined 16H demand zone, which could serve as the base for another bullish rally. There’s also a significant buildup of liquidity above and no major nearby supply zone, so for now, I’ll be focusing solely on pro-trend long setups.
If price doesn’t retrace as deep as the 16H demand zone and continues pushing higher, I’ll be on the lookout for a new demand zone to form that we can then trade from.
Confluences for EU Buys:
- Price is nearing the 16H demand zone that caused the most recent break of structure
- Strong bullish momentum on the higher timeframes
- Clean liquidity above that remains untapped
- DXY continues to move bearish, aligning with a bullish EU outlook
P.S. I’ll be watching for an initial pullback during the Asia session to see how price interacts with the 16H demand. Stay alert and trade smart — let the market come to your zones.
Have a great trading week, everyone! 🔍📈
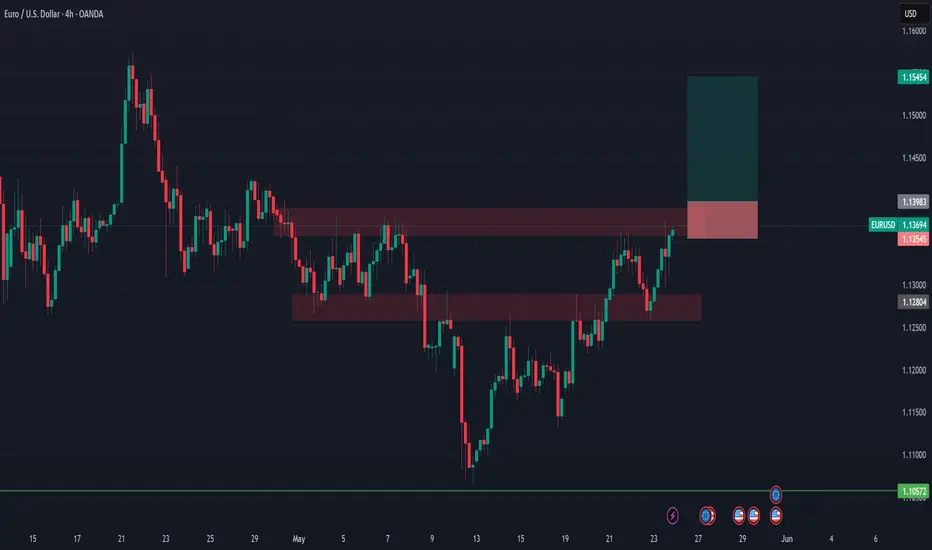
EURUSD Long Setup – Bullish Breakout PlayBias: ✅ Strong Buy
Timeframe: 4H
Pair: EURUSD
Week: 26–30 May 2025
🔍 Technical Analysis:
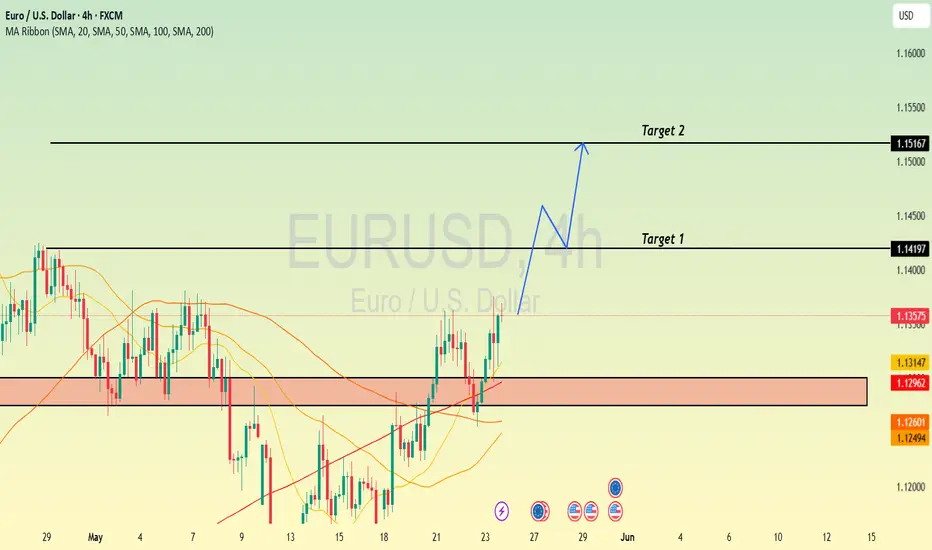
EURUSD has broken through a prior resistance and is currently testing a second resistance zone at 1.13983. I’m looking for a confirmed breakout above this level to enter long.
Entry: Break and 4H close above 1.13983
Stop Loss: Below support zone at 1.13545
Take Profit: Targeting resistance zone near 1.15454
Risk-Reward Ratio: ~3.36R
Structure: Higher highs forming, potential breakout continuation
🧠 Macro Confluence:
📉 USD Weakness: Dovish Fed + poor fundamentals (Investogenie Score 1.8 ↓, Conditional Score 3 ↓)
📈 EUR Strength: Improving Eurozone outlook, strong COT positioning, ECB easing bias
📊 Seasonal Bias: EURUSD bullish for this period
⚠️ Risk Management:
Watch for FOMC and GDP releases (USD) mid-week
Avoid premature entries without clear break and 4H confirmation
Optional: Wait for break & retest for higher probability
Drop your thoughts or setups below 👇
EURUSDWeak USD with tariff plan would maximize the efforts.
Meanwhile, higher EUR would aswell serve the same benefit.
I see it as an entropy of the market that this pair to rise.
EURUSD – 1H Update on Our Previous EURUSD Post +60 PipsAs expected from our last idea, price reacted well to our 1H Order Block zones.
🔹 Upon receiving bullish confirmation on the 3-minute timeframe, we entered a long position, which has now moved 60 pips in our favor.
📍 Current Setup:
Price is now at a decision point – around yesterday’s high (PDH) and the 1H supply (OB).
✅ If price breaks above PDH (dashed yellow line), it could lead to a clean break of the 1H resistance and continuation to the upside.
🚫 However, if bullish momentum weakens, there’s a real chance price may pull back to collect buy-side liquidity in the blue and green demand boxes below.
⚠️ It’s Friday – trade with caution!
Late-week volatility and false spikes are common before weekly close.
🔍 Insight by ProfitaminFX
If this outlook aligns with your bias, or if you see it differently, feel free to share your perspective in the comments. Let’s grow together 📈
