EURUSDWeak USD with tariff plan would maximize the efforts.
Meanwhile, higher EUR would aswell serve the same benefit.
I see it as an entropy of the market that this pair to rise.
Eurusdlong
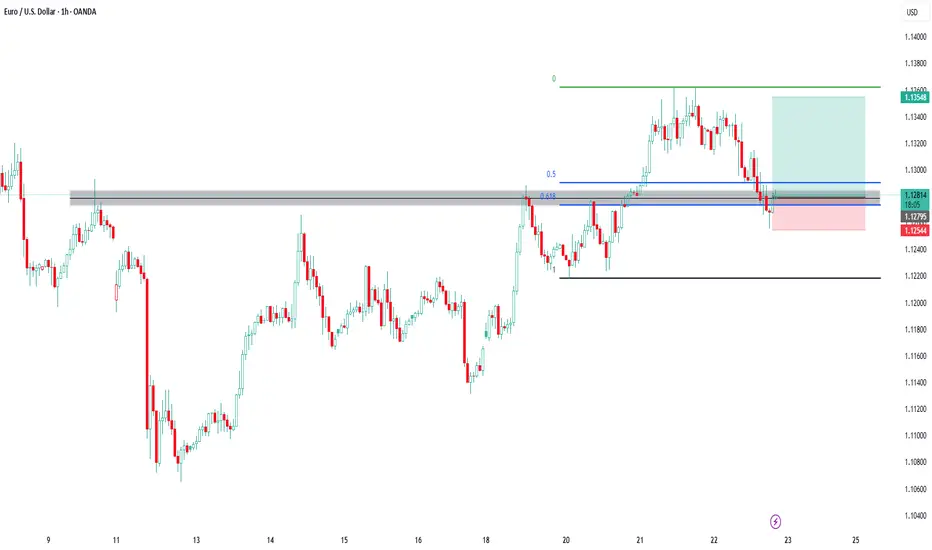
EURUSD – 1H Update on Our Previous EURUSD Post +60 PipsAs expected from our last idea, price reacted well to our 1H Order Block zones.
🔹 Upon receiving bullish confirmation on the 3-minute timeframe, we entered a long position, which has now moved 60 pips in our favor.
📍 Current Setup:
Price is now at a decision point – around yesterday’s high (PDH) and the 1H supply (OB).
✅ If price breaks above PDH (dashed yellow line), it could lead to a clean break of the 1H resistance and continuation to the upside.
🚫 However, if bullish momentum weakens, there’s a real chance price may pull back to collect buy-side liquidity in the blue and green demand boxes below.
⚠️ It’s Friday – trade with caution!
Late-week volatility and false spikes are common before weekly close.
🔍 Insight by ProfitaminFX
If this outlook aligns with your bias, or if you see it differently, feel free to share your perspective in the comments. Let’s grow together 📈

EUR USD Entry Setup 1 hour timeframe EUR USD Entry Setup 1 hour timeframe
Trade Setup: Bullish break and retest
Additional Confluence: Fib Retracement Level👌🏻⬆️
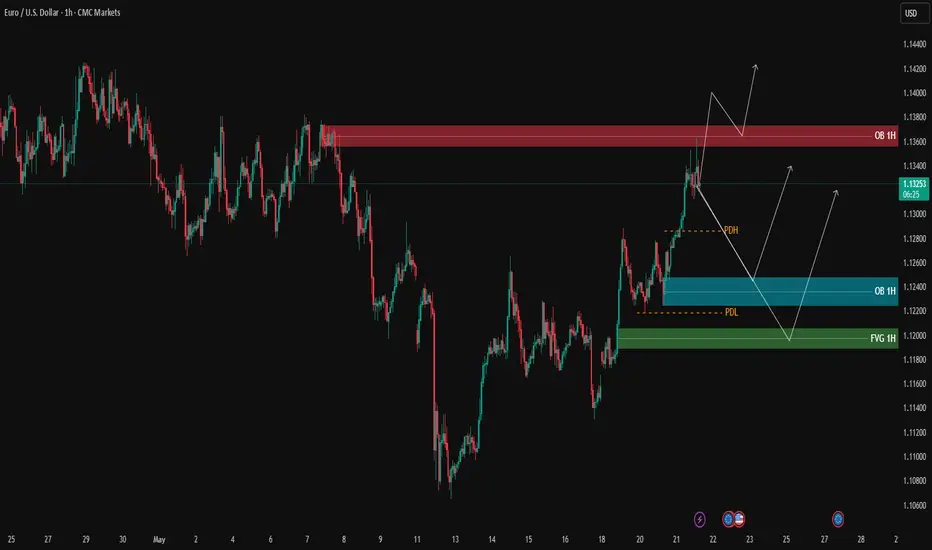
EURUSD – Testing 1H Supply Zone, Awaiting Confirmation | ProfitaAfter a strong bullish rally breaking previous highs, EURUSD is now reacting to the 1H supply zone (OB 1H) marked in red.
We’re seeing an initial bearish rejection from this zone. If sellers maintain control, price may retrace toward the lower demand areas:
Blue OB 1H zone (1.12200 – 1.12450)
Green FVG 1H further below
However, if buyers manage to push price above the red OB and close a candle above it, continuation to the upside remains a valid scenario.
📌 Key Levels
🟢 Support Zones:
1.12200 – 1.12450
1.11780 – 1.12000
🔴 Resistance:
1.13500 – 1.13800
⚠️ Note:
Watch for lower-timeframe (M5/M3) confirmations for entry. Only act on clear setups inside the zones.
🔍 Insight by ProfitaminFX
breaking above its previous swing high.GBP/USD Technical – Break of Structure, Liquidity Sweep, and Potential Downside Movement
The GBP/USD currency pair recently demonstrated significant bullish strength by breaking above its previous swing high, which resulted in a clear Break of Structure (BOS). This move indicated a continuation of the upward trend as the market pushed higher. However, the latest price action suggests a shift in sentiment that traders should be aware of.
Despite the earlier bullish momentum, the market has now swept the previous daily swing high—meaning it briefly moved above that level only to close back below it. This kind of price behavior often signals a potential liquidity grab rather than a sustained breakout. Such a move is frequently followed by a reversal or corrective move to the downside, as it indicates that institutional participants may have been targeting stop-losses or resting liquidity before driving the price in the opposite direction.
Given this, there is a growing possibility that the market may retrace further downward. A likely target could be the previously marked swing low, where additional liquidity may be resting. Moreover, beneath this level lies a Bullish Price Rebalance (BPR) zone, which could serve as an area of interest for a potential bullish reaction if the market taps into it.
At this stage, it's crucial to monitor price action closely and wait for further confirmations before taking any directional bias. Watching how the market behaves near the previous swing low and the underlying BPR zone can offer valuable insight into the next probable move.
As always, conduct your own thorough research (DYOR) before making any trading decisions. This is not financial advice and is intended solely for educational and analytical purposes.

EURUSD Pullback in Play – Next Stop: $1.1337EURUSD ( FX:EURUSD ) is moving in the Resistance zone($1.1310-$1.1162) while the upper line of the descending channel has been broken.
According to Elliott Wave theory , a breakout of the descending channel can at least confirm the end of a corrective wave . The corrective wave structure was a Double Three Correction(WXY) .
I expect EURUSD to rise to at least $1.1337 after completing a pullback to the upper line of the descending channel .
Note: If EURUSD touches $1.11590, we can expect further declines.
Please respect each other's ideas and express them politely if you agree or disagree.
Euro/U.S. Dollar Analyze (EURUSD), 4-hour time frame.
Be sure to follow the updated ideas.
Do not forget to put a Stop loss for your positions (For every position you want to open).
Please follow your strategy and updates; this is just my Idea, and I will gladly see your ideas in this post.
Please do not forget the ✅' like '✅ button 🙏😊 & Share it with your friends; thanks, and Trade safe.

From a short-term perspective, the bullish trend is expected to The EUR/USD exchange rate continued its upward momentum during the European session and is currently trading near 1.1320. As the US Dollar Index remains under pressure, the EUR/USD rate has gradually climbed. Market sentiment tends to seek alternatives to the US dollar and optimistic expectations of a potential peace agreement between Russia and Ukraine. The euro has performed strongly recently, mainly benefiting from two factors: the market's search for US dollar alternatives and optimistic expectations that the Russia-Ukraine conflict may reach a ceasefire agreement. According to Francesco Pesole, a foreign exchange analyst at ING, the overall European currencies have shown good momentum, with the Swiss franc and Swedish krona ranking among the top in the G10 currency list this week. This reflects that the market is (on one hand) seeking alternatives to the US dollar (Swiss franc), and (on the other hand) may be optimistic about the Russia-Ukraine peace agreement (Swedish krona, Norwegian krona). EUR/USD may continue to test the resistance range of 1.1410-1.1460. If US political uncertainty intensifies or economic data weakens, a breakthrough cannot be ruled out. However, positive US dollar news that may emerge at the G7 summit in Canada may limit the upside of EUR/USD before the end of this week.
In the market, there are no absolutes, and neither upward nor downward trends are set in stone. Therefore, the ability to judge the balance between market gains and losses is your key to success. Let money become our loyal servant.

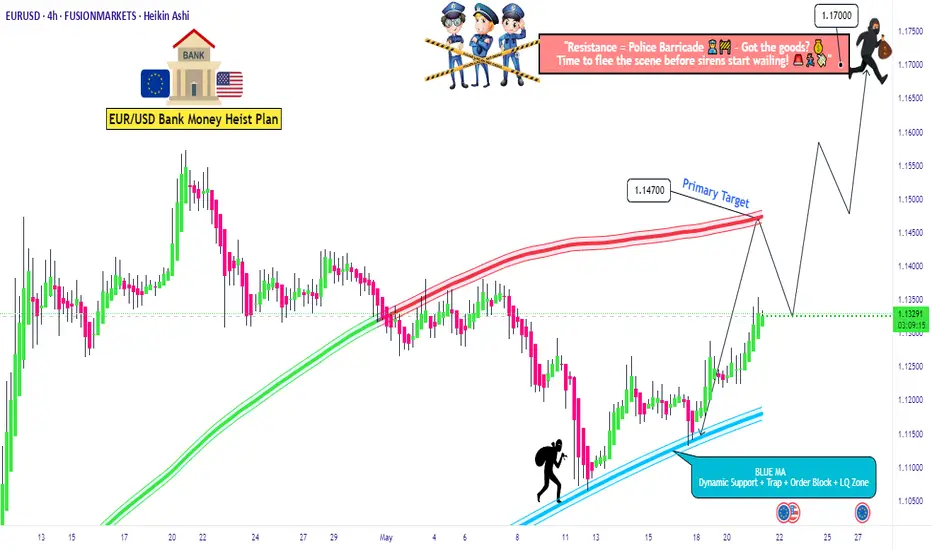
"Dare to Swipe EUR/USD Gains with Our Risky Heist Blueprint?"Ultimate EUR/USD Heist Plan: Snag Profits with the Thief Trading Strategy! 🚀💰
🌍 Greetings, Wealth Raiders! Ciao, Hello, Bonjour, Hola! 🌟
Fellow profit hunters, get ready to crack the EUR/USD "The Fiber" Forex vault with our slick Thief Trading Strategy! 🤑💸 This plan blends razor-sharp technicals and fundamentals to loot the market. Follow the chart’s long-entry blueprint to strike at high-risk zones like the Red MA (short-term traders) or the Red Zone Resistance (long-term traders). It’s a wild ride—overbought conditions, consolidation, and potential trend reversals mean bears are lurking! 🐻 Stay sharp, grab your profits, and treat yourself—you’ve earned it! 🎉💪
📈 Entry: Storm the Vault!
The market’s ripe for a bullish grab! 💥 Place buy limit orders within the most recent 15 or 30-minute swing low/high levels. Set alerts on your chart to stay locked in. 🔔
🛑 Stop Loss: Guard Your Loot!
Set your Thief SL at the nearest swing low on the 4H timeframe for day/swing trades. Adjust based on your risk tolerance, lot size, and number of orders. Safety first! 🔒
🎯 Targets: Claim Your Prize!
🏴☠️ Short-Term Target: 1.14700
🏴☠️ Long-Term Target: 1.17000
👀 Scalpers, Listen Up!
Stick to long-side scalps. Got deep pockets? Jump in now! Otherwise, join swing traders for the heist. Use trailing stop-loss to lock in gains and protect your stash. 💰
🐂 Why EUR/USD is Hot!
The Fiber’s bullish surge is fueled by key fundamentals. Dive into Macro, COT Reports, Quantitative Analysis, Sentiment, Intermarket trends, and future targets via the linkss below for the full scoop. 👉🔗. Stay informed to stay ahead! 📰
⚠️ Trading Alert: News & Position Management
News releases can shake the market like a heist gone wrong! 🗞️ To protect your profits:
🚫 Avoid new trades during news events.
🛡️ Use trailing stops to secure running positions.
💥 Boost the Heist!
Hit the Boost Button to supercharge our Thief Trading Strategy! 💪 Every click strengthens our crew, making it easier to swipe profits daily. Join the squad, trade smart, and let’s make money rain! 🌧️💵
EURUSD | Bullish Pennant Breakout – Retest Before the Target📊 EUR/USD (1H Timeframe)
The EUR/USD pair has shown a textbook example of a bullish pennant formation, which typically occurs during strong uptrends and signals a continuation of the bullish momentum. The price had an impulsive rally prior to the formation of the pennant, indicating a strong underlying bullish sentiment.
Following the rally, the market entered a period of consolidation where price action began to coil between two converging trendlines – this is the pennant structure, marked by lower highs and higher lows.
This tightening price action typically suggests that market participants are pausing to digest the previous move, often leading to another breakout in the same direction – in this case, bullish.
📐 Key Technical Elements Highlighted:
Bullish Pennant Formation:
Characterized by a sharp move up (flagpole) followed by a tight consolidation range (the pennant).
Volume generally contracts during consolidation and expands on breakout, confirming momentum.
Breakout and Retest:
Price has broken above the upper resistance line of the pennant.
Now pulling back for a retest, a healthy technical behavior often seen in strong setups.
This pullback offers a second chance for entry for traders who missed the initial breakout.
Support & Resistance Zones:
SR Interchange Zone (previous resistance turned into potential support).
Minor Resistance Zone above, now likely invalidated by breakout.
These zones are critical in evaluating potential price reaction and risk control.
Projected Target:
Based on the measured move from the pole height of the pennant added to the breakout point, the projected target stands near 1.14315, a level of prior structural interest.
🎯 Trade Plan – Technical Strategy
⚠️ This is a hypothetical scenario for educational purposes. Always manage your risk.
Entry Zone: On confirmation of a successful retest (bullish price action at trendline support)
Stop Loss: Below the pennant’s lower trendline or the SR interchange zone (1.1245 – 1.1260 region)
Target: 1.14315 (based on breakout projection)
Risk-Reward Ratio: Approx. 1:2 to 1:3 depending on entry precision
🔍 Psychological & Market Structure Notes:
A bullish pennant is a sign of accumulation after a strong rally – it tells us that buyers are resting, not gone.
The retest shows institutional behavior: smart money often allows price to come back to a breakout level before driving it higher again, to shake out weak hands and trap late sellers.
Momentum traders and breakout traders often wait for confirmation on the retest to pile in with higher confidence.
📚 Educational Takeaway:
This setup serves as a great case study in:
Continuation patterns (Bullish Pennants)
Breakout-retest behavior
Measured move target projections
Trend confirmation techniques
Market psychology and structure
If you're learning technical analysis, this is a high-probability pattern that occurs across many asset classes including forex, crypto, and stocks.

EUR/USD Bullish Setup: Key Pullback Zone & Trade Plan📊 EUR/USD Technical Analysis – Bullish Trend in Play 📊
In this latest breakdown, I dive into the EUR/USD pair, which is currently showing strong bullish momentum on the higher timeframes 🔥. Price action has been respecting a clean uptrend, forming a sequence of higher highs and higher lows — a textbook bullish market structure ✅.
In the video, I walk you through:
- The daily chart setup and what’s fueling the current move upward 🗓️
- My key interest zones for a possible pullback entry 🔁
- What I'm watching on the 4H and 30-minute timeframes for confirmation ⏱️
- Target areas, including recent swing highs and liquidity levels 🧲
Ideally, I’d like to see price pull back into equilibrium (around the 50% level of the recent range). If we get that retracement and a bullish break of structure, I’ll be looking to get long on this move 📈🟢.
⚠️ Disclaimer: This is not financial advice. Please do your own research and manage risk accordingly. 🛡️📉

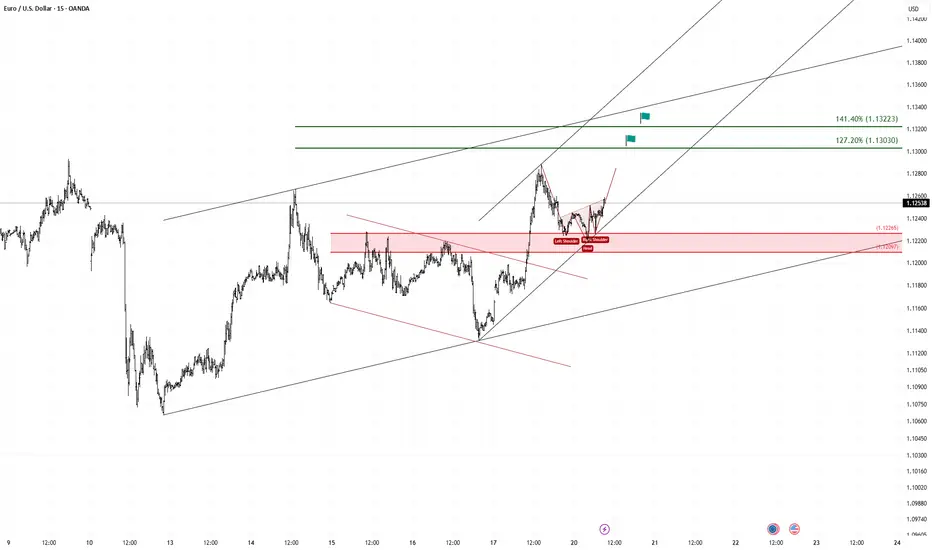
EUR/USD Bullish Breakout Ahead – Inverse Head and Shoulders + ChThe EUR/USD pair is showing a strong bullish setup supported by multiple confluences:
🔹 Inverse Head & Shoulders Pattern
A clean inverse head and shoulders formation has completed near the 1.1225–1.1207 support zone. This structure typically signals a reversal to the upside and has been confirmed with neckline breakout.
🔹 Breakout from Falling Channel
The breakout above the descending channel further supports bullish momentum, suggesting that the prior downtrend has likely ended.
🔹 Ascending Channel Structure
Price is currently respecting a rising channel, with higher highs and higher lows clearly forming. The lower boundary has been tested successfully, adding confidence to long positions.
🔹 Bullish Targets
I’m targeting the Fibonacci extension levels at:
127.2% at 1.13030
141.4% at 1.13223
These levels align with upper channel resistance and offer solid risk-reward potential.
🔻 Key Support / Invalidation
The key support zone is 1.1225–1.1207. A break below this area invalidates the bullish setup.
🎯 Trade Plan
Entry: After neckline breakout or on a minor pullback into the red support zone
TP1: 1.13030
TP2: 1.13223
SL: Below 1.1207 (conservative stop)
May it continue to rise!During the European session, EUR/USD broke above 1.1250, extending its second consecutive daily gain amid U.S. dollar weakness following Moody’s rating downgrade. UOB Group FX analysts Quek Ser Leang and Peter Chia noted that after days of range-bound trading, EUR rose to 1.1288 yesterday. However, the increase in momentum is insufficient to signal sustained progress. The euro must first decisively break above 1.1290 to have a chance of rising to 1.1330. Currently, the likelihood of a clear break above 1.1290 remains low, but as long as the pair holds above 1.1165, an upward move in the coming days is plausible.
In the market, there are no absolutes, and neither upward nor downward trends are set in stone. Therefore, the ability to judge the balance between market gains and losses is your key to success. Let money become our loyal servant.

EURUSD - SHORT IDEAEURUSD - SHORT IDEA
My analysis on this short
Entry @1.12132
SL @ 1.12728
TP @1.1206
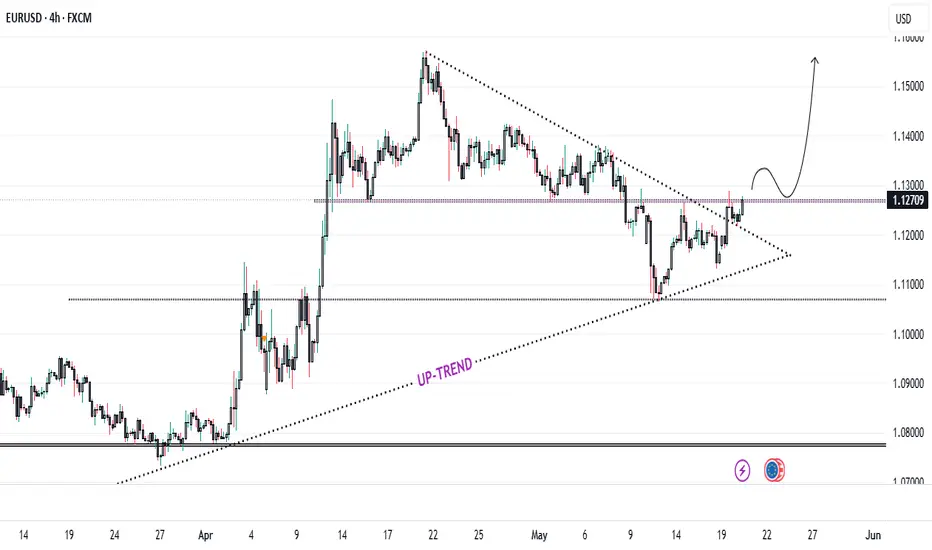
Symmetrical Triangle Breakout: EUR/USD Eyes Higher Levels..!📊 EUR/USD Technical Analysis – Breakout Watch..! 💥
🕰 Timeframe: 4H | 📅 Date: May 20, 2025
By: @Kartik\_Elkunchwar
The EUR/USD pair is showing an **interesting structure** with strong breakout potential. Here's the breakdown:
🔍 Chart Pattern Observed: Symmetrical Triangle
After a strong uptrend since late March, price consolidated into a symmetrical triangle, marked by lower highs and higher lows.
This formation typically indicates indecision in the market, but it often precedes a strong breakout.
📈 Uptrend Intact
The dotted line labeled UP-TREND shows that the bullish momentum is still present, with price respecting the rising support line over time.
This trendline has acted as a reliable dynamic support, reinforcing the bullish bias.
🔔 Recent Price Action
Price recently broke out above the upper trendline of the triangle, closing around **1.1275**.
This breakout is accompanied by a surge in momentum and could signal the resumption of the bullish trend.
📌 Key Levels to Watch
Resistance Zone: 1.1300 – If price breaks and sustains above this level, we could see a rally toward **1.1400–1.1450**.
Support Zone: 1.1200 and 1.1100 – In case of a false breakout or retest, these levels may act as buying opportunities.
🧠 Conclusion
The EUR/USD pair is giving a **potential long setup** after consolidating for weeks. A confirmed breakout above the triangle indicates **buyers may be gaining control**. Watch for a **retest and bounce** for higher conviction entries.
📉 What’s your take on EUR/USD? Bullish or Bearish..?
Drop your analysis in the comments! 💬
Fundamental Market Analysis for May 20, 2025 EURUSDEURUSD:
EUR/USD tested high levels on Monday, briefly rising to 1.1300, but then retreated slightly, although the day ended higher overall. Nevertheless, the pair remains in a short-term consolidation zone.
Last Friday, rating agency Moody's downgraded the United States (US), stripping it of its latest AAA rating on Treasuries, citing the growing US debt and long-standing government budget deficits that various presidential administrations have either neglected or failed to manage effectively. While initial investor reaction was shaky, sentiment quickly stabilised and the impact on US creditworthiness was largely written off. Still, Treasury markets are struggling: On Monday, 30-year bond yields topped 5 per cent and 10-year yields topped 4.5 per cent.
Federal Reserve (Fed) officials have been working hard this week to manage market expectations for a possible rate cut. Fed policymakers have continually reminded investors that ongoing U.S. tariff and trade policies complicate the outlook for the national economy, which in turn affects rate adjustments.
Thursday will see the release of German and pan-European purchasing managers' index (PMI) reports from HCOB, providing a double dose of business expectations surveys on both sides of the Pacific. Both the German and pan-European PMIs are expected to rise moderately. The key economic data release from the US will be the S&P Global PMI data for May, where average market expectations suggest a slight decline in both the manufacturing and service components of the PMI report due to the impact of tariffs on business spending.
Trading recommendation: BUY 1.1250, SL 1.1230, TP 1.1350

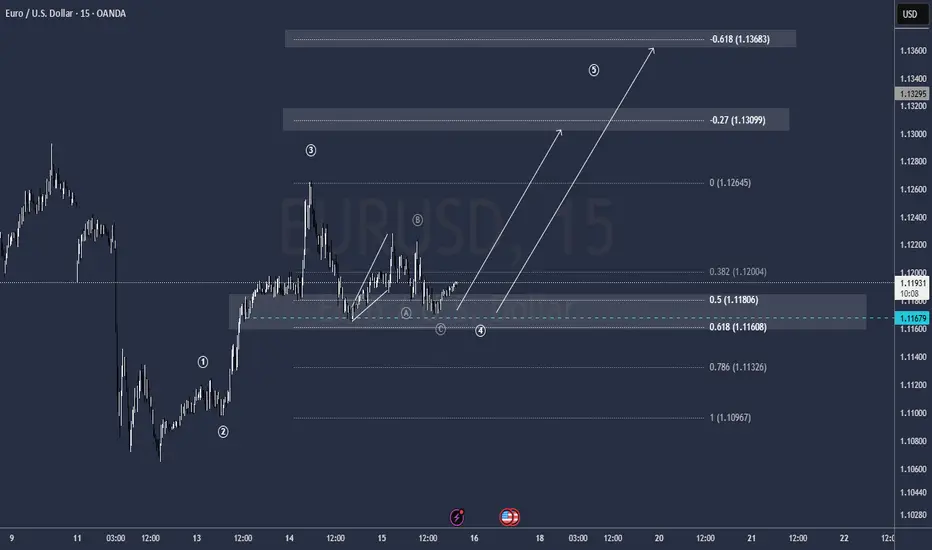
EUR/USD Wave 5 Setup – The Calm Before the SurgeWe're tracking a potential Wave (5) extension on EUR/USD after a clean completion of Wave (4), which bounced right from the golden zone between the 0.382–0.5 fib levels.
🔍 Structure & Context:
Wave (4) bottomed at 1.1065, aligning with key fib confluence and RSI oversold bounce.
Price is now showing early signs of bullish momentum, currently trading just under 1.1200, above the 0.382 retracement.
If this count holds, we could be entering the early phase of a bullish impulse leg toward 1.1572 and possibly 1.1755 for Wave (5).
🧩 Technical Confluences:
✅ Fib retracement support (0.382–0.5) held strong
✅ Price reclaiming 20/50 EMAs; 200 EMA still overhead but flattening
✅ RSI recovering above 47, showing room for upside
✅ Minor resistance at 1.1272 → watch for breakout confirmation
🎯 Key Levels:
Entry Zone: 1.1150–1.1190
Wave 5 Target:
⚡ TP1: 1.1388 (0.618 ext)
⚡ TP2: 1.1572 (wave projection)
⚡ TP3: 1.1755 (extended target)
Invalidation: Break and close below 1.1045
📌 Plan: Looking for bullish continuation confirmation above 1.1225 with strong momentum. Tight risk with upside reward aligning beautifully with the wave structure 📈
💬 Let me know your thoughts on this count—bullish or premature?
📊 Drop a like if you're trading EUR/USD & follow for more wave-based setups!
@WrightWayInvestments
@WrightWayInvestments
@WrightWayInvestments

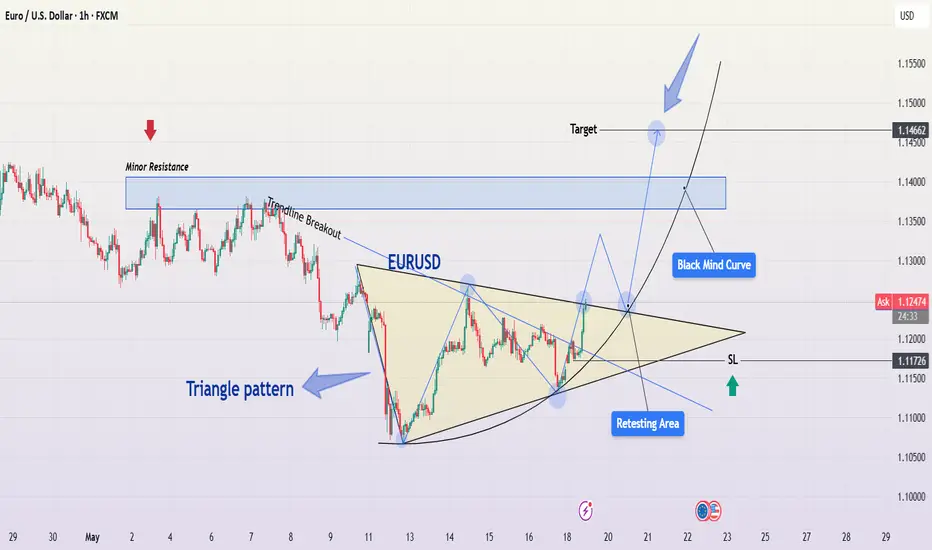
EUR/USD – Symmetrical Triangle Breakout & Bullish Continuation🔍 Overview
The EUR/USD pair has presented a classic and high-probability trading setup based on a symmetrical triangle formation, which recently experienced a bullish breakout. This pattern has formed after a period of compression and consolidation, creating a coiled spring scenario. Technical traders often watch for such breakouts as they signal the resumption of momentum with clear entry, stop-loss, and target zones.
This chart combines pattern recognition, key price action levels, psychological curve mapping, and structured trade planning. Let’s dive deeper into each component.
🧱 1. Chart Structure and Pattern Analysis
🔷 Symmetrical Triangle Formation
A symmetrical triangle is a continuation pattern formed when price action contracts between two converging trendlines.
This represents market indecision — both buyers and sellers are cautious, gradually narrowing the price range.
In this setup, the triangle has been forming since May 11, 2025, with a visible tightening of price action.
The chart shows well-respected upper and lower trendlines, confirmed with multiple touches on both sides.
🔼 Breakout Confirmation
A breakout occurred from the triangle's upper boundary around May 19, with a strong bullish candle closing above the structure.
Breakouts from symmetrical triangles often lead to sharp movements due to built-up pressure during the consolidation phase.
The volume typically expands at breakout zones (although volume is not displayed, price behavior implies it).
🔁 Retesting Area
Price may revisit the broken trendline (previous resistance → now support) for a retest before continuing higher.
This "retesting area" provides an ideal entry for those who missed the initial breakout.
Retests validate the breakout and confirm buyer strength.
🧱 2. Key Levels and Market Dynamics
🔻 Minor Resistance Zone (~1.13700–1.14100)
This zone has previously acted as a supply area where sellers pushed price down multiple times.
Price may hesitate or range within this area before breaking higher.
If bulls maintain control, breaking through this resistance zone will add confirmation to the bullish momentum.
📈 Target Projection: 1.14662
The target is derived by measuring the height of the triangle and projecting it from the breakout point.
It also aligns with a previous horizontal resistance level and psychological round number area.
This zone could act as a medium-term profit-taking level for swing traders.
🧠 3. Black Mind Curve – Market Psychology in Play
The "Black Mind Curve" is a representation of anticipated market sentiment and price flow.
It reflects a wave-like journey post-breakout — early breakout, pullback, bullish continuation, minor consolidation, and final push toward the target.
Such curves are used to forecast crowd behavior patterns, capturing how traders typically react post-breakout:
📌 Initial breakout ➜ Profit taking ➜ Retest ➜ Re-entry ➜ Final impulsive move.
🧮 4. Trading Strategy & Execution Plan
✅ Trade Setup
Entry:
Breakout Entry (already active)
OR Retest Entry near the triangle’s upper boundary for conservative traders.
Stop-Loss (SL) :
Placed just below the triangle’s lower boundary at 1.11726.
This level invalidates the breakout and prevents deeper drawdowns.
Take-Profit (TP):
Final target at 1.14662, offering excellent risk-to-reward potential.
📊 Risk-to-Reward Ratio:
Depending on the entry (breakout or retest), the RR can range from 1:2.5 to 1:3.5, which is ideal for swing or short-term position traders.
📚 5. Educational Insight
This pattern illustrates the importance of:
Price compression zones (triangles and wedges) as precursors to momentum trades.
Confirmation via breakout candles before entering high-conviction setups.
Patience during retests, which allow re-entries with defined risk and improved pricing.
Blending technical structure with psychological forecasting to stay aligned with market sentiment.
🔚 Conclusion
EUR/USD is showing a technically sound and psychologically supportive setup for bullish continuation. The symmetrical triangle has broken with strength, and price is heading toward key resistance with momentum.
If you're already long — consider holding until the target is hit or trailing stops to protect profits. If you're not in yet — watch for a retest to join the move with precision.
🔔 Always remember to manage risk effectively. No setup is guaranteed, but trading based on structure, confluence, and price behavior improves your edge
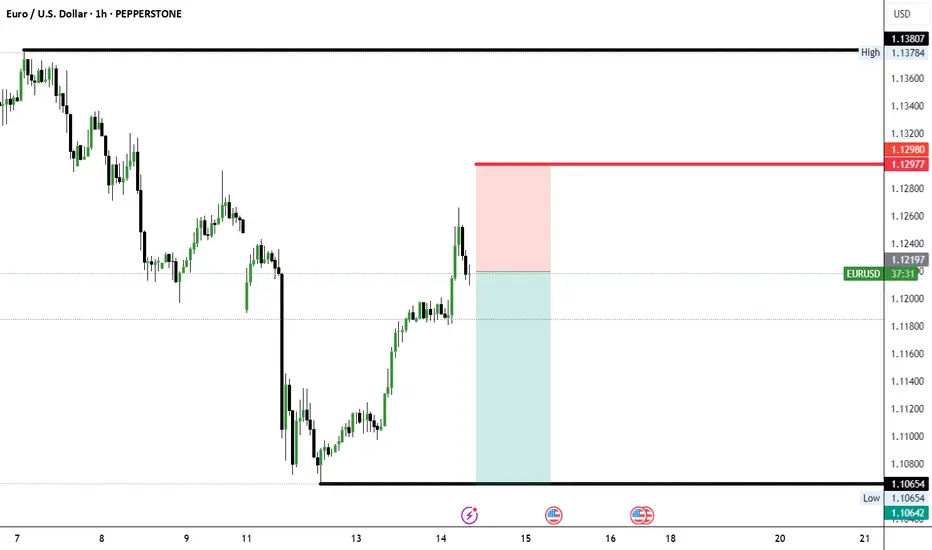
EUR/USD Set for Bullish Continuation: Key Levels to WatchEUR/USD shows strong bullish momentum across all timeframes, signaling a potential continuation rally. On the daily chart, the pair remains above key EMAs (55, 89, 200), with support near 1.1100 and resistance at 1.1228 and 1.1400. The RSI suggests consolidation, but overall structure favors the bulls.
The hourly chart confirms a fresh bullish breakout above the 200 EMA at 1.1215, supported by increased volume and a rising RSI. Price action suggests a retest of the 1.1190–1.1215 zone as a buying opportunity.
On the 15-minute chart, EUR/USD is overbought short-term, but momentum remains strong. A pullback into the 1.1190–1.1200 zone could offer low-risk scalping entries targeting 1.1225–1.1240.
The week-ahead plan favors dip-buying strategies. Initial targets are 1.1250 and 1.1300, with stops below 1.1180. A close above 1.1228 on the daily chart would confirm room for broader upside. Manage risk with staggered entries and hard stops.

EURUSD is in a Downside DirectionHello Traders
In This Chart EURUSD HOURLY Forex Forecast By FOREX PLANET
today EURUSD analysis 👆
🟢This Chart includes_ (EURUSD market update)
🟢What is The Next Opportunity on EURUSD Market
🟢how to Enter to the Valid Entry With Assurance Profit
This CHART is For Trader's that Want to Improve Their Technical Analysis Skills and Their Trading By Understanding How To Analyze The Market Using Multiple Timeframes and Understanding The Bigger Picture on the Charts

EURUSD is in a Downside Direction After a Triangle Pattern BreakHello Traders
In This Chart EURUSD HOURLY Forex Forecast By FOREX PLANET
today EURUSD analysis 👆
🟢This Chart includes_ (EURUSD market update)
🟢What is The Next Opportunity on EURUSD Market
🟢how to Enter to the Valid Entry With Assurance Profit
This CHART is For Trader's that Want to Improve Their Technical Analysis Skills and Their Trading By Understanding How To Analyze The Market Using Multiple Timeframes and Understanding The Bigger Picture on the Charts

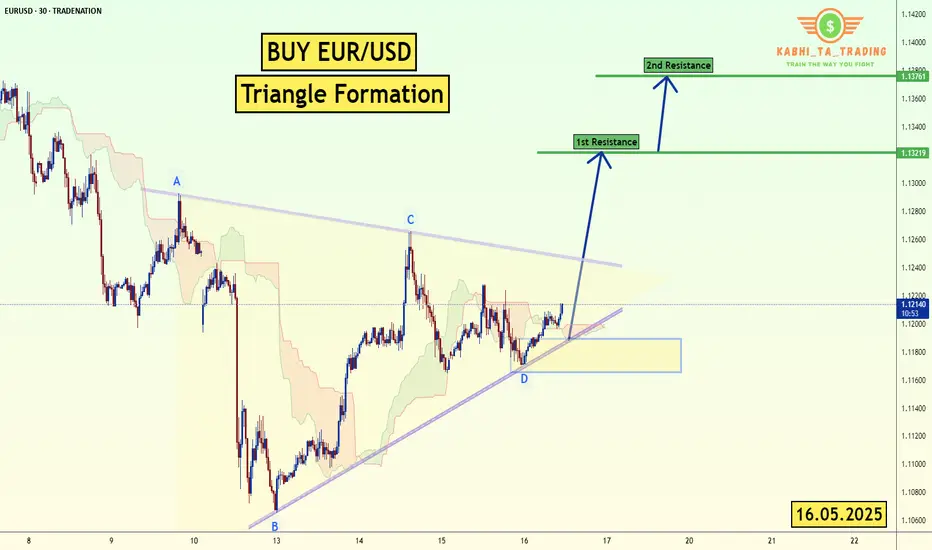
EUR/USD - Triangle Formation (16.05.2025)The EUR/USD pair on the M30 timeframe presents a Potential Buying Opportunity due to a recent Formation of a Triangle Pattern. This suggests a shift in momentum towards the upside and a higher likelihood of further advances in the coming hours.
Possible Long Trade:
Entry: Consider Entering A Long Position around Trendline Of The Pattern.
Target Levels:
1st Resistance – 1.1321
2nd Resistance – 1.1376
🎁 Please hit the like button and
🎁 Leave a comment to support for My Post !
Your likes and comments are incredibly motivating and will encourage me to share more analysis with you.
Best Regards, KABHI_TA_TRADING
Thank you.
EURUSD LONG NOWPersonally I never trair this pair but it seams too clear to miss it
Levels in the chart
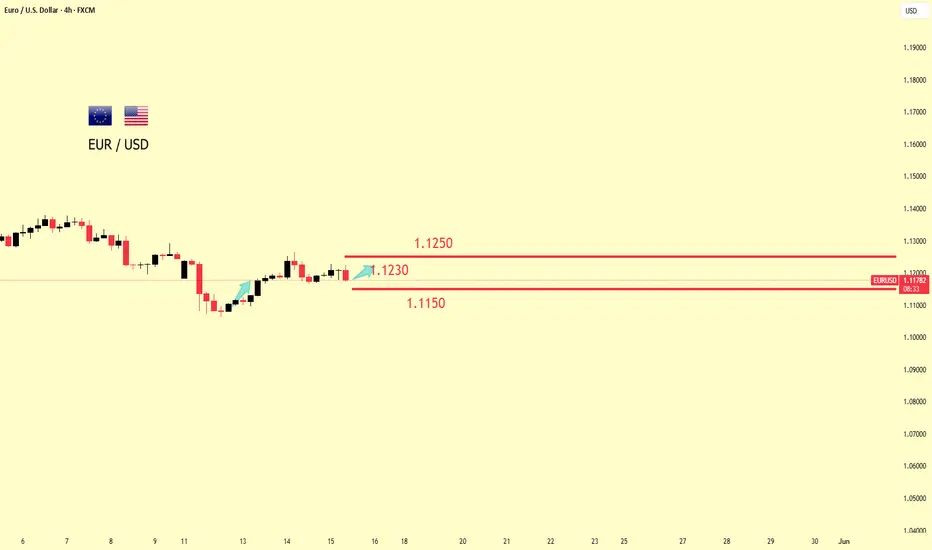
EURUSD: Growth Is Coming! Buy!Driven by the lower-than-expected U.S. Producer Price Index (PPI) data, the EUR/USD exchange rate oscillated higher and broke through the 1.1200 threshold. During the North American trading session, EUR/USD rose 0.25% and traded near 1.1200, indicating that short-term bullish momentum is gradually strengthening.
The EUR/USD has successfully broken through the psychological resistance level of 1.1200, forming a strong upward breakout pattern. The MACD indicator shows a golden cross formation, with the histogram turning from negative to positive, signaling a shift in momentum to bullish. In the short term, EUR/USD is expected to continue its upward momentum, with the primary target being the previous high of 1.1230. If this level is effectively breached, it could challenge the 1.1250–1.1275 area.
For support levels, 1.1180 serves as a key short-term support, followed by the 1.1150 zone.
you are currently struggling with losses, or are unsure which of the numerous trading strategies to follow, at this moment, you can choose to observe the operations within our channel.