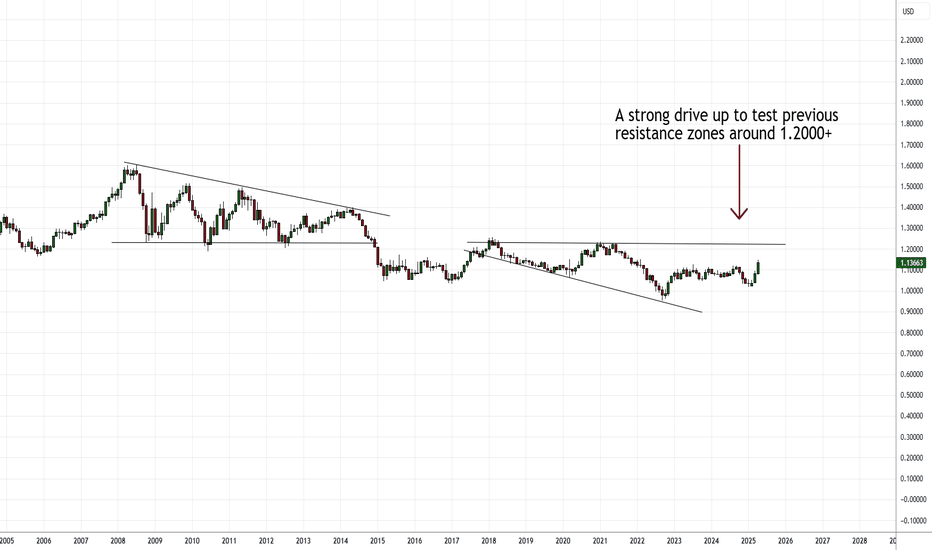
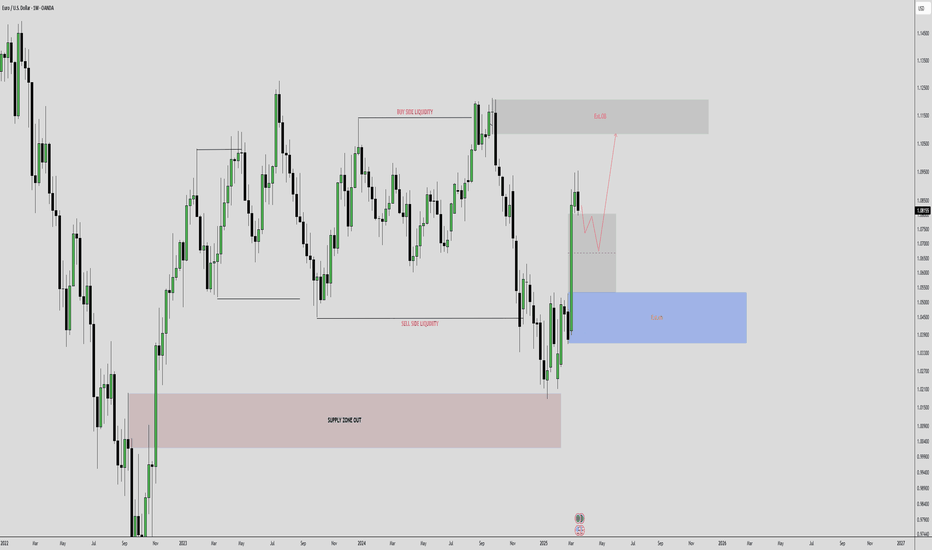
The Euro Bull sharpening it's horns against the USD?After further analysis on the weekly and monthly chart, I have identified what looks like a much larger broadening bottom pattern which signals the possibility of much further U.S. Dollar weakness.
Based on my previous video analysis, my original target for the EUR/USD was 1.2000 however 1.2500 – 1.3000 is not out of the question now. We haven’t traded in that price range since 2014.
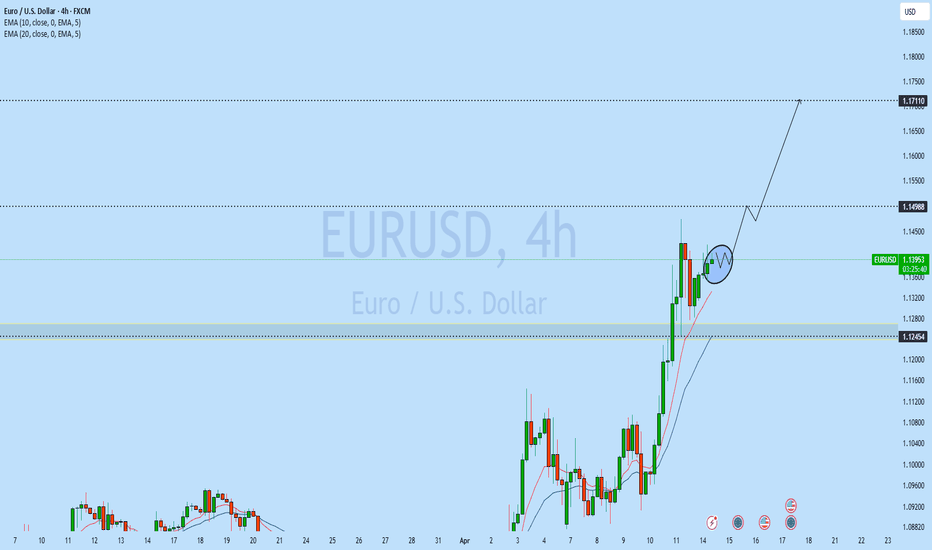
In the immediate term, we could see a bullish acceleration if we begin trading cleanly above 1.1500.
I will expand on this analysis in my next upcoming weekly video.
Good Luck & Trade Safe.
Eurusdlong
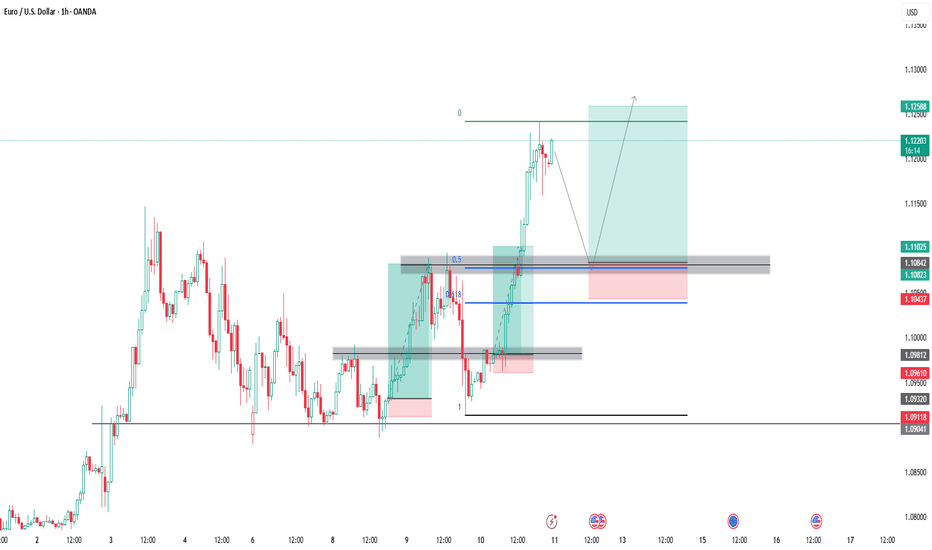
EURUSD TA: Fibonacci, Bull Flags, and Data-Driven Entry StrategyTechnical Analysis: EURUSD (Euro/US Dollar)
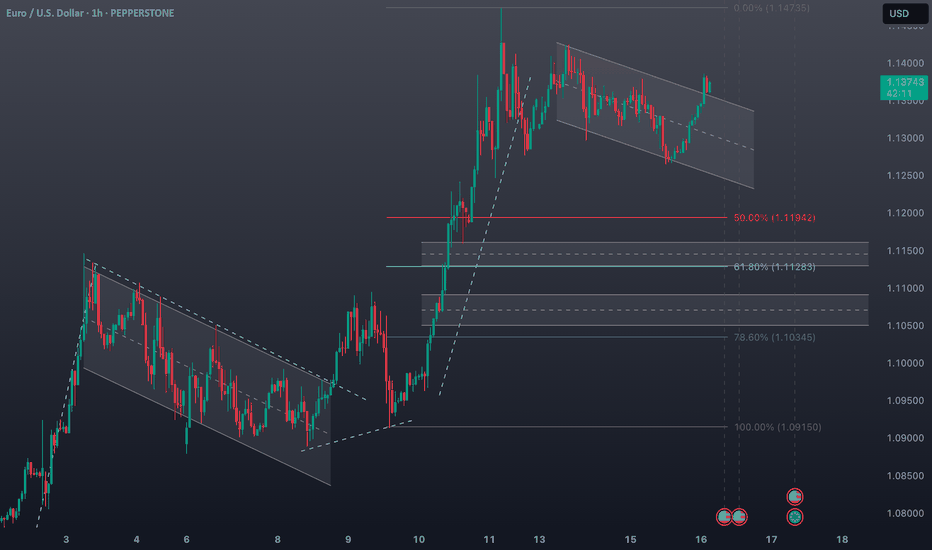
📈 The EURUSD pair is demonstrating strong bullish momentum on the 4-hour timeframe, with price action currently trading at 1.13638, well above the key 50% Fibonacci retracement level drawn from the previous range low to high.
🔍 The chart reveals a series of bull flags forming during the recent uptrend, suggesting continued buying pressure despite the pair trading at premium levels. This pattern typically indicates brief consolidation before further upside movement.
💹 From a Fibonacci perspective, the current price position above the 50% retracement level indicates strength in the Euro against the Dollar. However, this elevated position also creates potential for a healthy pullback to retest support before continuing higher.
⏱️ Today's upcoming US Retail Sales data release represents a significant market catalyst. Interestingly, this high-impact event could trigger a pullback regardless of the outcome:
If actual figures come in below forecast: Dollar weakness could prompt profit-taking after the recent rally
If actual figures exceed forecast: Dollar strength could naturally push EURUSD lower
🎯 Trade Idea: Monitor for a potential retracement toward the 50% Fibonacci level, followed by a bullish break of market structure on the 30-minute timeframe. This would provide a higher-probability entry point for long positions with a more favorable risk-to-reward ratio.
🔄 The presence of multiple bull flags suggests that any pullback may be temporary, potentially offering an excellent opportunity to enter with the prevailing trend at a better price point.
⚠️ DISCLAIMER: This analysis is provided solely for informational purposes and should not be construed as financial advice.
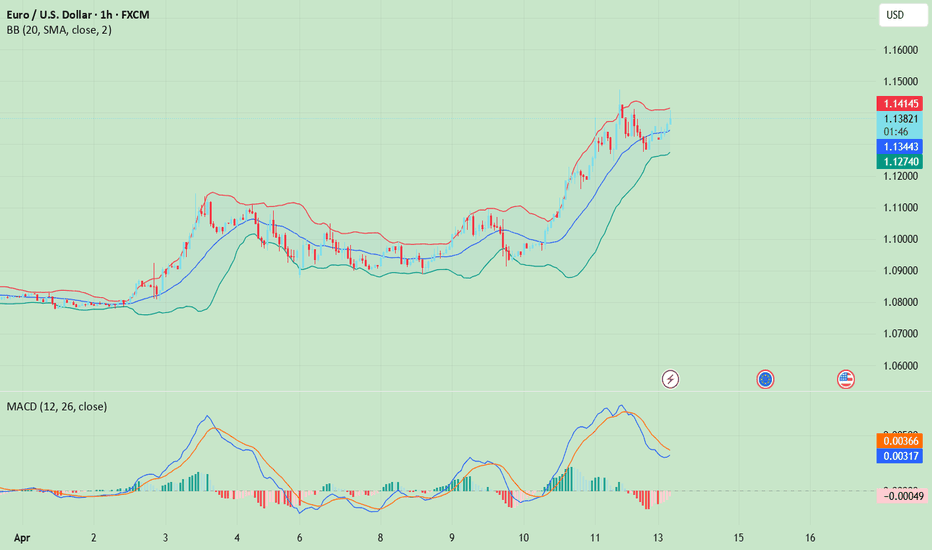
EURUSD(20250416) Today's AnalysisMarket news:
U.S. import prices fell 0.1% in March from the previous month, the first month-on-month decline since September last year.
Technical analysis:
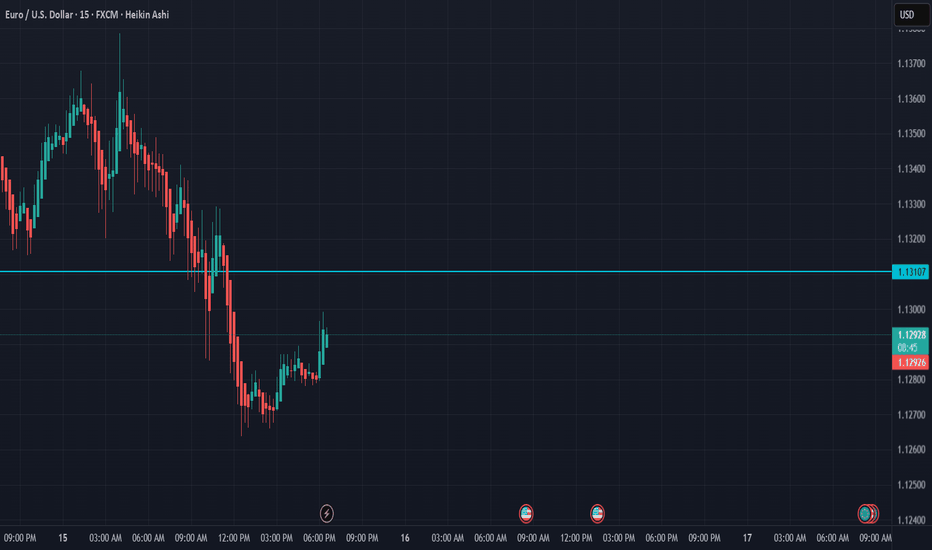
Today's buying and selling boundaries:
1.1307
Support and resistance levels:
1.1421
1.1378
1.1350
1.1263
1.1235
1.1193
Trading strategy:
If the price breaks through 1.1307, consider buying, the first target price is 1.1350
If the price breaks through 1.1263, consider selling, the first target price is 1.1235
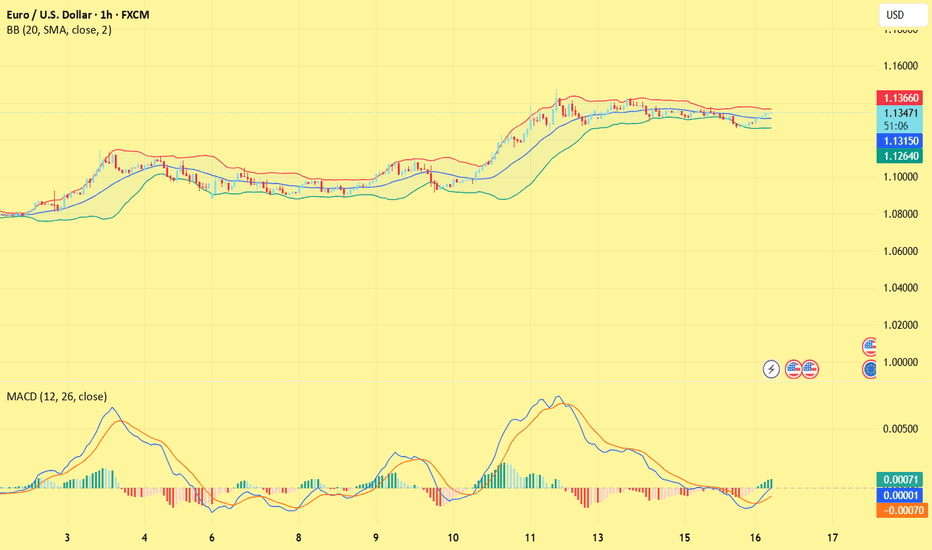
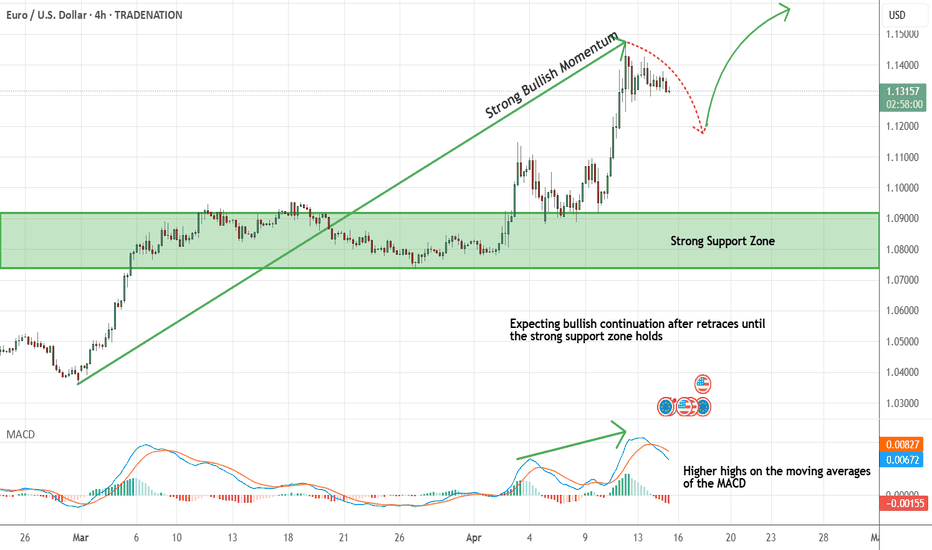
EURUSD Short Term Buy IdeaH4 - Strong bullish momentum
Higher highs on the moving averages of the MACD
No opposite signs
Expecting retraces and further continuation higher until the strong support zone holds.
If you enjoy this idea, don’t forget to LIKE 👍, FOLLOW ✅, SHARE 🙌, and COMMENT ✍! Drop your thoughts and charts below to keep the discussion going. Your support helps keep this content free and reach more people! 🚀
--------------------------------------------------------------------------------------------------------------------
Disclosure: I am part of Trade Nation's Influencer program and receive a monthly fee for using their TradingView charts in my analysis.
GBPUSD and EURUSD Analysis todayHello traders, this is a complete multiple timeframe analysis of this pair. We see could find significant trading opportunities as per analysis upon price action confirmation we may take this trade. Smash the like button if you find value in this analysis and drop a comment if you have any questions or let me know which pair to cover in my next analysis.
EURUSD(20250414) Today's AnalysisMarket news:
Fed Collins: It is currently expected that the Fed will need to keep interest rates unchanged for a longer period of time. If necessary, the Fed is "absolutely" ready to help stabilize the market; Kashkari: No serious chaos has been seen yet, and the Fed should intervene cautiously only in truly urgent situations; Musallem: The Fed should be wary of continued inflation driven by tariffs.
Technical analysis:
Today's buying and selling boundaries:
1.1339
Support and resistance levels:
1.1624
1.1517
1.1448
1.1229
1.1160
1.1054
Trading strategy:
If the price breaks through 1.1339, consider buying, the first target price is 1.1448
If the price breaks through 1.1229, consider selling, the first target price is 1.1160
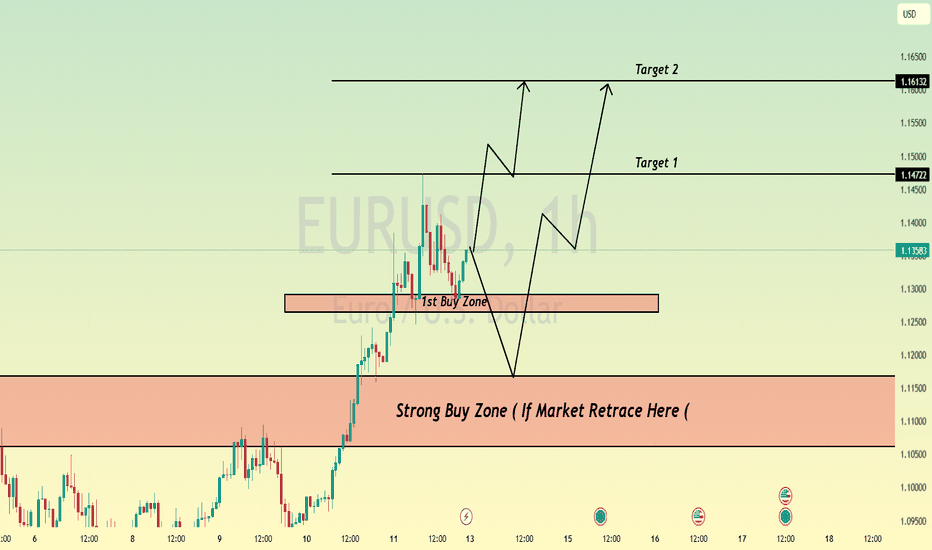
EURUSD is Ready for a Bullish MoveHello Traders
In This Chart EURUSD HOURLY Forex Forecast By FOREX PLANET
today EURUSD analysis 👆
🟢This Chart includes_ (EURUSD market update)
🟢What is The Next Opportunity on EURUSD Market
🟢how to Enter to the Valid Entry With Assurance Profit
This CHART is For Trader's that Want to Improve Their Technical Analysis Skills and Their Trading By Understanding How To Analyze The Market Using Multiple Timeframes and Understanding The Bigger Picture on the Charts
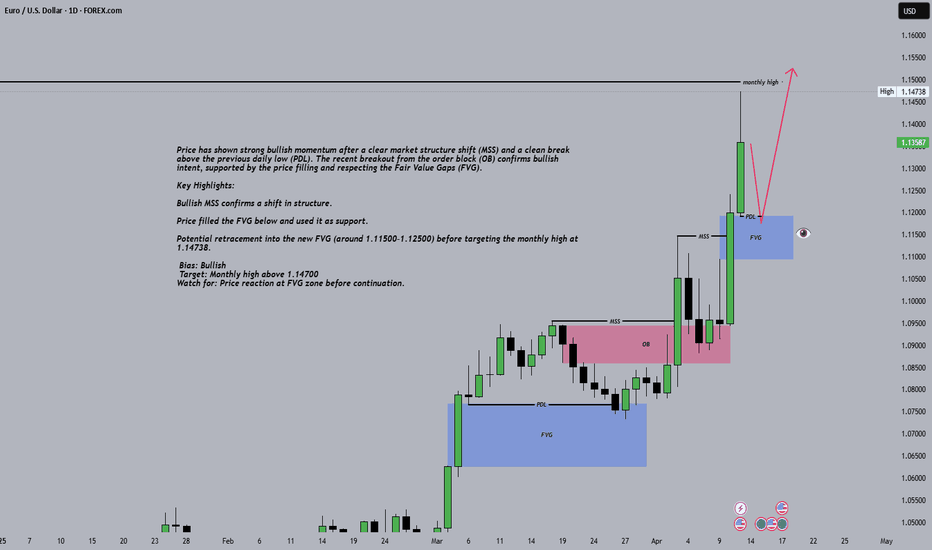
EURUSD Daily Analysis 📊 EURUSD Daily Chart – 12/04/2025
Price has shown strong bullish momentum after a clear market structure shift (MSS) and a clean break above the previous daily low (PDL). The recent breakout from the order block (OB) confirms bullish intent, supported by the price filling and respecting the Fair Value Gaps (FVG).
🔍 Key Highlights:
Bullish MSS confirms a shift in structure.
Price filled the FVG below and used it as support.
Potential retracement into the new FVG (around 1.11500–1.12500) before targeting the monthly high at 1.14738.
📈 Bias: Bullish
📌 Target: Monthly high above 1.14700
📉 Watch for: Price reaction at FVG zone before continuation.
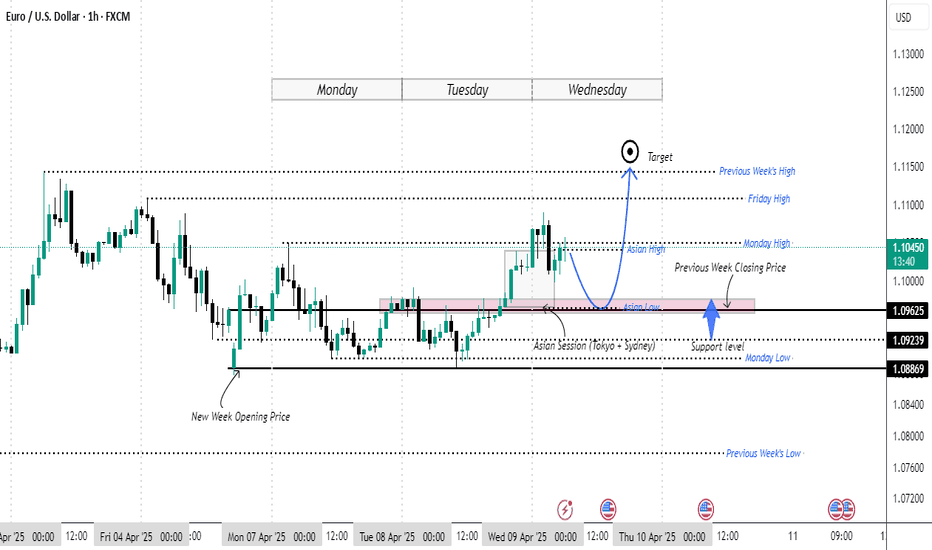
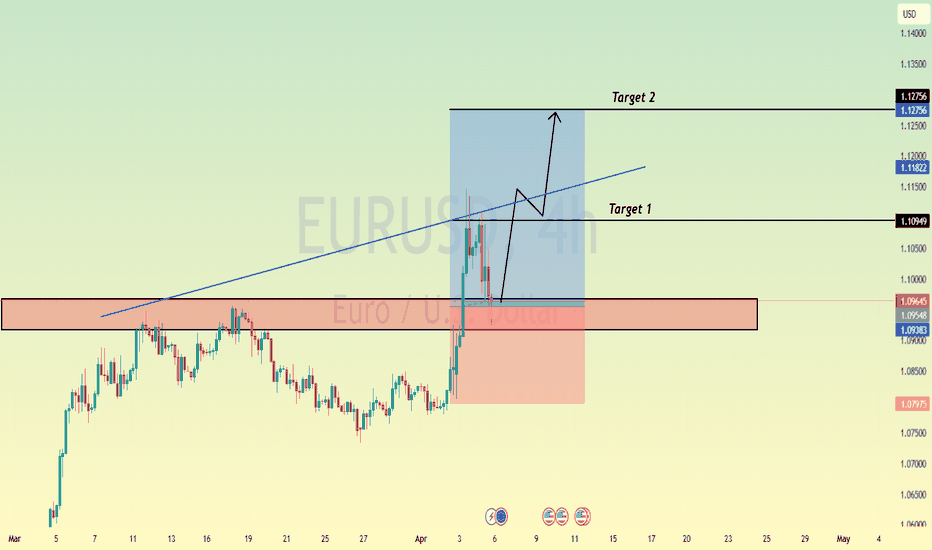
EURUSD: Watch for buys around 1.09625!Hey traders!
EURUSD has played out beautifully according to yesterday’s analysis, hitting our key levels with precision. The bullish momentum remains intact, and I'm still targeting the previous week's high at 1.11450.
Before the next leg up, I anticipate a pullback towards the Asian session low around 1.09625. This level could serve as a potential liquidity grab and demand zone, a perfect spot for buyers to step back in.
✅ Watch for bullish rejections or confirmation candles around 1.09625 to signal that buyers are defending the level. If confirmed, it could be the start of a solid move back to the upside.
📊 What’s your bias on EURUSD today? Bullish or bearish?
Let me know in the comments below! 👇
If you found this idea helpful, please consider supporting it with a boost, your support means a lot! 🙏🔥
Previous Idea
How it played out
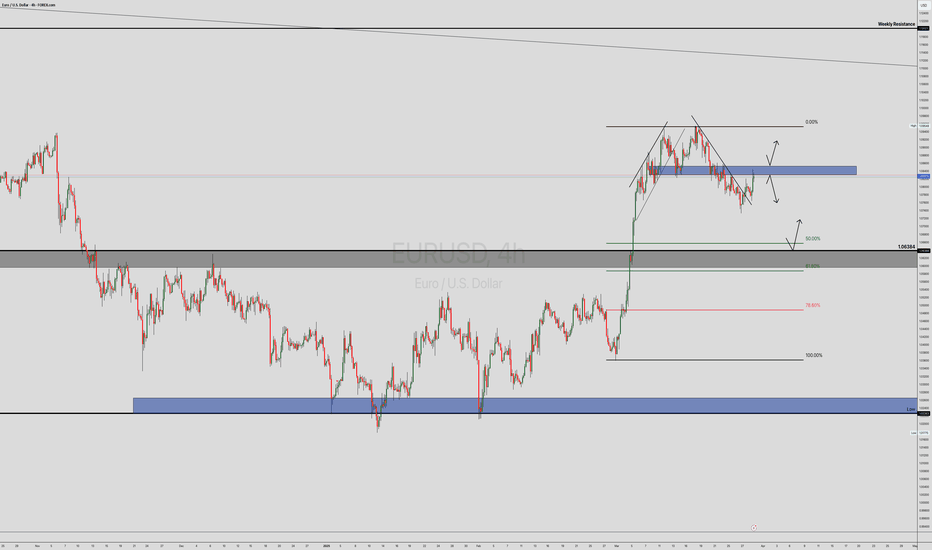
EURUSD POSSIBLE TRADE SETUPPotential Trade Setup on EURUSD
EURUSD is on a strong 3-week rally correction that was almost got rejected on Friday due to the UK and US GDP data that came pretty strong and weak respectively.
That said, I am still quite anticipating for a possible correction to continue towards the 50% fib level at 1.0650, before we can start looking for a possible buy entry in the long term.
Trading Plan:
1. BUY if the resistance gets broken and retest successfully.
2. SELL if the current region acts as resistance for rejection towards the downside with an engulfing called on the 4H chart.
Targets:
1. Can be 1:2 for either entries.
Tips:
1. The RSI (1d) indicates an Overbought but easing gradually towards the 50 level.
Please like, follow, and comment!!
You may find more details in the chart!
Thank you and Trade Responsibly!
❤️PS: Please support with a like or comment if you find this analysis useful for your trading day❤️
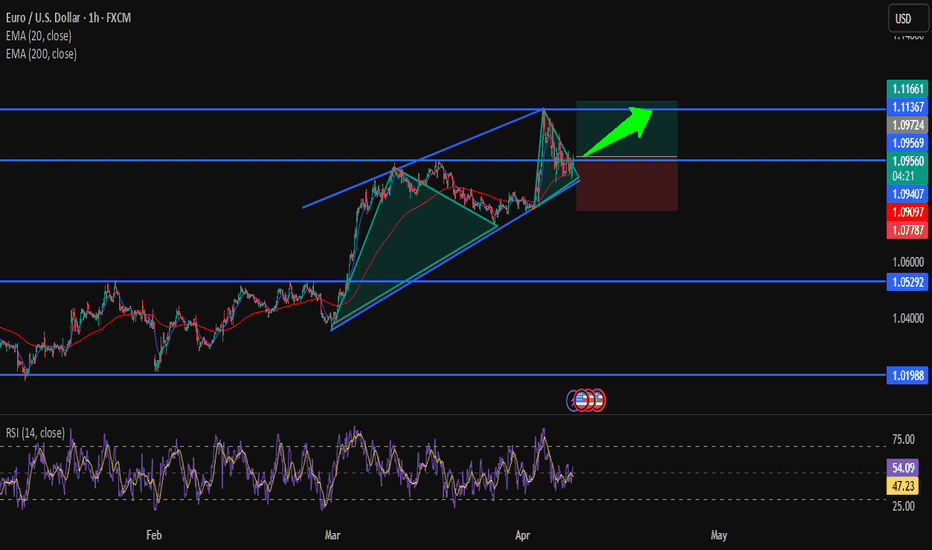
Don't Let It Slip Away: Dragon Signal Active on EUR/USDHi traders! Analyzing EUR/USD on the 1H timeframe, spotting a potential Dragon pattern with long opportunity:
🔹 Entry: 1.0956
🔹 TP: 1.11367
🔹 SL: 1.07787
Price action has formed a classic Dragon pattern — two symmetrical legs and a clear head, with the neckline (the hump) being retested as support. Currently, the pair is testing the neckline zone just above the 200 EMA. RSI is mid-range and curving up, showing early signs of bullish momentum.
If the neckline holds, we may see a strong bullish wave toward 1.1136. This pattern often leads to explosive upside moves once confirmed.
⚠️ DISCLAIMER: This is not financial advice. Every trader must evaluate their own risk and strategy.
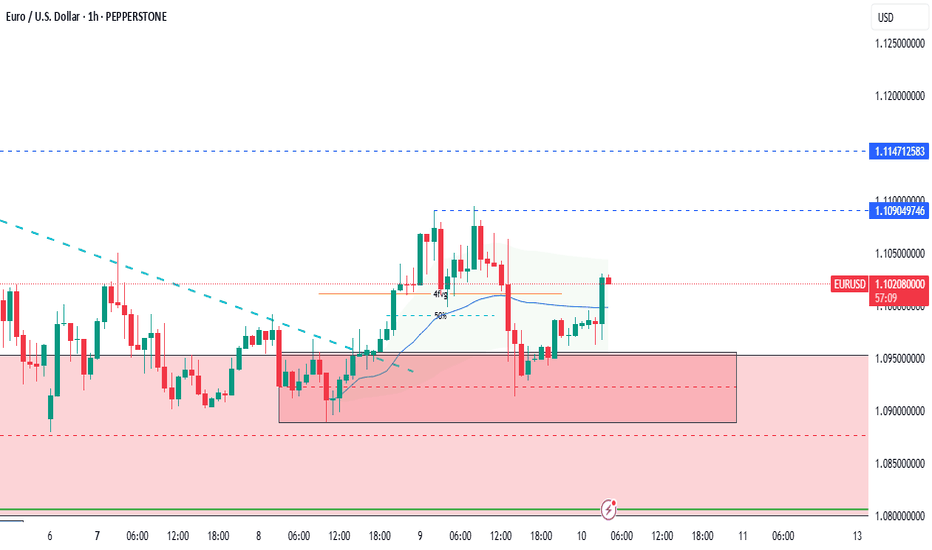
EURUSD LIVE TRADE EDUCATIONAL BREAK DOWNEUR/USD holds gains below 1.1000 ahead of US CPI release
EUR/USD is tirmimng gains while below 1.1000 in the European session on Thursday. The Euro gains on the German coalition deal and Trump's 90-day pause on reciprocal tariffs. Meanwhile, the US Dollar finds demand on profit-booknig ahead of the US CPI data release.
EURUSD(20250410) Today's AnalysisMarket news:
Only 13 hours after it came into effect, Trump announced the suspension of the reciprocal tariff policy for most economies for 90 days for negotiations. Trump also said that he had been considering the suspension in the past few days. He now suspends the reciprocal measures because he feels that everyone has overreacted, and seems a bit panicked and a bit scared. He will consider exempting some American companies; the White House said that a 10% global tariff will still be imposed during the negotiations, and previously announced industry tariffs such as automobiles, steel and aluminum are not included in the suspension.
Technical analysis:
Today's buying and selling boundaries:
1.0985
Support and resistance levels:
1.1165
1.1098
1.1054
1.0916
1.0873
1.0806
Trading strategy:
If the price breaks through 1.0985, consider buying, the first target price is 1.1054
If the price breaks through 1.0916, consider selling, the first target price is 1.0873
EURUSD is Ready for a Bullish MoveHello Traders
In This Chart EURUSD HOURLY Forex Forecast By FOREX PLANET
today EURUSD analysis 👆
🟢This Chart includes_ (EURUSD market update)
🟢What is The Next Opportunity on EURUSD Market
🟢how to Enter to the Valid Entry With Assurance Profit
This CHART is For Trader's that Want to Improve Their Technical Analysis Skills and Their Trading By Understanding How To Analyze The Market Using Multiple Timeframes and Understanding The Bigger Picture on the Charts
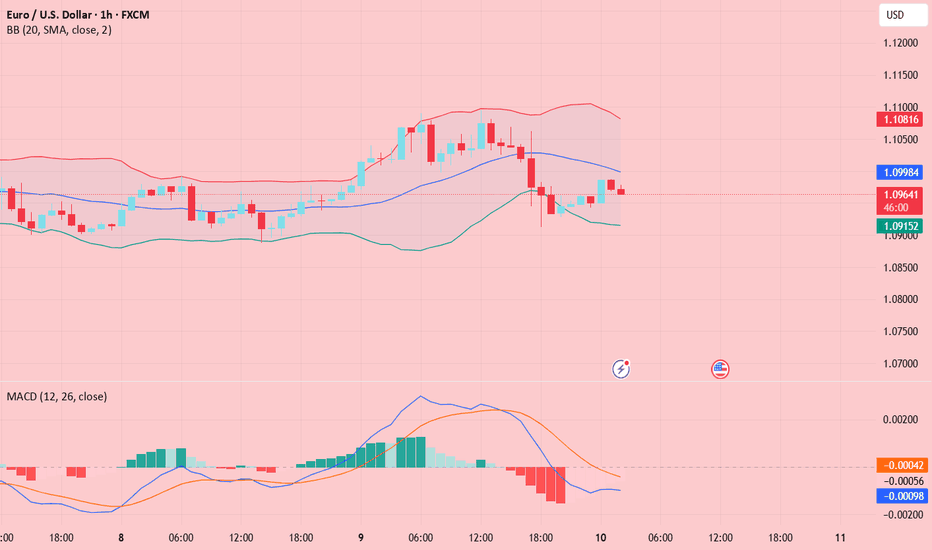
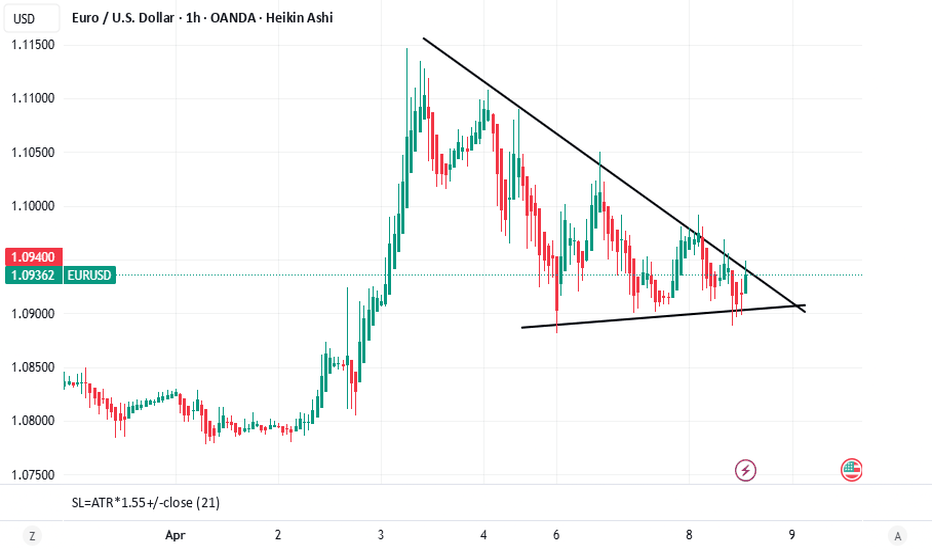
EURUSD TO BUY (Wednesday-FOMC Meeting Minutes and Thursday-CPI)As EURUSD as been dropping the past couple of days, it has been on the support levels of 1.0900 lately. On Wednesday and Thursday, there are news about FOMC Meeting Minutes and CPI of the US Dollar. Therefore, we could possibly see price of the EURUSD going up based on news, support pattern of the triangle.
TP: 1.1050-1.110
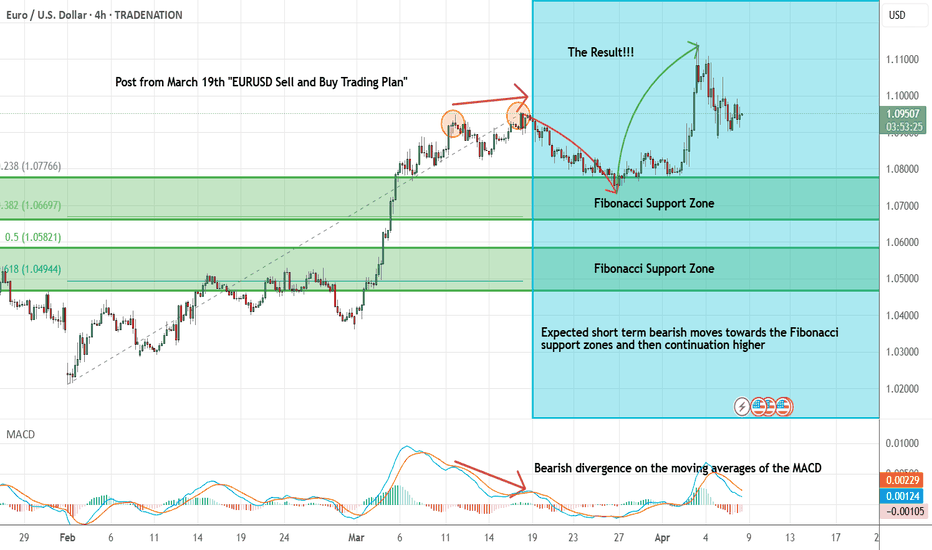
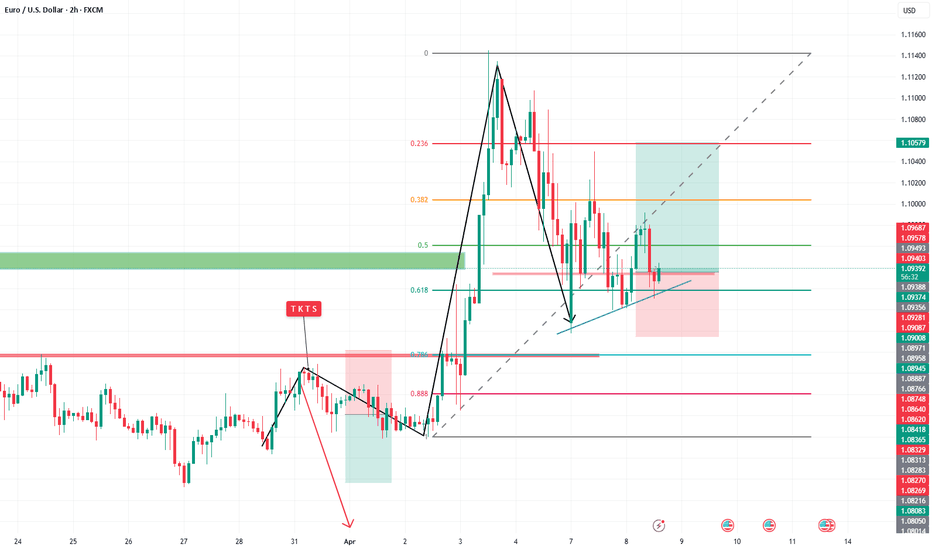
EURUSD Sell and Buy Trading Plan Update!!!Hi Traders, on March 19th I shared this "EURUSD Sell and Buy Trading Plan"
I expected short term bearish moves towards the Fibonacci support zones and then continuation higher. You can read the full post using the link above.
Price moved as per the plan here!!!
If you enjoy this idea, don’t forget to LIKE 👍, FOLLOW ✅, SHARE 🙌, and COMMENT ✍! Drop your thoughts and charts below to keep the discussion going. Your support helps keep this content free and reach more people! 🚀
-------------------------------------------------------------------------------------------------------------------
Disclosure: I am part of Trade Nation's Influencer program and receive a monthly fee for using their TradingView charts in my analysis.
EUR /USD) bullish flag Analysis Read The ChaptianSMC Trading point update
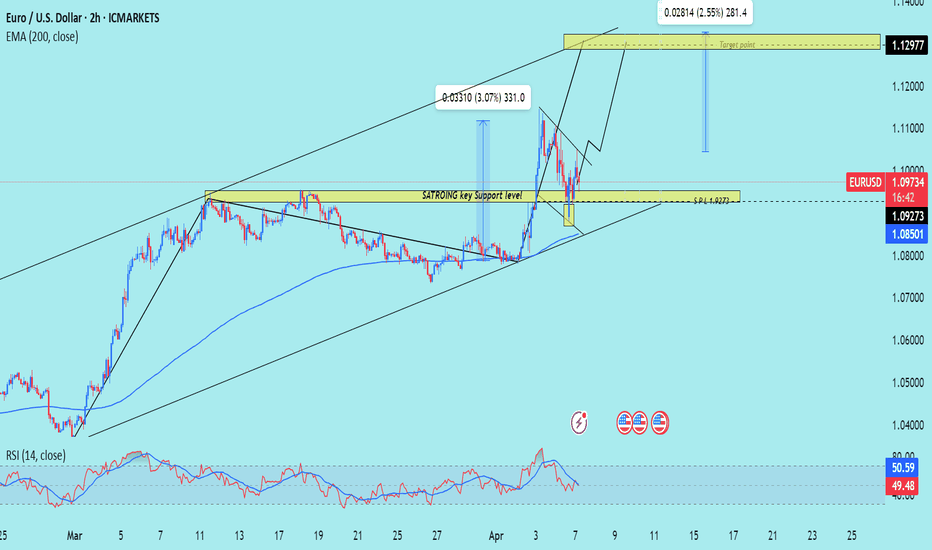
This is a bullish technical analysis on the EUR/USD pair (2-hour chart), projecting a long opportunity based on price action and market structure.
---
Key Elements of the Chart:
1. Strong Key Support Zone:
Marked around 1.09273, acting as a critical base.
Price previously reacted strongly from this level, confirming it as a high-probability support area.
2. Bullish Channel:
The pair is moving within an ascending parallel channel.
Price is currently rebounding off the lower channel trendline, suggesting upward continuation.
3. Breakout & Retest Pattern:
A small flag/pennant correction is shown after a strong bullish impulse.
Expected breakout from this flag will lead to continuation toward the upper resistance.
4. Target Zone:
1.12977 is marked as the final target point, around 2.55% (281.4 pips) away from the current price.
Previous high structure adds confluence to this target.
5. RSI (14):
RSI is hovering around 50.5, indicating neutral momentum but room for upside.
No clear divergence, but aligned with a possible bullish continuation.
6. 200 EMA (1.08501):
The price is above the 200 EMA, supporting the bullish bias.
Mr SMC Trading point
---
Conclusion/Idea:
This analysis suggests a long setup on EUR/USD, with:
Entry idea near the key support (1.09273),
Bullish flag breakout in progress,
Target near 1.12977,
Risk management advised below support or lower channel.
Bullish Bias: Price structure, EMA support, and trend channel favor a long setup.
---
Pales support boost 🚀 analysis follow)
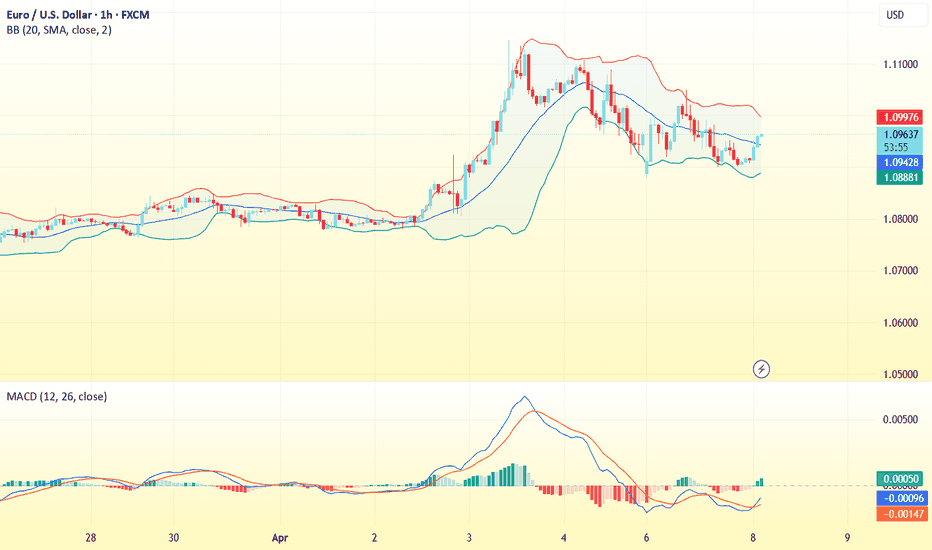
EURUSD(20250408) Today's AnalysisToday's buying and selling boundaries:
1.0944
Support and resistance levels
1.1113
1.1050
1.1009
1.0879
1.0838
1.0775
Trading strategy:
If the price breaks through 1.0944, consider buying, the first target price is 1.1009
If the price breaks through 1.0879, consider selling, the first target price is 1.0838
