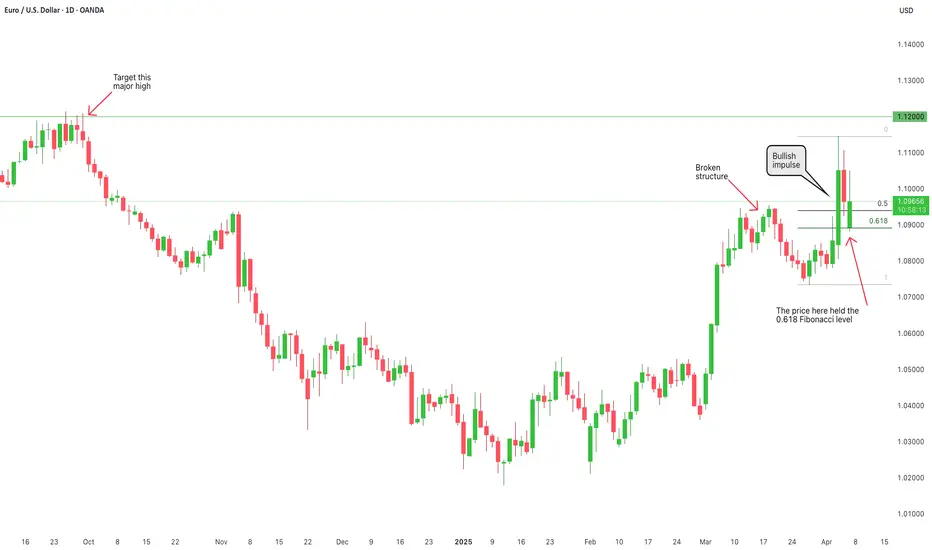
Can EURUSD Take Out the Major High 1.12000?EURUSD Major Forex Pair
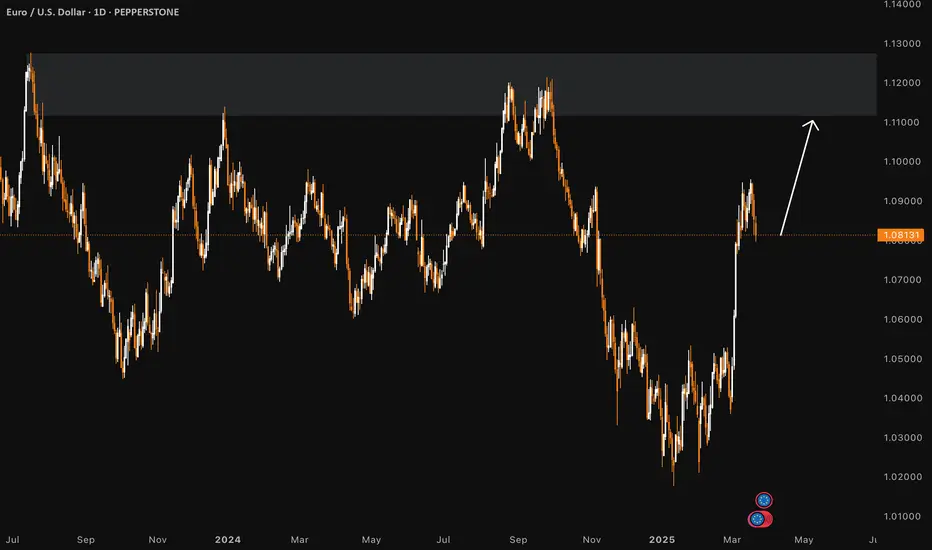
Following Trump’s tariff policies announced on Friday, the price of the EURUSD forex pair broke the daily higher high structure and is now returning to retest that level. This morning, the price bounced off the 0.618 daily Fibonacci level, suggesting that it may move upward again, potentially reaching the major high around 1.12000 or hitting one of the Fibonacci extension levels.
Price Action on the 4-Hour Chart
I have shifted down to the 4-hour chart to analyze the price action in more detail. While it appears somewhat chaotic due to Friday's news and the aggressive bullish impulse, it’s encouraging that the price broke through the higher high structure and is now retesting it.
At this point, I would like to see the price remain above the 0.618 daily Fibonacci level and stay within the upward trendline. Additionally, the price is forming a symmetric triangle. Once it breaks out of this pattern, I plan to enter a buy position with a risk-to-reward ratio of 1:2, targeting the supply area near the major high.
I will provide an update as more price action develops later in the week, so stay tuned!
Eurusdlong
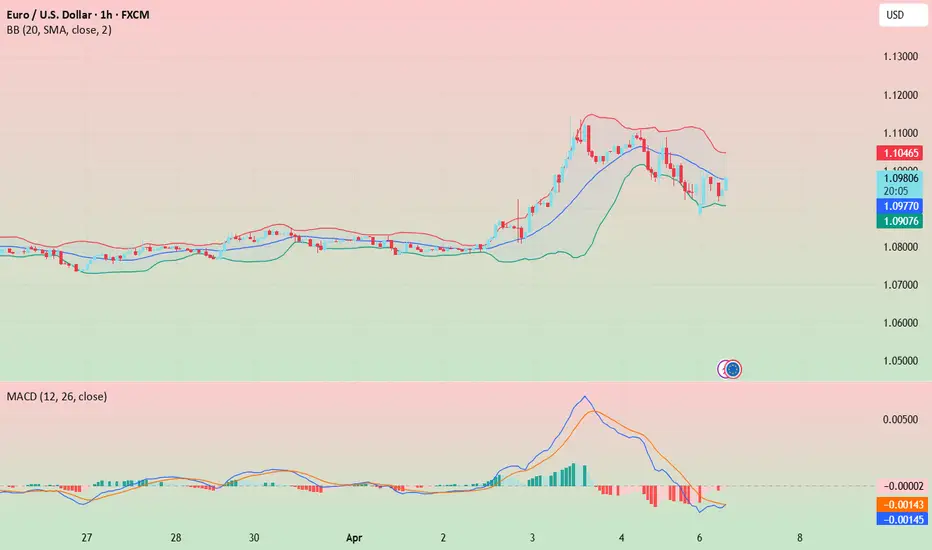
EURUSD(20250407) Today's AnalysisMarket news:
Fed Chairman Powell: Wait for clearer news before considering adjusting policy stance. One year later, as the impact of Trump's policies becomes clearer, uncertainty should be greatly reduced. Intends to complete the entire term. Potential tariffs may have a lasting impact on inflation. The impact of tariffs on the economy may be greater than expected. Downside risks have increased, but the economy is still in good shape.
Technical analysis:
Today's buying and selling boundaries:
1.0995
Support and resistance levels:
1.1177
1.1109
1.1065
1.0926
1.0882
1.0814
Trading strategy:
If the price breaks through 1.0995, consider buying, the first target price is 1.1065
If the price breaks through 1.0926, consider selling, the first target price is 1.0882
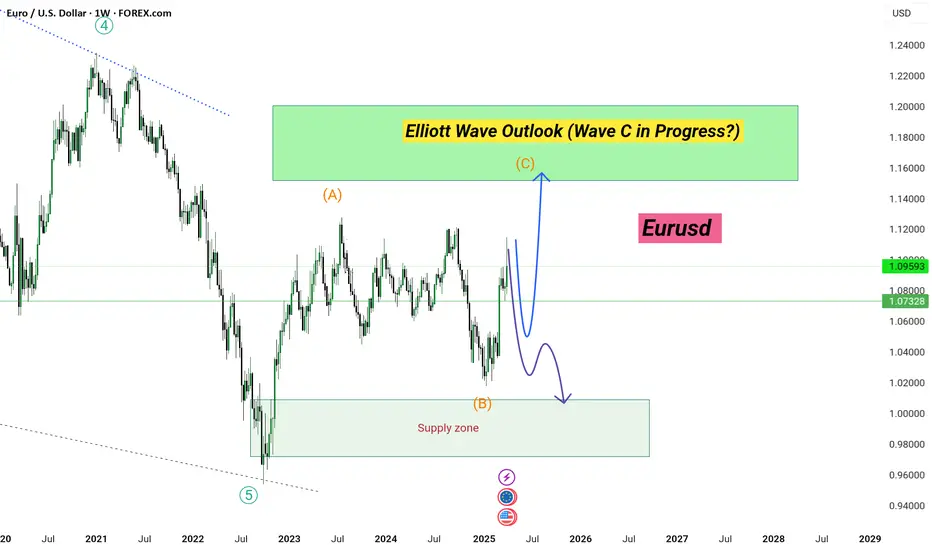
Elliott Wave Outlook (Wave C in Progress?)Key Technical Zones:
Demand Zone: 0.9750 – 1.0350 (Support from Wave B low)
Supply Zone: 1.1600 – 1.2000 (Potential Wave C target)
Current Price: 1.0959
Support Levels: 1.0730, 1.0350
Resistance Levels: 1.1250, 1.1600
Outlook:
Bullish bias remains intact for Wave C as long as the pair holds above 1.0730. Any deeper pullback into the demand zone could still be part of a healthy correction, offering long opportunities on confirmation. Keep an eye on macroeconomic data, especially from the U.S. (FOMC, CPI) and EU (ECB stance), as they may heavily influence EUR/USD sentiment in the coming weeks.
Conclusion:
Watch for bullish continuation setups toward the supply zone, but remain cautious of a mid-term rejection pattern, which could trigger a deeper correction. Trade safely, and always use proper risk management.
Current Scenario:
Price is now trading near 1.0950, suggesting a potential Wave C rally in progress.
If Wave C unfolds as anticipated, EUR/USD could approach the supply zone marked between 1.1600–1.2000, which aligns with previous structural resistance and Fibonacci retracement levels.
However, a false breakout or early rejection from current levels could lead to a sharp retracement, possibly retesting the demand zone before any major upside continuation.
Cup & Handle Pattern on EUR/USD – Bullish Breakout Setup🏗️ 1. Pattern Structure Breakdown
🔵 Cup Formation:
The left side of the chart illustrates a steep decline beginning around mid-October 2024, forming the left lip of the cup.
The bottom of the cup was established between late December 2024 and early February 2025, where the market found a strong support level near 1.0220.
A rounded bottom formed, which indicates accumulation and decreasing bearish momentum.
The right side of the cup shows a strong bullish reversal from the support zone, gradually returning to the previous highs around 1.1050–1.1100, completing the cup shape.
⚫ Handle Formation:
A slight pullback or consolidation occurred after reaching the resistance zone, forming the handle between late March and early April 2025.
This handle appears as a small descending channel or flag, which is typical for this pattern.
Price remained above the support trendline, showing strength in the handle without breaking the overall bullish structure.
🔍 2. Key Technical Zones
📌 Resistance Level (Breakout Zone): 1.1050 – 1.1100
Marked by prior price rejection and the top of the cup.
The successful breakout above this zone confirms the cup and handle breakout.
📌 Support Level: 1.0220 – 1.0300
This zone provided a base during the cup’s rounding bottom and serves as a critical demand area.
📌 Stop Loss: 1.07380
Positioned below the recent swing low (handle low), providing a safe buffer.
This placement respects both market structure and risk management.
🎯 3. Target Projection
✅ Price Target: 1.14780
Based on the measured move technique:
Measure the depth of the cup (approx. 1.1100 - 1.0220 = 880 pips).
Project that distance above the breakout point (around 1.1050).
Target = 1.1050 + 0.0880 = 1.1930 (but a conservative target of 1.14780 is used here).
This target aligns with a previous resistance level from mid-2023, adding confluence.
📈 4. Trade Setup Summary
Component Description
Pattern Cup and Handle (Bullish Continuation)
Entry Point Breakout above 1.1050 resistance
Stop Loss Below 1.0738 (recent low)
Target 1.1478 (based on measured move)
Risk/Reward Ratio Approx. 1:2.5 or better
💡 5. Technical Insights and Confluence
Volume Consideration (if available): Typically, volume decreases during the cup and increases during the breakout. Although volume is not shown here, this pattern suggests accumulation.
Handle Behavior: The handle did not breach the mid-point of the cup, maintaining a strong bullish structure.
Market Sentiment: Given the steady incline and the bullish breakout, it suggests buyers are in control.
🏁 Conclusion
This is a textbook Cup and Handle breakout setup on the EUR/USD daily chart. The structure shows a clear transition from bearish to bullish sentiment, accumulation at support, and a confirmed breakout with strong potential upside.
It offers an excellent long opportunity with favorable risk-reward, clear invalidation, and a historically reliable price pattern.

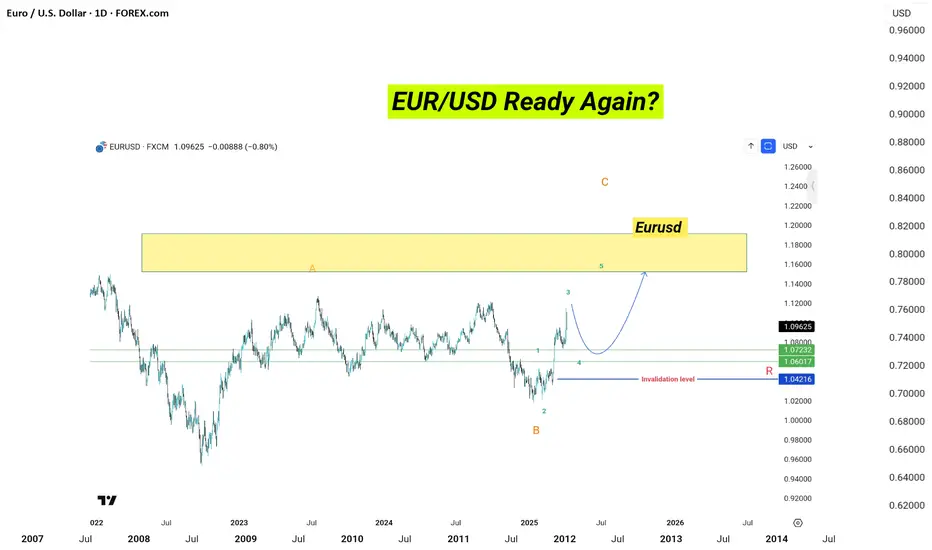
EUR/USD Ready Again?EUR/USD looks set for a bullish continuation as it moves into wave 5 of wave C. After completing wave 4, price is expected to rally toward the 1.18000–1.20000 zone.
Wave Structure Outlook:
Wave 3: Completed
Wave 4: Correction in progress
Wave 5 Target: 1.18000+ zone
Invalidation Level: 1.04216
As long as price holds above the invalidation level, the bullish count remains valid. Watch for price action confirmation to join the rally.
eurusd buy scalpingOANDA:EURUSD buy scalping
reason is 4hr support touch
4hr support to 1 day support
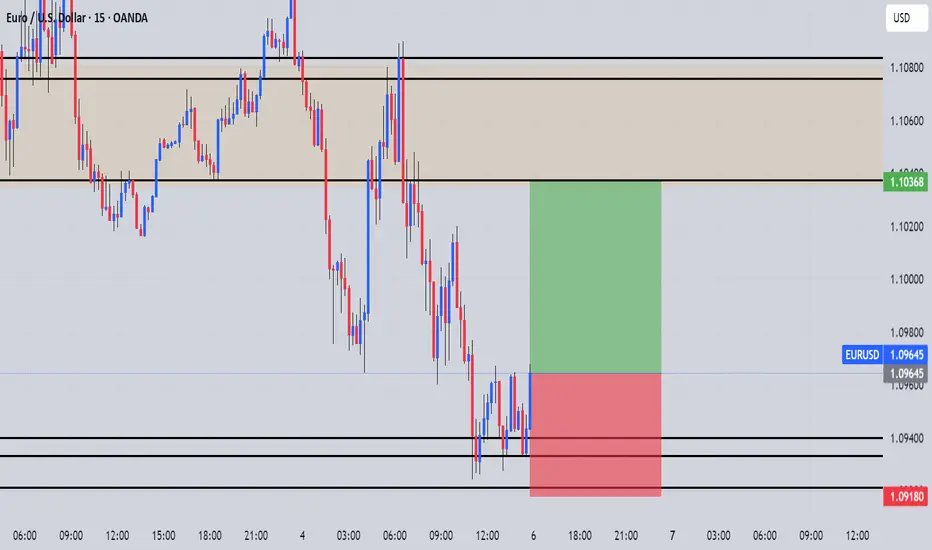
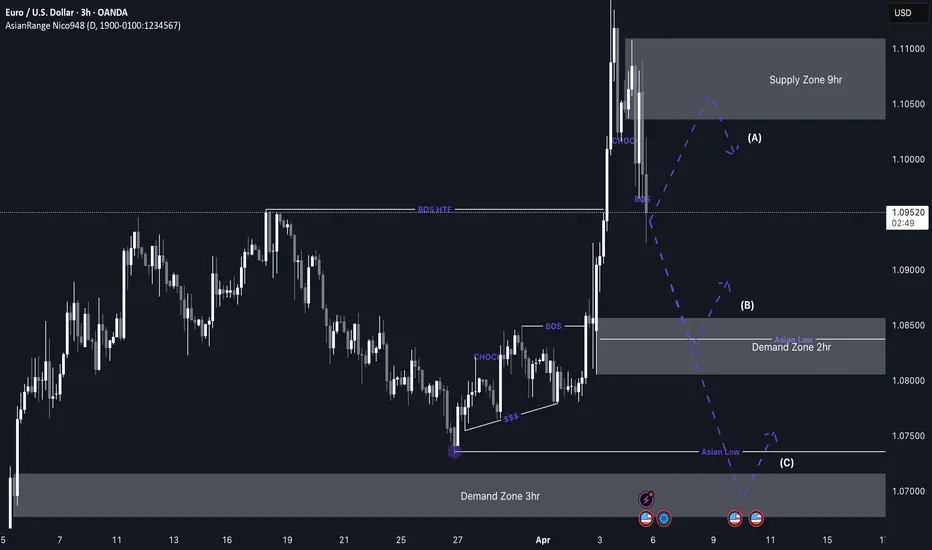
EUR/USD Long to Short idea (1.08500 up to 1.10500)EUR/USD (EU) Analysis – This Week
This week, EUR/USD looks promising, similar to GBP/USD, with multiple key points of interest (POIs) in close proximity.
A clean, unmitigated 2-hour demand zone sits nearby, which could trigger a bullish rally if price reacts from this level. At the same time, price has been bearish over the past few days, forming a valid 9-hour supply zone from the recent downward push. I’ll be watching to see where price slows down and which liquidity level it targets first.
Confluences for EU Buys:
EU has been bullish for weeks, and this move could be a healthy correction before further upside.
The U.S. dollar remains bearish, aligning with this bullish bias.
A clean 2-hour demand zone has formed, which previously caused a break of structure to the upside.
Imbalances and untapped Asia session highs still need to be taken.
Note: If price breaks below this structural low, I will shift my focus toward sell opportunities. However, if that happens, we’ll know exactly where the ideal entry points for shorts will be.
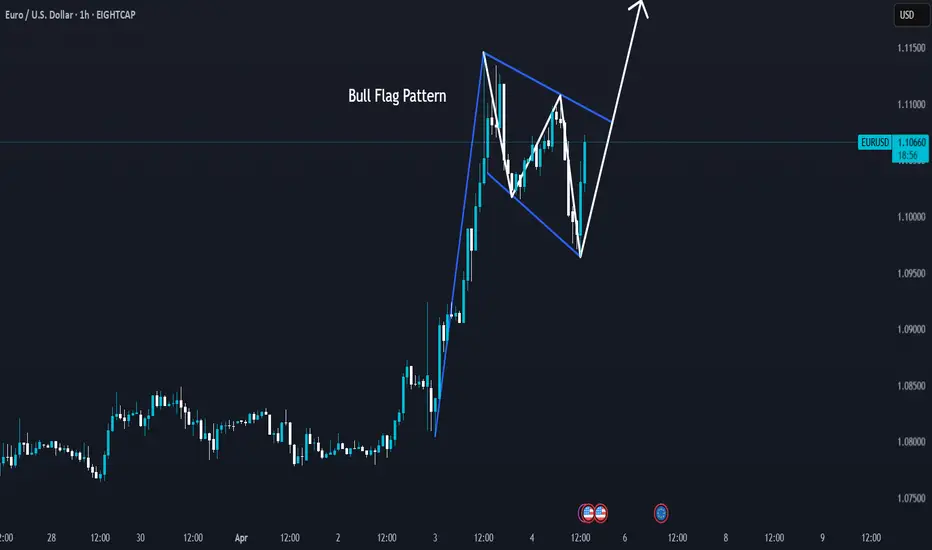
EUR/USD - Bull Flag Pattern Breakout in ProgressThis EUR/USD 1-hour chart showcases a classic Bull Flag Pattern , a strong continuation formation indicating the potential for further upside momentum.
- The pair experienced a sharp bullish impulse move, forming the flagpole.
- The price then entered a consolidation phase within a downward-sloping channel, forming the flag.
- A breakout above the upper trendline of the flag could confirm a continuation of the uptrend.
Traders should monitor key resistance levels and volume confirmation upon breakout. A successful retest of the flag's resistance as new support could provide a strong buying opportunity, with the next target potentially aligning with the flagpole’s measured move projection.
As always, apply risk management and consider additional confluences such as Fibonacci levels, moving averages, or fundamental factors.
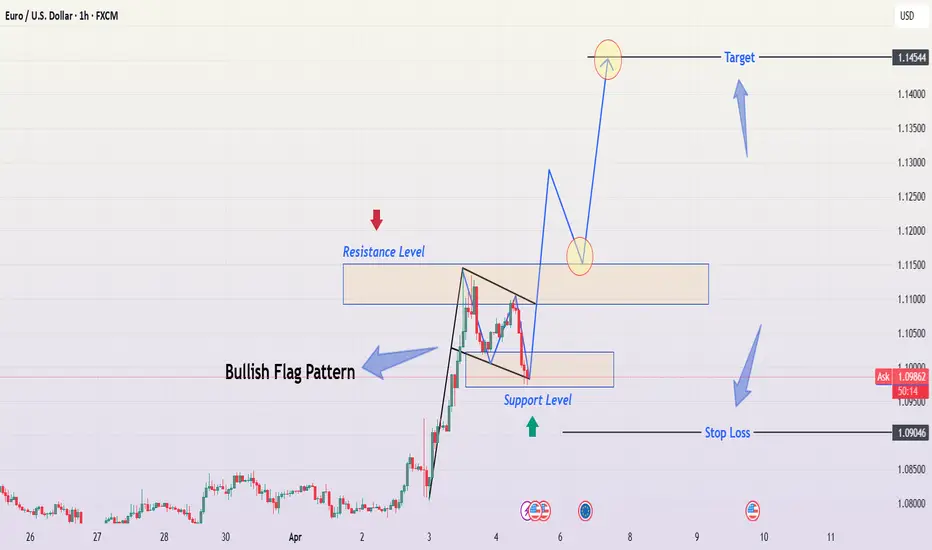
EUR/USD – Bullish Flag Pattern & Trade SetupTechnical Analysis & Trade Plan for TradingView Idea
This chart illustrates a Bullish Flag Pattern on the EUR/USD 1-hour timeframe, suggesting a potential continuation of the prevailing uptrend. Below is a detailed breakdown of the market structure, key levels, and a professional trading strategy.
📌 Chart Pattern: Bullish Flag Formation
The Bullish Flag is a continuation pattern that forms after a strong upward price movement, followed by a short period of consolidation within a downward-sloping channel. It signals a brief pause before the trend resumes.
Flagpole: The sharp price increase before the consolidation.
Flag: The corrective downward movement forming a small parallel channel.
Breakout Potential: A confirmed breakout above resistance could lead to a further bullish rally.
🔍 Key Technical Levels & Market Structure
🔵 Resistance Level (Supply Zone)
The upper boundary of the flag pattern acts as resistance.
A breakout above this level could trigger a strong buying opportunity.
🟢 Support Level (Demand Zone)
The lower boundary of the flag provides support.
Price is currently testing this zone, which is a critical decision point.
🎯 Target Price: 1.14544 (Projected Move)
The price target is calculated based on the height of the flagpole added to the breakout point.
This aligns with a previous significant resistance area.
📈 Trading Strategy & Execution Plan
✅ Entry Criteria:
A confirmed breakout above the flag's resistance level with a strong bullish candlestick.
Increased trading volume supporting the breakout.
🚨 Risk Management:
Stop Loss: Placed below the support zone of the flag to manage risk in case of a false breakout.
Take Profit Target: At 1.14544, aligning with the measured move of the flag pattern.
📊 Trade Confirmation Indicators:
RSI (Relative Strength Index): A reading above 50 confirms bullish momentum.
Moving Averages (50 EMA/200 EMA): A bullish crossover would strengthen the buying signal.
Volume Analysis: A breakout should be accompanied by high trading volume for confirmation.
⚠️ Potential Risks & Alternative Scenarios
Fake Breakout: If the price breaks out but lacks volume, it could be a false signal.
Bearish Reversal: If price breaks below the support zone, the bullish flag setup becomes invalid.
Market Sentiment Shift: Unexpected news events can impact price movement.
📝 Summary
The EUR/USD pair has formed a Bullish Flag Pattern, signaling a possible continuation of the uptrend.
A breakout above the resistance level would confirm the pattern and provide a strong buying opportunity.
Risk management is essential, with a stop loss placed below the support level.
Final Target: 1.14544, based on the flagpole’s measured move.
💡 Conclusion: A well-structured breakout above resistance could lead to a bullish rally toward 1.14544. However, patience and confirmation are key before entering the trade.
EURUSD Discretional Analysis: It's Going Up, BroIt's more of a gut feeling; I think it's headed up. If I'm right I'll make some money and if I'm wrong I'll lose some money.
Just my opinion, not financial advice.
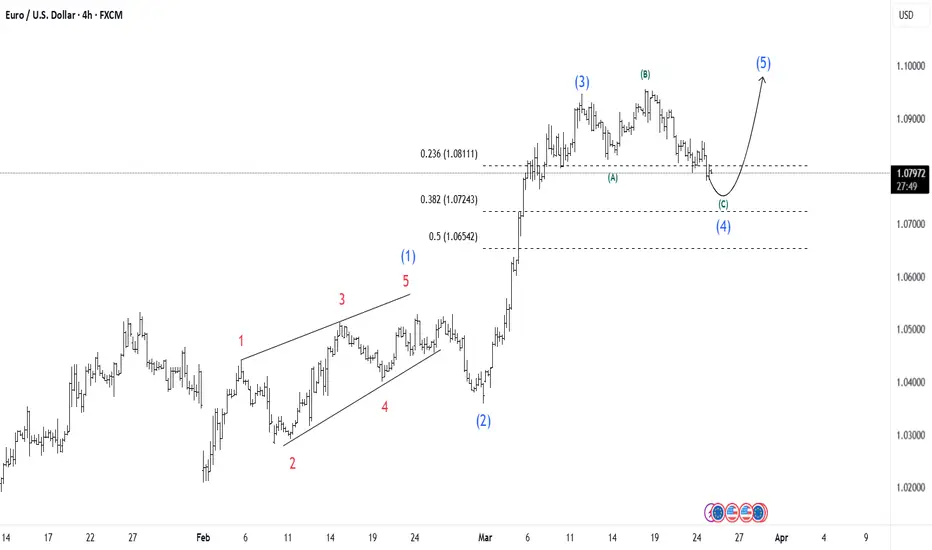
Elliott Wave Forecast: EUR/USD Prepares for Next Bullish Leg!This EUR/USD 4H chart presents an Elliott Wave analysis, showing the market’s movement within a five-wave structure. The price has completed Wave 3 and is currently in a corrective Wave 4, finding support around Fibonacci retracement levels of 38.2%
• Wave 3: A sharp rally forming an extended third wave.
• Wave 4: An ABC correction is currently in progress and is expected to be completed around levels of 1.07456
If the market respects the proper Fibonacci levels, the target for wave 5 could be 1.09504 .
EUR/USD Analysis Ascending Triangle Breakout – Bullish TargetOverview of the Chart:
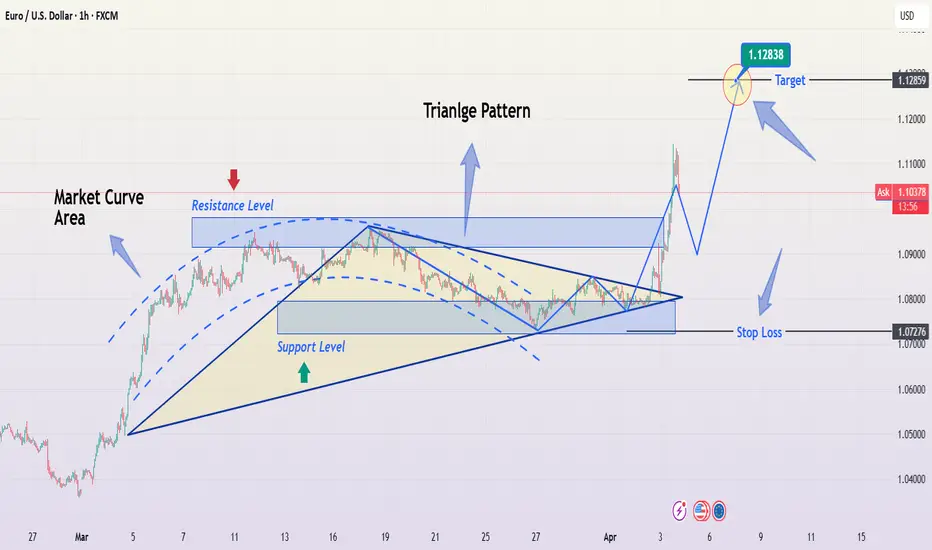
The chart represents the EUR/USD (Euro to U.S. Dollar) pair on a 1-hour timeframe, showcasing a bullish ascending triangle breakout. The pattern indicates an upward continuation in the trend after a period of consolidation. This analysis will break down the key elements of the chart, the technical structure, and the potential trading strategy.
1. Market Structure & Key Zones
A. Market Curve Area (Early Trend Development)
The price started with a strong bullish trend leading up to the formation of the triangle.
The curved trendline suggests a gradual increase in buying pressure, indicating that the market was preparing for a larger breakout.
B. Resistance and Support Levels
Resistance Level (Red Arrow & Blue Box):
This level acted as a price ceiling where sellers previously dominated.
The market attempted multiple times to break this resistance before successfully breaching it.
Support Level (Green Arrow & Yellow Zone):
The price consistently found buyers at this level, reinforcing a higher low structure.
The rising support line within the triangle indicated strong accumulation by buyers.
2. Chart Pattern: Ascending Triangle Formation
The price action formed an ascending triangle, which is a well-known bullish continuation pattern.
The higher lows (trendline support) indicated buyers were gaining control, gradually pushing the price toward the resistance.
Eventually, the resistance was broken with strong bullish momentum, confirming a valid breakout.
3. Breakout Confirmation & Retest
The breakout above the resistance level came with high volume, indicating strong market participation.
After the breakout, a minor pullback (retest) occurred, confirming previous resistance as new support.
The price surged upward after the retest, validating the bullish trade setup.
4. Trade Setup & Risk Management
A. Entry Strategy
A trader would enter a buy (long) position after confirming the breakout.
Entry Trigger:
Either at breakout (high-risk, early entry)
Or after a successful retest (safer entry)
B. Stop Loss Placement
A stop loss is placed below the previous support level at 1.07276, ensuring risk is limited in case of a false breakout.
C. Target Projection
The target price is measured using the height of the triangle added to the breakout level.
Based on this calculation, the projected target is around 1.12838.
5. Conclusion & Trading Plan
The EUR/USD pair has executed a clean ascending triangle breakout, signaling further bullish movement.
The trading plan suggests:
✅ Entry: Buy after breakout confirmation or retest.
✅ Stop Loss: Placed below 1.07276 for risk management.
✅ Take Profit: Targeting 1.12838, based on the pattern’s height projection.
This setup presents a high-probability long opportunity in a trending market, with proper risk management to protect against potential reversals.
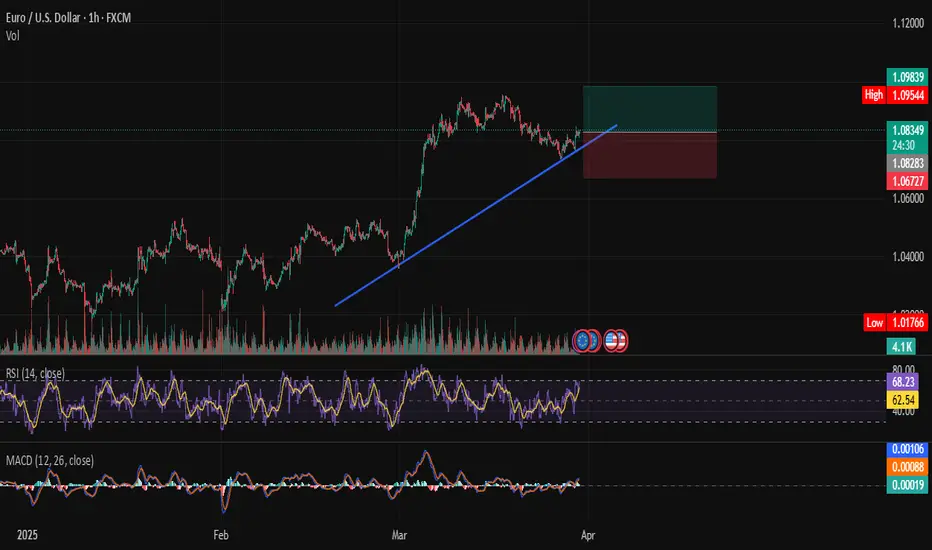
EUR/USD Ready to Soar? Bullish Setup Unfolding!Hi traders! Analyzing EUR/USD on the 1H timeframe, spotting a potential entry:
🔹 Entry: 1.0831 USD
🔹 TP: 1.0983 USD
🔹 SL: 1.0672 USD
EUR/USD is respecting a key trendline support, suggesting a potential bullish continuation. RSI is holding above 60, and MACD shows signs of bullish momentum. If the price remains above the support line, we could see a push toward 1.0983 USD. Keep an eye on price action!
⚠️ DISCLAIMER: This is not financial advice. Trade responsibly.
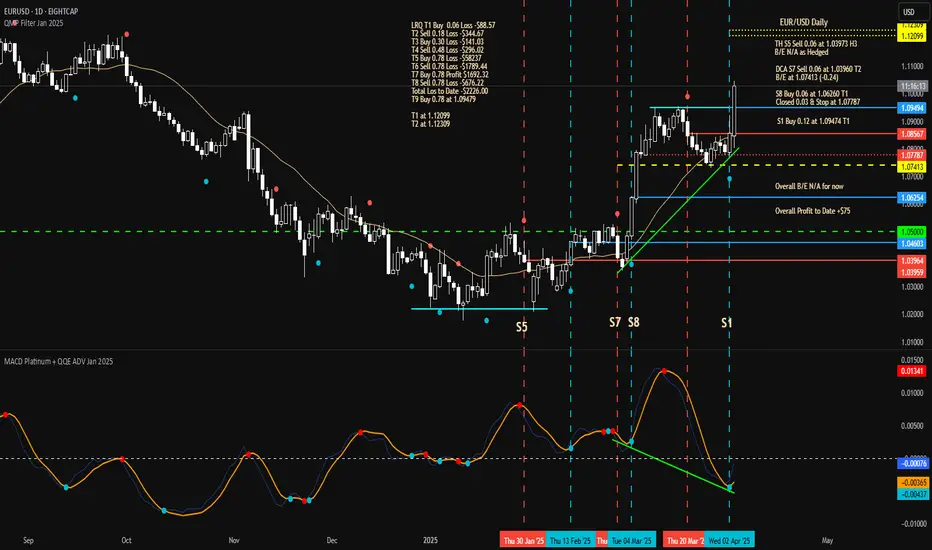
Thu 3rd Apr 2025 EUR/USD Daily Forex Chart Buy SetupGood morning fellow traders. On my Daily Forex charts using the High Probability & Divergence trading methods from my books, I have identified a new trade setup this morning. As usual, you can read my notes on the chart for my thoughts on this setup. The trade being a EUR/USD Buy. Enjoy the day all. Cheers. Jim
Euro Rises Above $1.09 Despite Tariff ThreatsThe euro climbed above $1.09, showing unexpected strength after President Trump announced 20% tariffs on all EU imports.
◉ Fundamental Rationale
● The currency got a boost because the U.S. dollar weakened. Trump’s tariffs made trade tensions worse and worried people about slower economic growth.
● Also, new numbers showed Eurozone inflation fell to 2.2% in March, the lowest since November 2024.
● This lower inflation means the European Central Bank doesn’t need to raise interest rates, making the euro more appealing to investors.
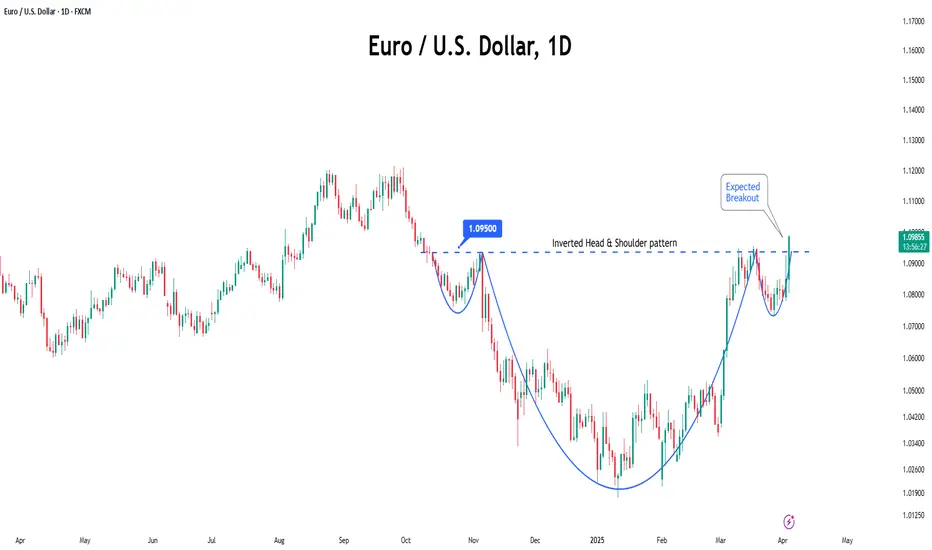
◉ Technical Observation
● From a technical perspective, an inverse head and shoulders pattern has formed, hinting at a possible trend reversal.
● A breakout above $1.095 could pave the way for stronger bullish momentum.
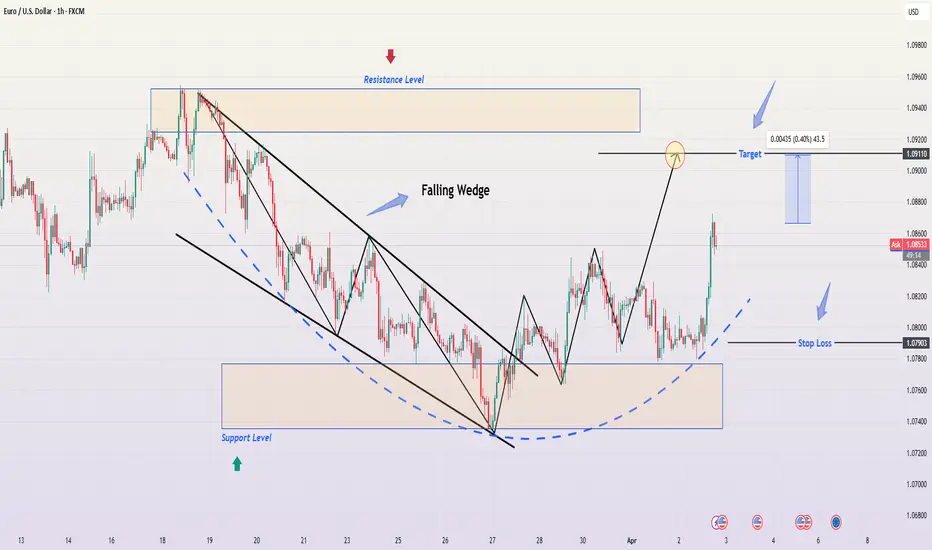
EUR/USD: Bullish Falling Wedge Breakout Towards TargetLet’s analyze the 1-hour candlestick chart of EUR/USD (Euro / U.S. Dollar) on TradingView, published by GoldMasterTraders on April 2, 2025, at 19:04 UTC. The chart highlights a trading setup based on a Falling Wedge pattern, indicating a potential bullish breakout. I’ll describe the chart pattern and the trading setup in detail.
Chart Pattern: Falling Wedge
Pattern Description
Type: The chart identifies a Falling Wedge pattern, which is a bullish chart pattern that typically signals a reversal or continuation of an uptrend. A Falling Wedge forms when the price consolidates between two downward-sloping trendlines that converge over time, with the upper trendline (resistance) sloping more steeply than the lower trendline (support).
Appearance on the Chart:
The Falling Wedge is clearly marked with two converging trendlines:
Upper Trendline (Resistance): Connects the lower highs, sloping downward.
Lower Trendline (Support): Connects the lower lows, also sloping downward but at a less steep angle.
The pattern began forming around March 19, after a sharp decline from 1.9400 to 1.8700, and continued until the breakout on April 2, 2025.
Breakout Direction:
Falling Wedges are typically bullish, meaning the price is expected to break out to the upside. The chart shows the price breaking above the upper trendline of the wedge around April 2, 2025, with a strong bullish candle, confirming the breakout.
The breakout level is around 1.90840, and the price has moved slightly above this level, closing at 1.90864 at the time of the chart.
Key Levels and Trading Setup
1. Support Level
A horizontal support zone is marked around 1.90730 (approximately 1.9070–1.9080).
This level acted as a base during the wedge formation, with the price bouncing off this zone multiple times (e.g., on March 23 and March 30).
The support level aligns with the lower boundary of the wedge, reinforcing its significance as a key area of buying interest.
2. Resistance Level
A resistance zone is marked around 1.92000 (approximately 1.9190–1.9210).
This level corresponds to a previous high reached on March 19, before the wedge formation began. It represents a significant barrier where selling pressure previously emerged.
After the breakout, the price is expected to test this resistance as part of the bullish move.
3. Target
The target for the breakout is projected at 1.92110.
This target is likely calculated by measuring the height of the wedge at its widest point (from the highest high to the lowest low within the pattern) and projecting that distance upward from the breakout point.
The chart indicates a potential move of 0.00435 (0.40%), which aligns with the distance from the breakout level (around 1.90840) to the target (1.92110).
4. Stop Loss
A stop loss is suggested below the support level at 1.90730.
This placement ensures that if the breakout fails and the price falls back into the wedge, the trade is exited with a manageable loss.
The stop loss is just below the breakout level (1.90840), with a distance of approximately 0.00110, representing the risk on the trade.
Trading Setup Summary
Entry:
The setup suggests entering a long (buy) position after the price breaks out above the upper trendline of the Falling Wedge, which occurred around April 2, 2025. The breakout is confirmed by a strong bullish candle closing above the trendline at approximately 1.90840.
Stop Loss:
Place a stop loss below the support level at 1.90730 to protect against a false breakout or reversal. The distance from the breakout level (1.90840) to the stop loss (1.90730) is 0.00110, or about 0.06% of the entry price.
Take Profit/Target:
Aim for the target at 1.92110, which is near the next significant resistance level. The distance from the breakout level to the target is 0.01270, or a 0.40% move.
Risk-Reward Ratio:
The risk is 0.00110 (from 1.90840 to 1.90730), and the reward is 0.01270 (from 1.90840 to 1.92110), giving a risk-reward ratio of approximately 11.55:1 (0.01270 / 0.00110). This is an exceptionally high risk-reward ratio, making the setup very attractive, though traders should ensure the breakout is well-confirmed due to the tight stop loss.
Additional Observations
Price Action Context:
Before the wedge formed, the price experienced a sharp decline from 1.9400 (March 13) to 1.8700 (March 19), indicating a strong bearish trend.
The Falling Wedge represents a consolidation phase within this downtrend, and the upside breakout suggests a potential reversal or at least a corrective move higher.
Volume and Momentum:
The chart doesn’t display volume or momentum indicators (e.g., RSI, MACD). However, a typical confirmation of a Falling Wedge breakout would include:
An increase in volume on the breakout candle, indicating strong buying interest.
Bullish momentum signals, such as an RSI above 50 or a bullish MACD crossover.
Traders might want to check these indicators for additional confirmation of the breakout’s strength.
Timeframe:
This is a 1-hour chart, so the setup is intended for short-term trading, with the target potentially being reached within a few hours to a day.
Market Context:
EUR/USD is influenced by factors like U.S. dollar strength, Eurozone economic data, and interest rate differentials. A bullish move in EUR/USD could be driven by a weaker dollar (e.g., due to dovish U.S. economic data) or positive Eurozone developments.
Conclusion
The TradingView idea presents a bullish setup for EUR/USD based on a Falling Wedge pattern on the 1-hour chart. The price has broken above the wedge’s upper trendline, confirming a bullish move with a target of 1.92110. The setup includes a stop loss at 1.90730 to manage risk, offering an impressive risk-reward ratio of 11.55:1. Key levels to watch include the support at 1.90730 and the resistance at 1.92000. Traders should consider additional confirmation from volume and momentum indicators, as well as broader market conditions, before executing the trade. Since this chart is from April 2, 2025, market conditions may have evolved, and I can assist with searching for more recent data if needed!
EURUSD(20250402) Today's AnalysisToday's buying and selling boundaries:
1.0799
Support and resistance levels
1.0851
1.0832
1.0819
1.0780
1.0767
1.0748
Trading strategy:
If the price breaks through 1.0799, consider buying, the first target price is 1.0819
If the price breaks through 1.0780, consider selling, the first target price is 1.0767
#EURUSD: A Clean Bullish Move! Dear Traders,
When we look into how prices have behaved in last couples of weeks it is clearly noted that bulls have entered the market and price successfully changed the price character. We also have a strong evidence of that.
Please like and comment
thank you
EURUSD BUY/LONGBy utilizing Fibonacci retracement levels, historical patterns, , we can formulate a hypothesis that the market might follow a similar trajectory if bullish sentiment prevails.
Euro at Critical Demand – Is the Trend About to Flip?Euro reached an important zone for my setup, triggering a long position. Although it’s still trending below the fibcloud on the 4H timeframe, we’ve seen a solid 0.5% recovery from the recent low. I’m looking for this area to hold as support, with defined risk in case the setup invalidates.
Technicals:
• Price tapped into a major 4H support level where liquidity historically steps in.
• The current move marks a 0.5% bounce from the low, showing early signs of demand.
• Still trading below the fibcloud, but a reclaim of that zone would open the path toward 1.0850.
• Setup includes a stop-loss below the most recent wick low, with a clear structure to build a higher low.
Fundamentals:
EUR-side strength:
• ECB maintains a slower pace of rate cuts compared to the Fed.
• Growth and inflation in the Eurozone are still challenges, but the ECB’s hawkish stance continues to support medium-term EUR strength.
• The ECB may hike another 150 bps to reach a 4% terminal rate, which favors EUR upside.
USD-side risks:
• Trump announced plans to impose a 25% tariff on all car imports, including from the EU-adding geopolitical and trade uncertainty.
• Traders remain cautious around further escalation in US-EU trade tensions.
• US Initial Jobless Claims later today could bring weakness to the dollar if the data disappoints.
In short, while the USD remains resilient, the EUR fundamentals and the current technical zone make this a compelling spot for a bounce.
Note: Please remember to adjust this trade idea according to your individual trading conditions, including position size, broker-specific price variations, and any relevant external factors. Every trader’s situation is unique, so it’s crucial to tailor your approach to your own risk tolerance and market environment.
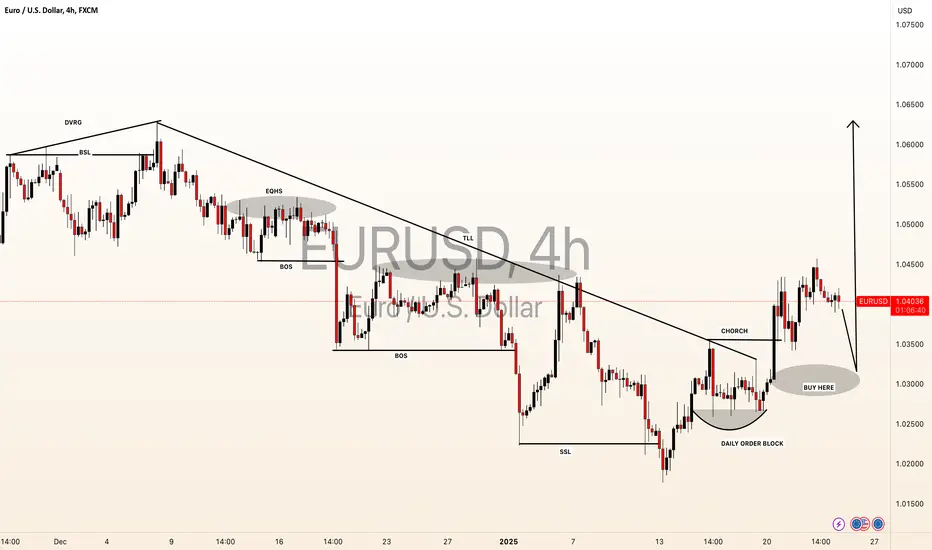
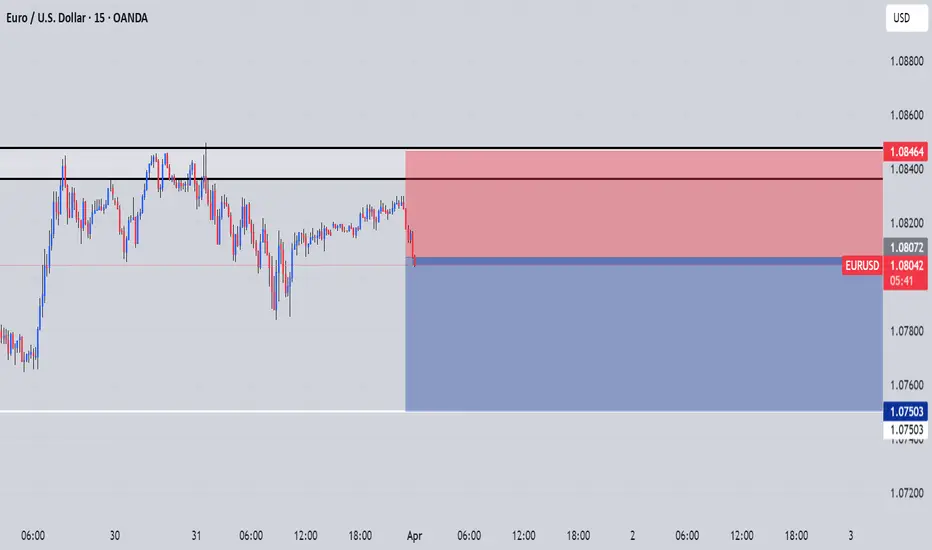
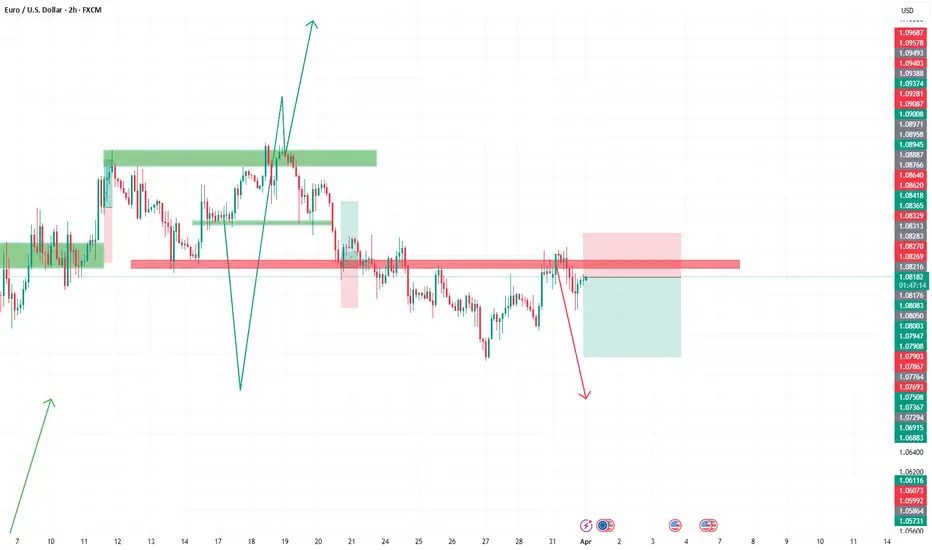
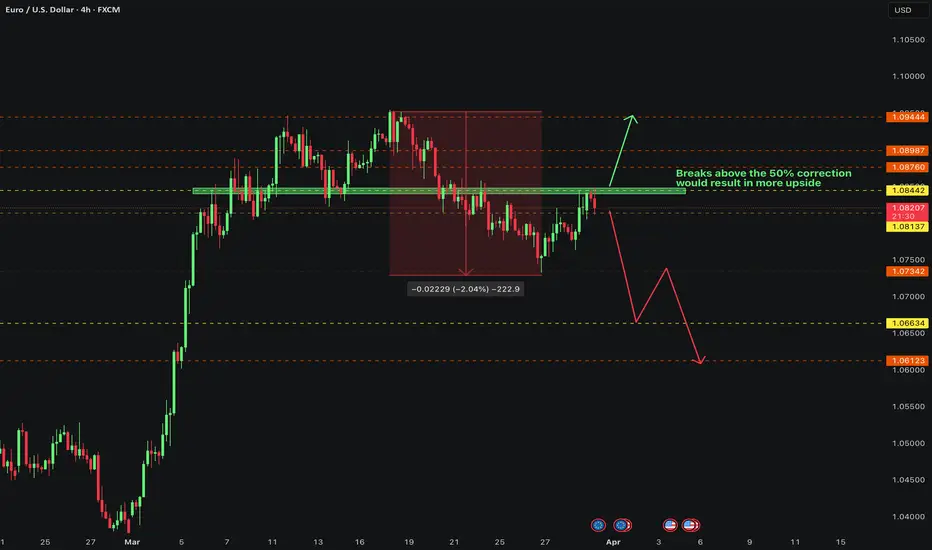
EURUSD - what’s next?Here is our in-depth view and update on EURUSD . Potential opportunities and what to look out for. This is a long-term overview on the pair sharing possible entries and important Key Levels .
Alright first, let’s take a step back and take a look at EURUSD from a bigger perspective.
After making such a huge upside move, we are expecting EURUSD to have some sort of a correction or a pullback to the downside. After that we got a sell off on EURUSD and just today we hit the 50% correction level at around 1.08442 . After failing to break to the upside we can expect more sells to be in play. Any breaks to the downside from the current price will confirm this. Although TVC:DXY is not as strong at the moment, it still is a global reserve currency . We seen that in play last week when we saw massive upside on OANDA:XAUUSD and on TVC:DXY . We must understand that investors are also pouring their money into DXY as it is a global reserve currency. I still personally believe TVC:DXY holds more strength against TVC:EXY hence why I am still looking to short the pair.
Scenario 1: SELLS from current price
With the instant sell, we are risking a possible pullback and continuations to the upside however, DXY is looking like it will reverse. Failing to break to the upside can also be taken as a confirmation for potential sells.
Scenario 2: BUYS at the break of the Key Level (around 1.085)
With the break to the upside, we can expect more buys to come in play possibly targeting previous highs on EURUSD at around 1.09444.
KEY NOTES
- DXY possible reversal to the upside.
- Breaks above the KL and to the upside would confirm higher highs.
- EURUSD has completed the 50% correction to the upside.
- DXY is the global reserve currency.
Happy trading!
FxPocket
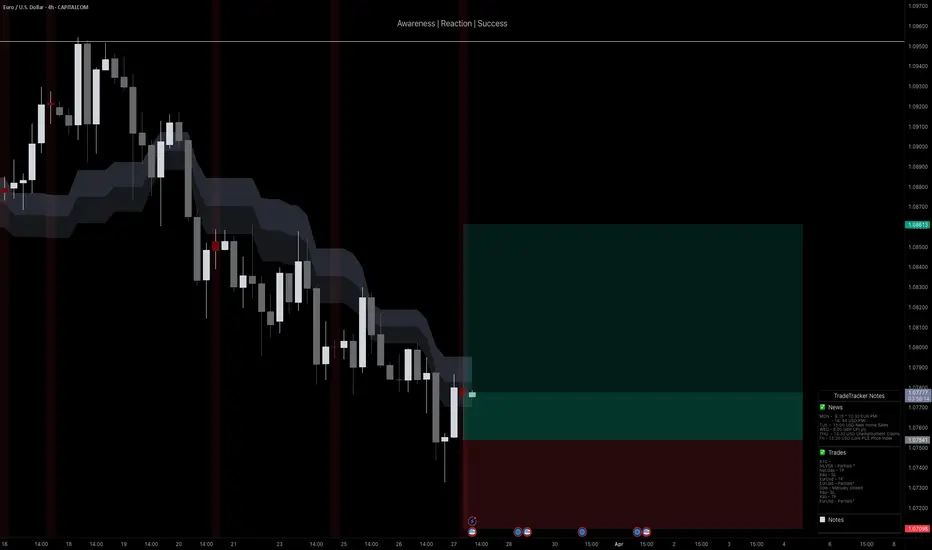
Week of 3/30/25: EURUSD Weekly AnalysisEURUSD has healthy price action with the MTF switching to bullish, once MTF aligns with the daily, we're definitely good to go on longs. For now waiting for price action to show us that it wants to move higher.
Major news: NFP Friday
Thanks for coming, goodluck this week with your trades!
