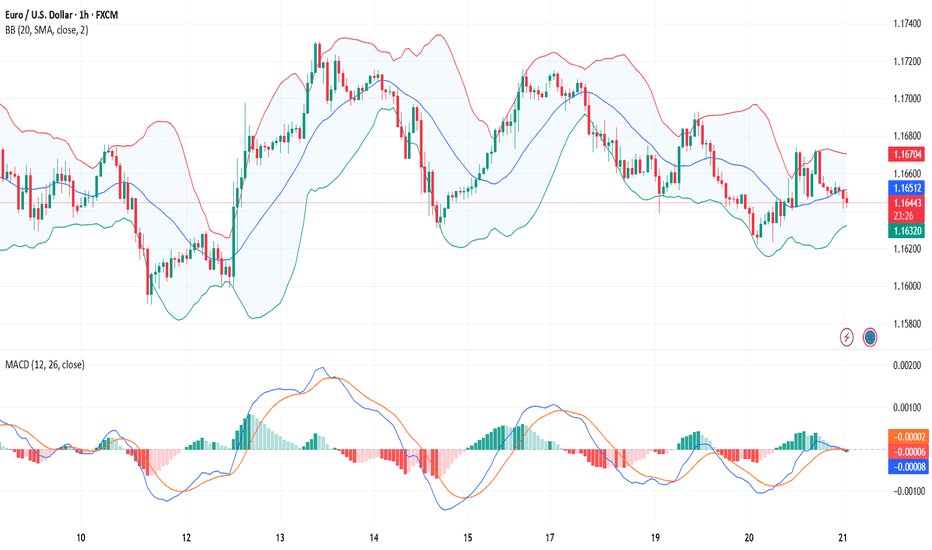
EURUSD(20250821) Today's AnalysisMarket Update:
This week, central bankers from around the world gathered in Jackson Hole, Wyoming, for the annual global central bank meeting. They planned not only to exchange research and enjoy the beautiful mountain scenery, but also to defend Federal Reserve Chairman Jerome Powell. Powell has come under sustained attack from US President Trump for his refusal to cut interest rates. Trump has also promised to replace Powell with a more compliant candidate after his term ends next year. This offensive has unnerved global policymakers, who worry that central bank independence, seen as key to controlling inflation, could be undermined.
Technical Analysis:
Today's Buy/Sell Levels:
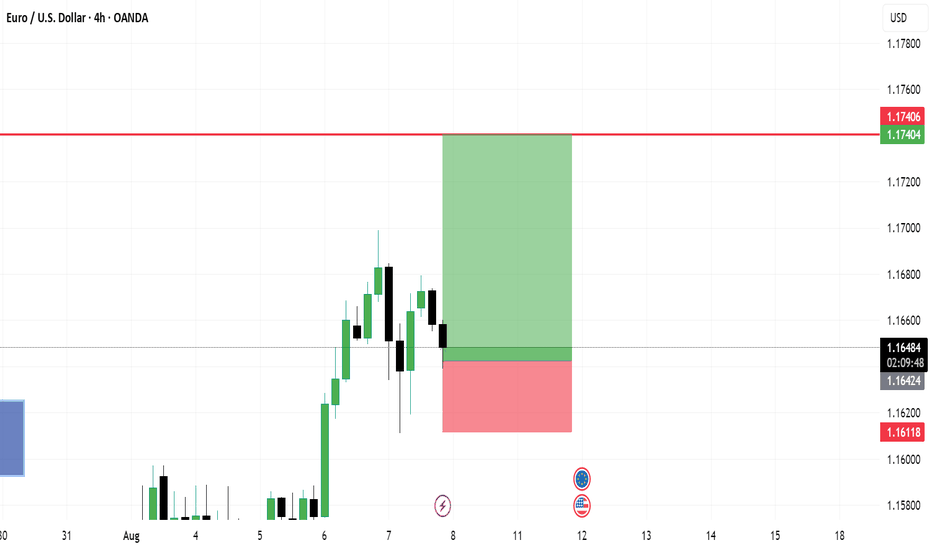
1.1648
Support and Resistance Levels:
1.1699
1.1680
1.1668
1.1628
1.1616
1.1597
Trading Strategy:
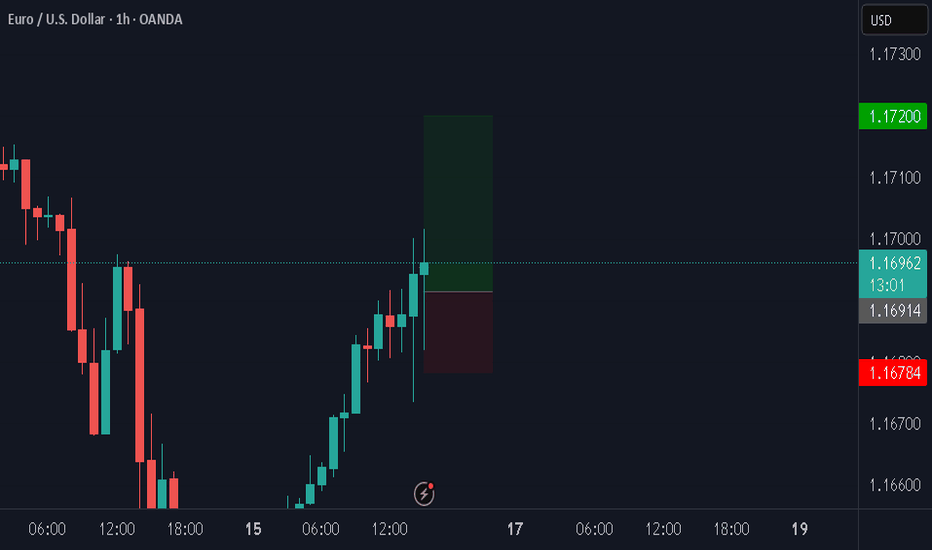
On a break above 1.1668, consider entering a buy position, with the first target at 1.1680.
On a break below 1.1648, consider entering a sell position, with the first target at 1.1628.
Eurusdoutlook
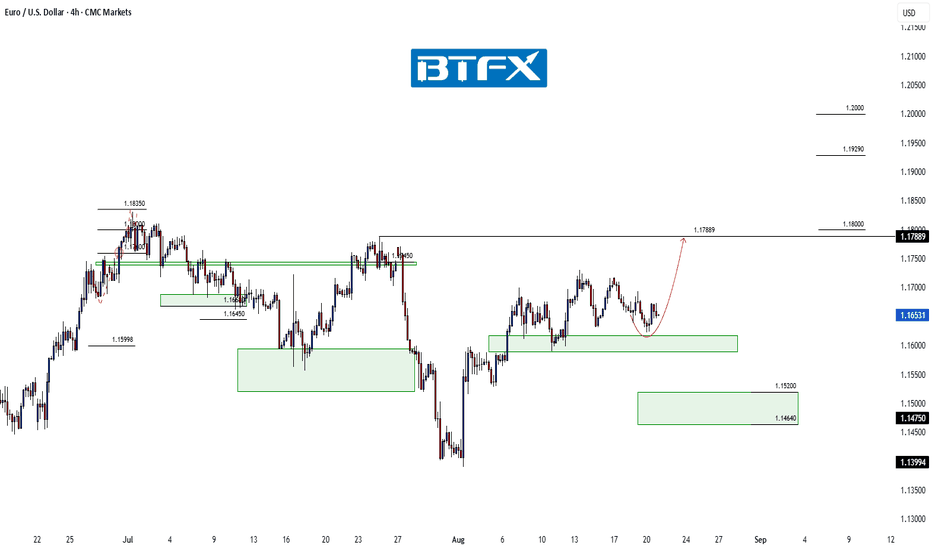
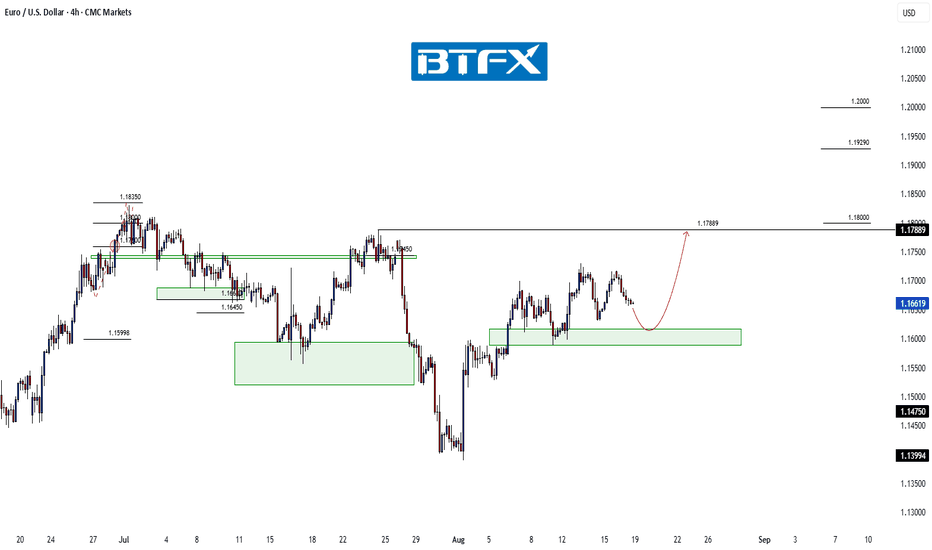
EUR/USD Holding Above 1.1600 — Outlook Remains BullishHi Everyone,
As highlighted in our previous idea, EUR/USD continues to correct above the 1.16000 zone, which could potentially set the stage for a renewed push higher toward the 1.17889 level. Should price extend lower in search of further demand, the next key area of interest sits around 1.15200, where we anticipate strong buying interest to step in.
The impulsive rally from the 1st August low continues to reinforce our bullish outlook on EUR/USD, and upcoming headlines in what looks to be a decisive week could provide the catalyst for the Fiber to press higher.
Our broader outlook remains unchanged: we continue to expect the pair to build momentum for another leg to the upside. A decisive break above 1.17889 would open the path toward the 1.18350–1.19290 area and ultimately the 1.20000 handle.
We’ll be monitoring price action closely to see whether this recovery gains traction and if buyers can sustain momentum through resistance. The longer-term outlook remains bullish, provided price continues to hold above the key support zone.
We’ll keep you updated throughout the week as the structure unfolds and share how we’re managing our active positions.
Thanks again for all the likes, boosts, comments, and follows — your support is truly appreciated!
All the best for the rest of the week.
Trade safe.
BluetonaFX
Market Analysis: EUR/USD Dips AgainMarket Analysis: EUR/USD Dips Again
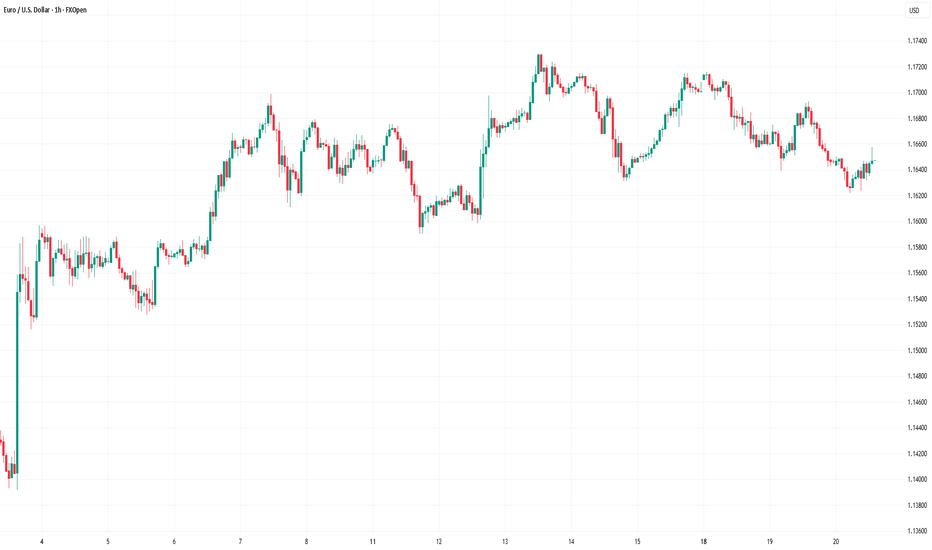
EUR/USD declined from 1.1720 and traded below 1.1650.
Important Takeaways for EUR/USD Analysis Today
- The Euro started a fresh decline after a decent move above 1.1680.
- There was a break below a key bullish trend line with support at 1.1650 on the hourly chart of EUR/USD.
EUR/USD Technical Analysis
On the hourly chart of EUR/USD, the pair rallied above the 1.1680 resistance zone before the bears appeared, as discussed in the previous analysis. The Euro started a fresh decline and traded below 1.1660 against the US Dollar.
There was a break below a key bullish trend line with support at 1.1650, and a low was formed near 1.1622. After that, the pair started a consolidation phase.
There was a minor recovery wave above 1.1630. EUR/USD is now trading below 1.1650 and the 50-hour simple moving average. On the upside, the pair is now facing hurdles near the 23.6% Fib retracement level of the downward move from the 1.1692 swing high to the 1.1622 low at 1.1640.
The next key resistance is 1.1655 and the 50% Fib retracement. The main barrier for the bulls could be 1.1665. A clear move above 1.1665 could send the pair toward 1.1690. An upside break above 1.1690 could set the pace for another increase. In the stated case, the pair might rise toward the 1.1720 zone.
If not, the pair might resume its decline. The first major support on the EUR/USD chart is near 1.1620. The next important region for buyers sits at 1.1600. If there is a downside break below 1.1600, the pair could drop toward 1.1550. Any more losses might send the pair toward 1.1500.
This article represents the opinion of the Companies operating under the FXOpen brand only. It is not to be construed as an offer, solicitation, or recommendation with respect to products and services provided by the Companies operating under the FXOpen brand, nor is it to be considered financial advice.
EURUSD: Potential impact of Trump-Puting meeting on fibreIn this video, we break down what the highly anticipated Trump-Putin talks could mean for the EUR/USD pair. The meeting is set for 21:30 CET, after markets close, so any immediate reaction may happen when they reopen.
Key scenarios include:
Positive Tone: If Trump and Putin get along, risk appetite could rise, but a potential Ukraine peace deal may reduce EU defence spending and weaken the Euro.
No Deal: If talks break down, fears of tariffs and trade war could resurface. While risk aversion often supports the dollar, increased US tariffs might instead fuel a "sell America" trend, which could help the Euro only slightly, with gold and treasuries likely benefiting more.
Tariff Threats: Trump’s push for a Ukraine ceasefire could see new tariffs if talks fail, putting the EU in a tough spot over Russian oil and risking Euro weakness due to potential slower growth.
Market movements will depend on the meeting's tone and follow-up statements, so stay tuned for how these geopolitical dynamics could drive EUR/USD next week!
This content is not directed to residents of the EU or UK. Any opinions, news, research, analyses, prices or other information contained on this website is provided as general market commentary and does not constitute investment advice. ThinkMarkets will not accept liability for any loss or damage including, without limitation, to any loss of profit which may arise directly or indirectly from use of or reliance on such information.
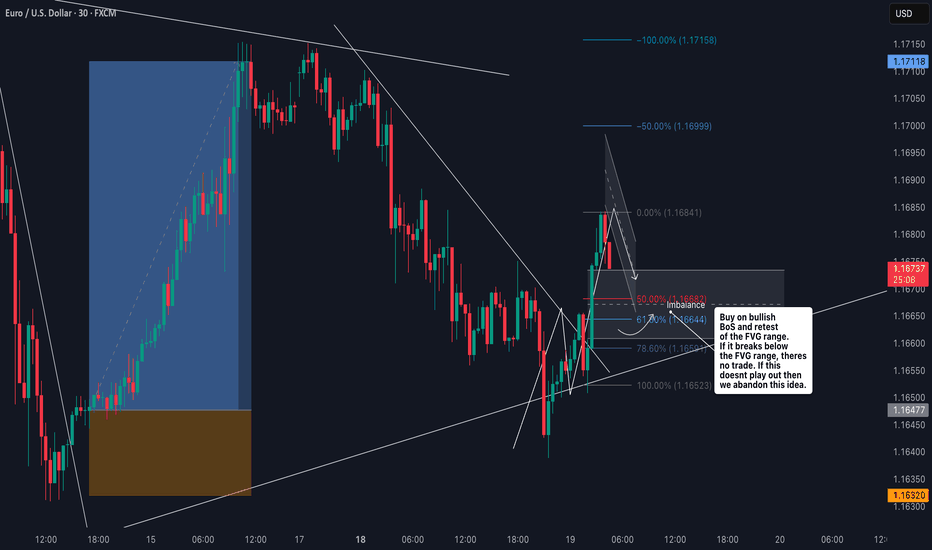
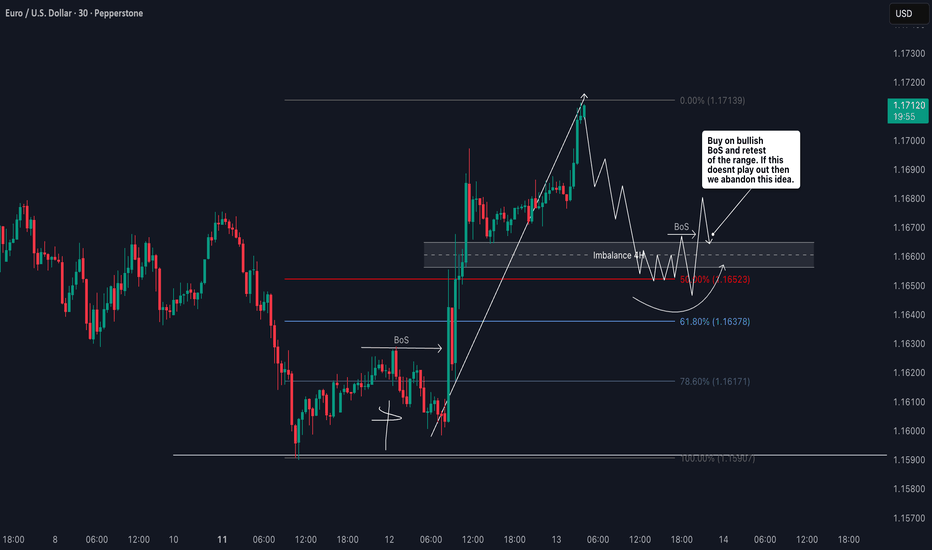
EURUSD Bullish Structure Break: Watching for Pullback EntryI’m closely monitoring EURUSD 📊, where price action is starting to show a bullish structure break 📈, signaling potential upside 🔝. On the 30-minute chart ⏱️, I’m watching for a pullback into the imbalance zone ⚖️ highlighted in the video 🎥. As long as price holds above the low of that imbalance range ⬇️, I’ll be looking for a potential long opportunity 🚀💡. (Not financial advice).
EUR/USD Structure Intact — Path Higher Remains in PlayHi Everyone,
Since the 1st August low, EUR/USD has rallied swiftly back above the 1.16000 level, reclaiming the key 1.16450 zone. If the current consolidation holds above the 1.15888–1.16170 area, this should provide a base for further upside toward 1.17889.
A sustained push into this level in the coming sessions would further confirm renewed buying interest.
Our broader outlook remains unchanged: we continue to expect the pair to build momentum for another leg higher. A decisive break above 1.18350 could open the path toward the 1.19290 area and ultimately the 1.20000 handle.
We’ll be monitoring price action closely to see whether this recovery gains traction and if buyers can maintain momentum through resistance. The longer-term outlook remains bullish, provided price continues to respect the key support zone.
We’ll keep you updated throughout the week as the structure develops and share how we’re managing our active positions.
Thanks again for all the likes, boosts, comments, and follows. We truly appreciate the support!
All the best for the rest of the week.
Trade safe.
BluetonaFX
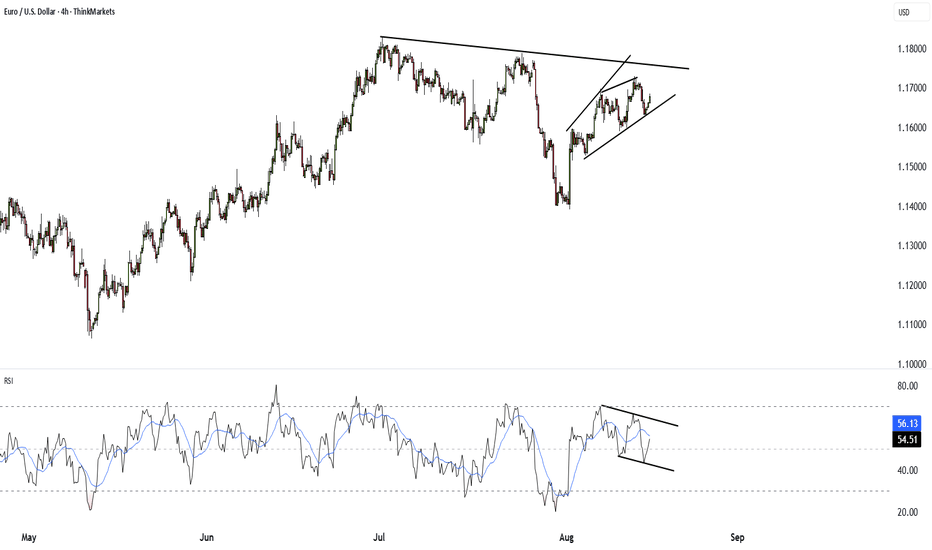
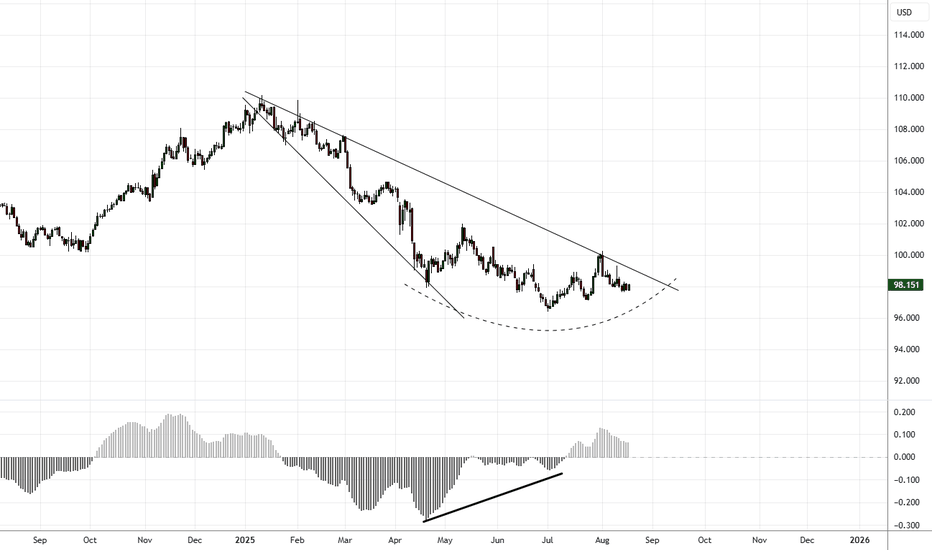
Are U.S. Dollar Bears getting exhausted?Still holding on to my EUR/USD short positions since late June/early July and it’s been quite a game of patience at this point but as I have been analyzing the U.S. Dollar for the past few months, from a purely technical analysis perspective, I’m currently still seeing the U.S. Dollar potentially carving out a bottom here and make a run to re-visit the 100 - 102 price zone.
I know markets are highly anticipating a Federal Reserve rate cute in September but with inflation still sticking around, it may not be such a sure thing just yet.
All eyeballs and ears will be on tap for Powell’s speech on Friday.
Technical analysis signals:
• Descending Broadening/Expanding Wedge (Bullish Pattern)
• MACD Histogram showing a sign of potential bearish exhaustion
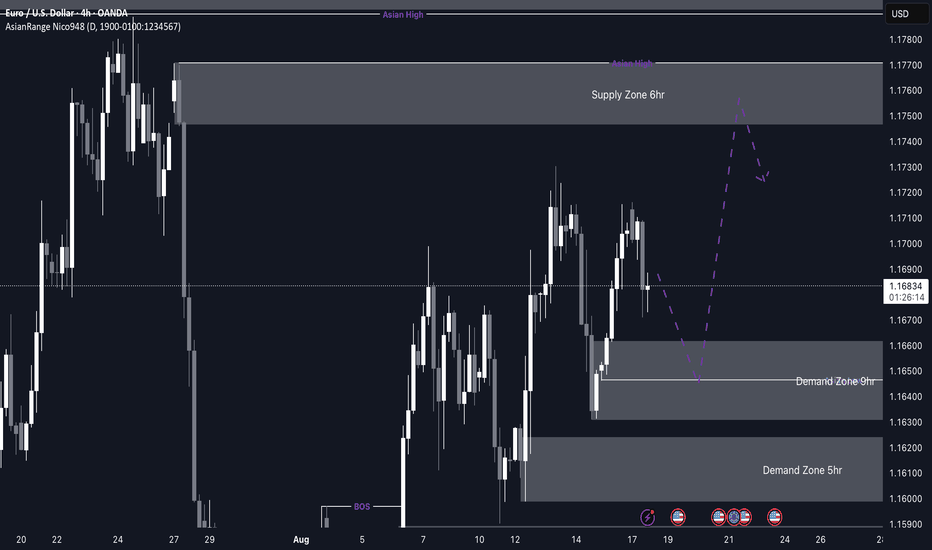
EUR/USD Buy idea to the upside Weekly EURUSD Analysis
My outlook for EU is similar to GU — I’ll be watching for a retracement into demand before looking for buys back to the upside. The key area on my chart is the 9H demand zone, where I’ll be monitoring for signs of accumulation before entering longs.
At the same time, I’ve marked a 6H supply zone sitting at a strong premium level. If the bullish scenario doesn’t play out, this would be an ideal area to catch potential sells to the downside. Either way, I’ll be waiting for price to slow down and confirm at one of my POIs before committing.
Confluences for EU Buys:
- Strong 9H demand zone responsible for the last break of structure.
- Overall bullish structure → pro-trend trade idea.
- DXY analysis aligns with bullish EU outlook.
- Imbalance above + liquidity that still needs to be taken.
P.S. If price breaks below the 9H demand zone, I’ll be eyeing the 5H demand zone just beneath, as it’s more discounted and potentially offers an even cleaner long setup.
Let’s have a strong week ahead!
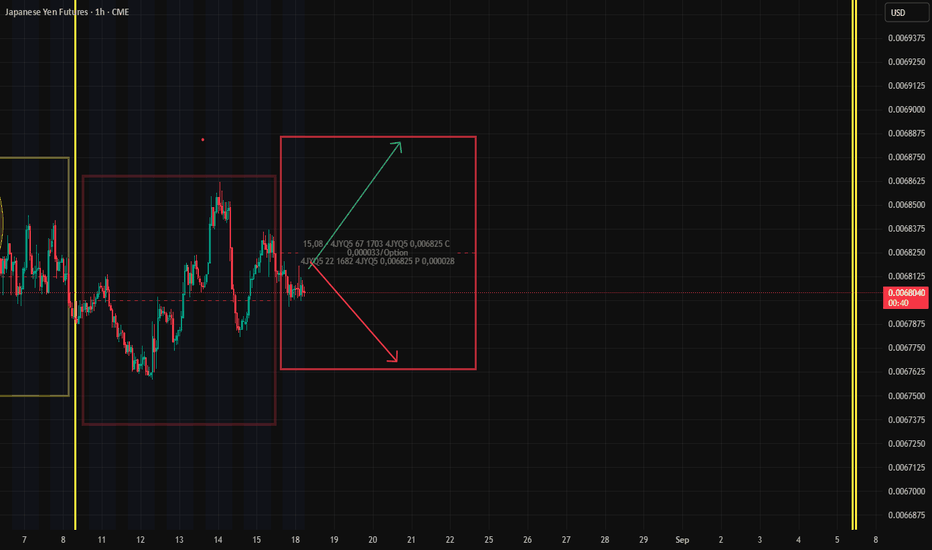
Very briefy: from Straddles to Spreads — What Options Are Saying📊 Market Pulse (CME data based): Key Flow Signals (15.08)
Gold (Oct series):
Spreads at 3650/3750 are being closed.
📉 Sentiment: moderately bearish — no strong upside expected.
AUD:
No major repositioning or fresh flow.
🟢 Sentiment remains bullish — quiet but intact.
EUR:
No insider-level activity or large block trades.
Neutral zone — no directional edge yet.
GBP:
Growing put interest at 1.35.
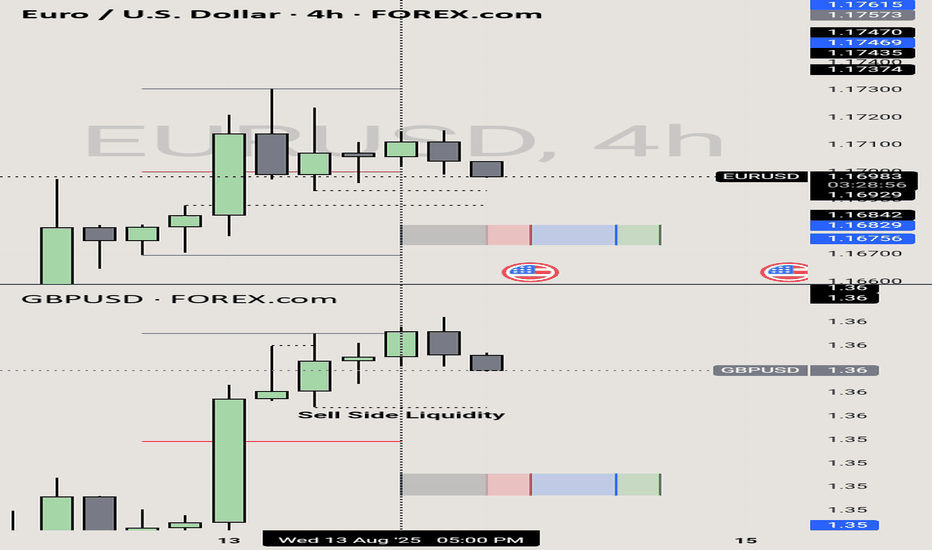
🟠 Sentiment: moderately bearish — but this level will act as local support IF reached.
JPY:
Another straddle live — expires Aug 22 (4-day life).
Boundaries set, setup familiar.
We know the drill: fade the edges, watch the break-even levels for LONG/SHORT opens
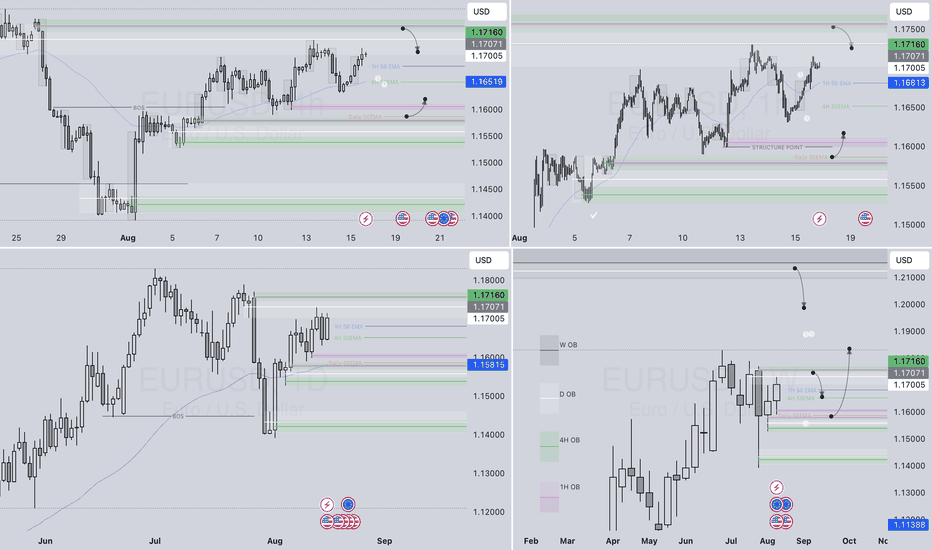
EURUSD – WEEKLY FORECAST Q3 | W34 | Y25📊 EURUSD – WEEKLY FORECAST
Q3 | W34 | Y25
Weekly Forecast 🔍📅
Here’s a short diagnosis of the current chart setup 🧠📈
Higher time frame order blocks have been identified — these are our patient points of interest 🎯🧭.
It’s crucial to wait for a confirmed break of structure 🧱✅ before forming a directional bias.
This keeps us disciplined and aligned with what price action is truly telling us.
📈 Risk Management Protocols
🔑 Core principles:
Max 1% risk per trade
Only execute at pre-identified levels
Use alerts, not emotion
Stick to your RR plan — minimum 1:2
🧠 You’re not paid for how many trades you take, you’re paid for how well you manage risk.
🧠 Weekly FRGNT Insight
"Trade what the market gives, not what your ego wants."
Stay mechanical. Stay focused. Let the probabilities work.
FRGNT
FX:EURUSD
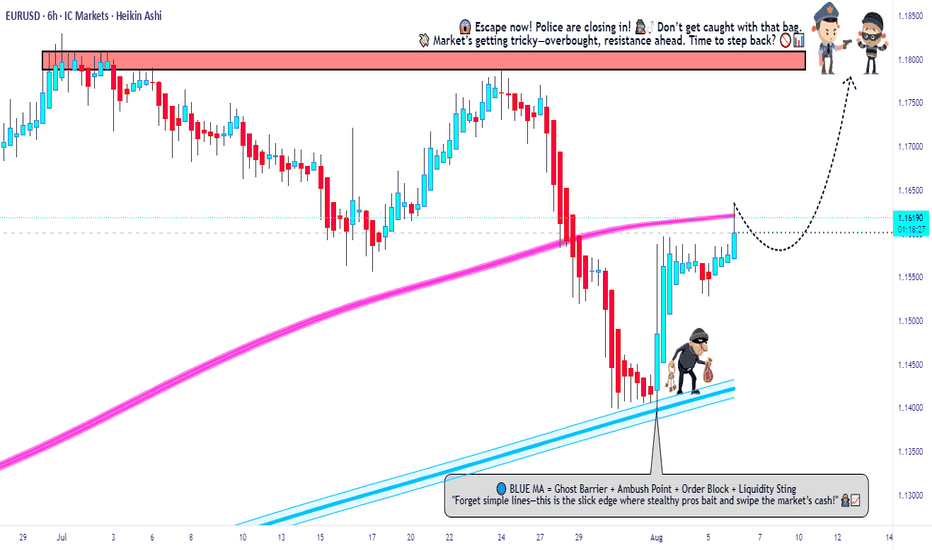
Fiber Battle Plan: Bulls Prepare for EUR/USD Uprising🏴☠️💸 EUR/USD "Fiber Heist Plan" – Thief Trader's Bullish Raid! 💸🏴☠️
🔓 The Vault is CRACKED – Time to LOAD UP! 🚀📈💰
🎯 MASTER PLAN:
Asset: EUR/USD ("Fiber")
Direction: BULLISH HEIST 🐂💪
Entry Strategy: Layered Limit Orders (Sneaky thief-style accumulation)
Trigger: Hull MA CROSS confirmed + Price > 1.16300 🎯
Stop Loss: 1.15100 (Guarding the loot!) 🛡️
Target: 1.18000 (Bank it & bounce!) 💰🔥
🕵️ THIEF TRADER’S BREAKDOWN:
💡 "Weak hands shake, WE TAKE!" – This is a high-probability bullish raid with layered entries for MAXIMUM stealth.
✅ ENTRY TACTICS:
Buy Limit Orders stacked near swing lows (1.16300 zone)
Only trigger AFTER Hull MA confirms bullish flip (No early fomo!)
Scale in like a pro thief – don’t dump all bullets at once.
⚔️ RISK CONTROL (MANDATORY!):
SL at 1.15100 (Break this? ABORT MISSION.)
No revenge trading! Stick to the plan or get caught slippin’.
🎯 PROFIT SECURING:
First TP: 1.18000 (Lock in gains!)
Trailing SL option (If momentum stays strong, let it RUN!)
🚨 THIEF’S WARNING:
⚠️ News = Trap Zone! (Avoid fresh entries during high-impact news)
⚠️ No greed! Secure profits before the market reverses on you.
⚠️ Follow the Hull MA like a shadow – if it flips bearish, RE-EVALUATE!
🔥 SUPPORT THE HEIST!
💥 SMASH THAT LIKE & BOOST BUTTON if you're riding with the Thief Trading Crew!
💬 Comment "🚀 LOADED!" if you're in!
We steal smart, trade sharp, and stack profits like bandits. Stay lethal, traders! 🐱👤💸🔥
EURUSD potential longs due to as expected retail sales data. U.S. retail sales for July 2025 rose by 0.5% month-over-month, reaching $726.3 billion, according to the Commerce Department’s Census Bureau. This matched economists’ expectations but was a slowdown from June’s revised 0.9% increase.
Due to this we will be looking for Euro strength vs Dollar weakness.
EUR/USD Shows Optimism Ahead of Trump–Putin MeetingEUR/USD Shows Optimism Ahead of Trump–Putin Meeting
The meeting between the Presidents of the United States and the Russian Federation, scheduled for today in Alaska, is a major geopolitical event with the potential to exert a significant influence on financial markets.
Expectations are mounting that the talks could lead to a cessation of hostilities in Ukraine – a prospect acting as a bullish factor for the euro. As a result, the EUR/USD chart has been displaying an upward trajectory this week (highlighted by the blue channel).
The blue arrow indicates that:
→ Yesterday’s release of the highest Producer Price Index (PPI) figures in three years triggered a sharp strengthening of the US dollar – possibly because market participants assumed the Federal Reserve might postpone monetary policy easing in light of rising producer prices (widely considered a consequence of Trump’s tariff measures).
→ However, the lower boundary of the upward channel prevented further decline, and today EUR/USD is showing optimism ahead of the presidential meeting.
EUR/USD Technical Analysis
On 7 August, we plotted a descending channel based on the sequence of lower highs and lows formed over the summer.
From the bearish perspective, the price is currently near a cluster of key resistance levels, which include:
→ the upper boundary of the descending (red) channel;
→ the 1.17145 level (a historical price interaction zone, as shown by the arrows on the left side of the chart);
→ the median line of the ascending (blue) channel.
Conversely, the bulls could be supported by:
→ the lower boundary of the blue channel;
→ the aggressive buying momentum evident in the sharp EUR/USD rally on 12 August (highlighted by the orange arrow).
The bullish case is further reinforced by the fact that buyers managed to fully recover from the decline that began on 28 July.
Given the above, we could assume some consolidation today as the market awaits the outcome of the presidential talks. The fact that the ADX indicator is hovering near its lows and trending downward underscores the current indecision and caution in the market.
However, Monday’s open could prove highly volatile. Be prepared for sharp EUR/USD movements in either direction, depending on statements made by the US and Russian leaders.
This article represents the opinion of the Companies operating under the FXOpen brand only. It is not to be construed as an offer, solicitation, or recommendation with respect to products and services provided by the Companies operating under the FXOpen brand, nor is it to be considered financial advice.
EURUSD Pullback Could Present A Buying Opportunity📊 I’m analyzing EURUSD and have observed a recent bullish break of structure on the daily chart 📈. My bias remains to the upside, but with price now stretched after its latest push, I’m watching for a pullback into important value zones. A confirmed bullish break of market structure from these areas could set up a strong long opportunity 🔍💡🚀 (not financial advice).
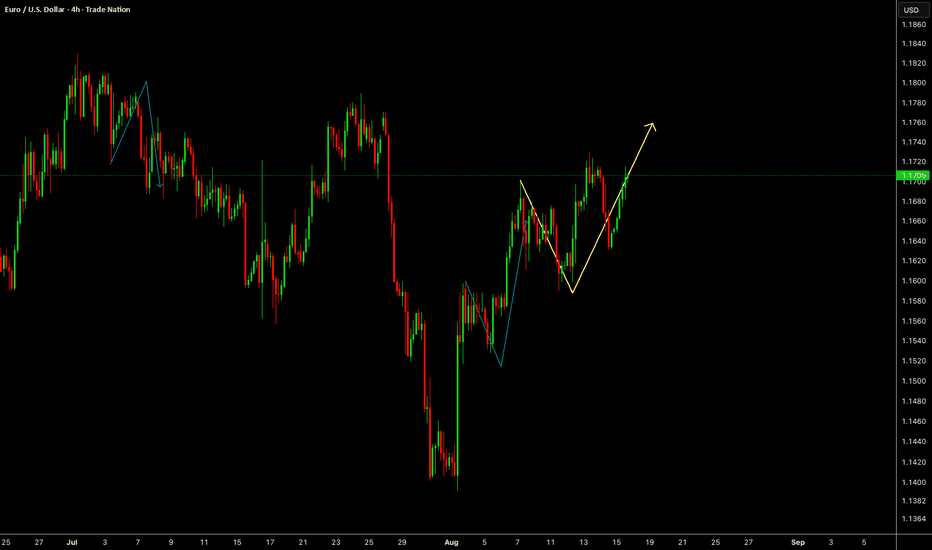
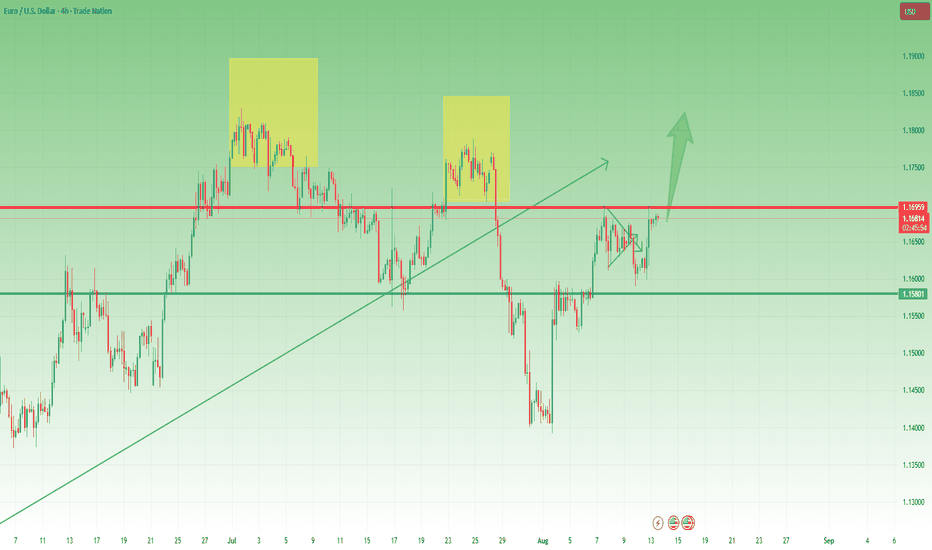
EURUSD Bulls Defend 1.16 – Break Above 1.17 Could Ignite RallyOn Monday, I mentioned that EURUSD could extend its ascent thanks to a short-term pennant formation.
For this reason, I bought into dips and, fortunately, my stop loss was well placed — the pair reversed only 5 pips above it.
Now, the trade is sitting comfortably with a 40-pip profit, and in my view, the upside potential isn’t over yet.
Technical view:
• On Monday, EURUSD dipped to test the 1.1600 support zone.
• The bounce from there resumed the uptrend that started after this month’s NFP release.
• The pair is now challenging the horizontal resistance around 1.1700.
A clean break above 1.1700 would likely open the door to the 1.1800 area.
Bias: EURUSD remains bullish as long as 1.1600 holds. 🚀
Disclosure: I am part of TradeNation's Influencer program and receive a monthly fee for using their TradingView charts in my analyses and educational articles.
EURUSD – DAILY FORECAST Q3 | W33 | D11 | Y25
📊 EURUSD – DAILY FORECAST
Q3 | W33 | D11 | Y25
Daily Forecast 🔍📅
Here’s a short diagnosis of the current chart setup 🧠📈
Higher time frame order blocks have been identified — these are our patient points of interest 🎯🧭.
It’s crucial to wait for a confirmed break of structure 🧱✅ before forming a directional bias.
This keeps us disciplined and aligned with what price action is truly telling us.
📈 Risk Management Protocols
🔑 Core principles:
Max 1% risk per trade
Only execute at pre-identified levels
Use alerts, not emotion
Stick to your RR plan — minimum 1:2
🧠 You’re not paid for how many trades you take, you’re paid for how well you manage risk.
🧠 Weekly FRGNT Insight
"Trade what the market gives, not what your ego wants."
Stay mechanical. Stay focused. Let the probabilities work.
FX:EURUSD
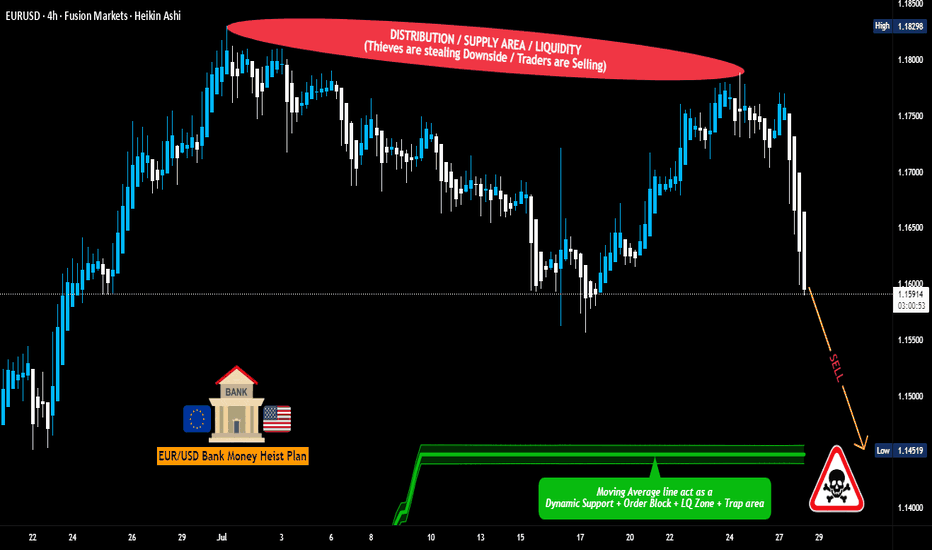
EUR/USD Robbery Blueprint Bear Strike Activated!💣🎯Operation Fiber Down: EUR/USD Robbery Blueprint (Day Trade Edition) 💰🔫
🚨 Thieves, Hustlers & Chart Bandits Assemble! 🚨
🌍 Hi! Hola! Ola! Bonjour! Hallo! Marhaba! 🌍
Welcome back to another Thief Trading Operation, where the money never sleeps—and neither do we. Let’s break into the vault of EUR/USD “The Fiber” with surgical precision. 🧠💼🕶️
🧨 THE MASTER ROBBERY PLAN: EUR/USD SHORT STRIKE 🔍💸
💀 Market Bias: Bearish – Trend Reversal + Supply Trap Setup
🎯 Target: 1.14600
🛑 Stop-Loss: Near Swing High (around 1.16700 – 4H chart view)
🕓 Timeframe Focus: 15m / 30m / 3H
🧭 ENTRY ZONE:
👣 Plan your entry from recent high retests—that’s where the big money bulls get trapped.
🎯 Use Sell Limit Orders (DCA style / Layered Limit Orders) like a true thief setting up tripwires.
💼 RISK STRATEGY:
💡 SL should match your lot size and order count—not one-size-fits-all!
📌 Place above key structure or swing level (e.g. 1.16700) based on timeframe.
🔍 BEHIND THE SCENES – THE WHY:
The EUR/USD "Fiber" pair is showing all the classic signs of a trend shift and bear raid setup, including:
📰 Fundamentals weakening the Euro
💣 COT Report reveals institutional exits
🍂 Seasonal Bias points to downward trend
📉 Intermarket Pressure from bond yields & USD strength
📊 Sentiment turning overly bullish = trap zone
⛽ Storage & Inventory imbalances adding fuel
📌 Reminder: Before any robbery, study the layout—Macro, Fundamentals, Sentiment, and Intermarket are your blueprint.
🚨 HEIST ALERT – PROTECT THE LOOT:
🕰️ High-Impact News Events? Tighten up!
💼 Don’t take fresh entries during releases.
🔐 Use Trailing SLs to lock in profits.
🎯 Exit with grace before the sirens start.
⚡🔥JOIN THE CREW, BOOST THE LOOT🔥⚡
💥 Smash the Boost Button 💥 if you're vibing with the Thief Trading Movement.
We ain’t just trading—we’re executing strategic robberies on the market’s weaknesses.
🧠💪 Every like = more power to the crew. Every comment = a new map to a vault.
We rob, retreat, and repeat. Let’s make money with skill, not luck. 🕶️💰🚁
⚠️ LEGAL COVER (For the Lawyers 😏):
This plan is not investment advice, just an organized heist blueprint by chart robbers.
Always manage your own risk and update your plan as the market evolves.
🕶️ Stay ready for the next master plan... Until then, keep your charts clean and your stops tight. 🕶️💣📉
– Thief Trader Out 🐱👤🚀
EURUSD: Are Sellers About To Take Control? CPI May Decide!Welcome back to the Weekly Forex Forecast for the week of Aug 11 - 15th.
In this video, we will analyze the following FX market:
EURUSD
The EURUSD saw a relatively small range of action Friday, forming an Inside Bar for the week. Although it closed bullishly, it did so in the middle of the range. With CPI Data coming Tuesday, it may be a holding pattern until the announcement.
Structure wise, the Daily TF shows a bearish shift in the market, with a retracement into a
-FVG. If the inefficiency holds, lower prices are coming for the near term. Wait for valid sell setups, especially after the news announcement.
Enjoy!
May profits be upon you.
Leave any questions or comments in the comment section.
I appreciate any feedback from my viewers!
Like and/or subscribe if you want more accurate analysis.
Thank you so much!
Disclaimer:
I do not provide personal investment advice and I am not a qualified licensed investment advisor.
All information found here, including any ideas, opinions, views, predictions, forecasts, commentaries, suggestions, expressed or implied herein, are for informational, entertainment or educational purposes only and should not be construed as personal investment advice. While the information provided is believed to be accurate, it may include errors or inaccuracies.
I will not and cannot be held liable for any actions you take as a result of anything you read here.
Conduct your own due diligence, or consult a licensed financial advisor or broker before making any and all investment decisions. Any investments, trades, speculations, or decisions made on the basis of any information found on this channel, expressed or implied herein, are committed at your own risk, financial or otherwise.
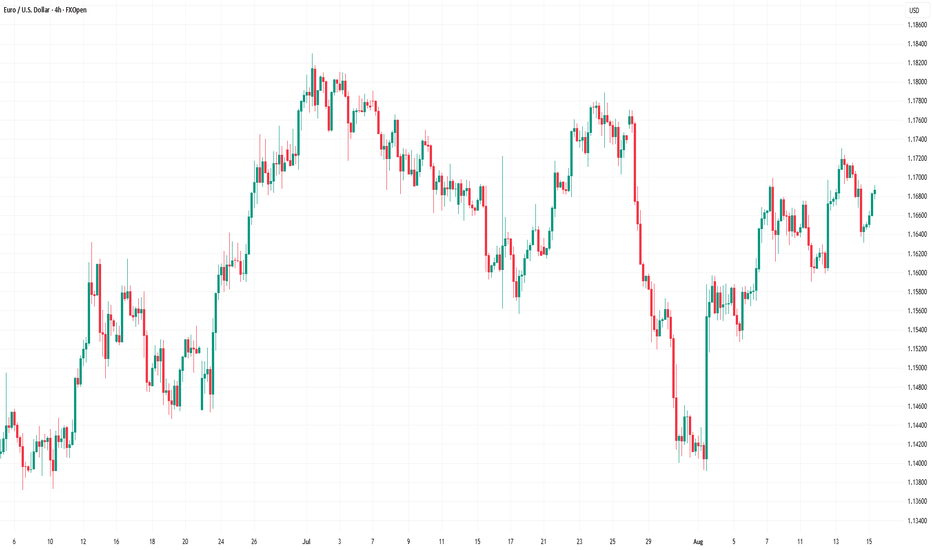
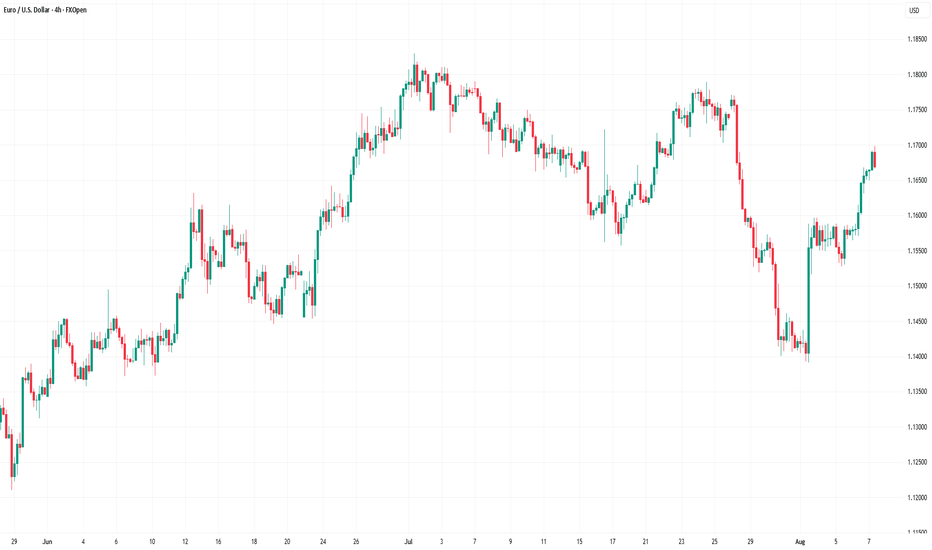
EUR/USD Rises 2.3% Since the Beginning of AugustEUR/USD Rises 2.3% Since the Beginning of August
As the EUR/USD chart shows today, the euro has strengthened against the US dollar, climbing above the 1.1670 level, compared to the 1.1400 area at the beginning of the month.
Why Is EUR/USD Rising?
According to Reuters, the US dollar's weakness is being driven by:
→ Expectations of a Federal Reserve rate cut, which intensified following last week's disappointing US labour market data.
→ Anticipation of the upcoming US inflation report, scheduled for release on 12 August at 15:30 GMT+3.
On the other hand, the euro is being supported by growing optimism around a possible resolution of the military conflict in Ukraine, as well as the potential meeting between Donald Trump and Vladimir Putin.
Technical Analysis of the EUR/USD Chart
On 30 July, we noted that after hitting its July low, EUR/USD could stage a recovery — which indeed materialised. But does the chart now look bullish?
A definitive bullish outlook is hindered by the sequence of lower highs and lower lows (A-B-C-D), which continues to form a bearish market structure.
At the same time, the descending channel on the EUR/USD chart has become more pronounced. After a brief period of consolidation near the channel’s median line (marked with a circle), the price moved up towards the upper boundary of the channel. It is worth noting that a sharp decline occurred recently from these same levels (highlighted with an arrow), breaking through the blue support line.
Given these factors, it is reasonable to assume that bearish activity may intensify around current levels, potentially slowing further EUR/USD growth.
This article represents the opinion of the Companies operating under the FXOpen brand only. It is not to be construed as an offer, solicitation, or recommendation with respect to products and services provided by the Companies operating under the FXOpen brand, nor is it to be considered financial advice.
