EURUSD Drops as Traders Eye U.S. Consumer Confidence DataEURUSD Drops as Traders Eye U.S. Consumer Confidence Data
EURUSD slipped 0.69% to 1.1634, after touching a four-week high of 1.1742 on Friday.
Why the euro had support:
German business climate hit a 15-month high, signaling economic strength and boosting sentiment for eurozone growth.
Improved outlook reduces expectations for ECB rate cuts, making the euro more attractive.
Today’s focus:
U.S. CB Consumer Confidence report.
Strong data → delays Fed cuts → EUR/USD could dip below 1.1600.
Weak data → dollar softens → EUR/USD may climb above 1.1700.
Eurusdtradingview
EUR/USD Holds Firm – Eyeing Pullback Before Next Leg HigherHi Everyone,
Despite what was a fundamentally turbulent week in the markets, our trading delivered a flawless run last week!
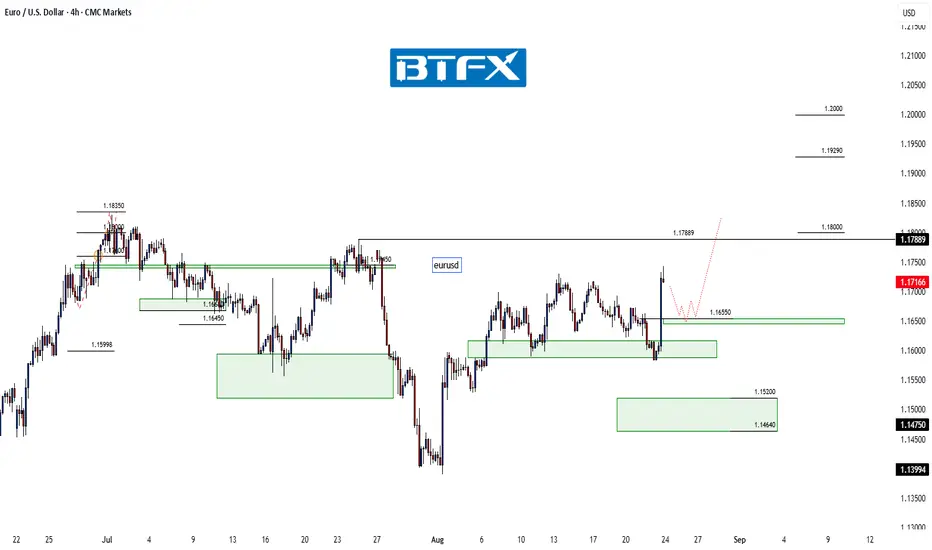
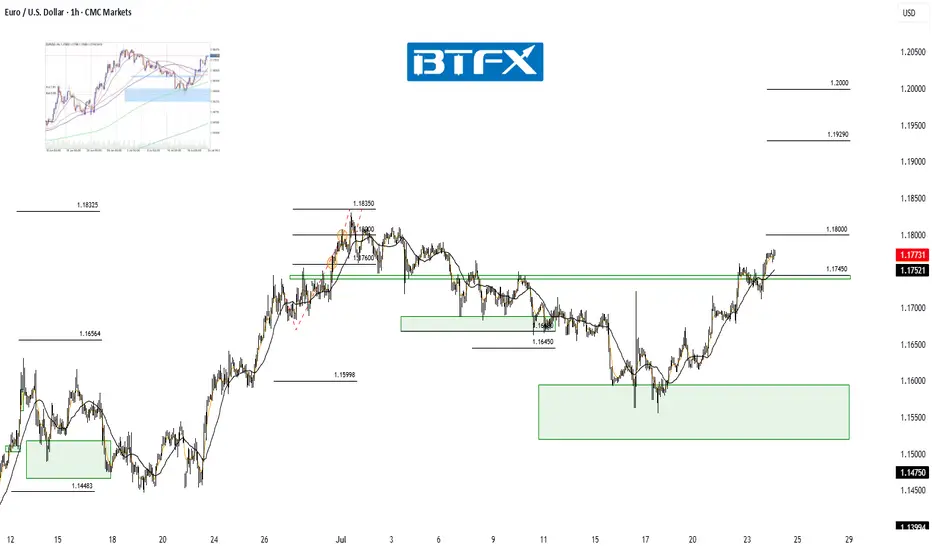
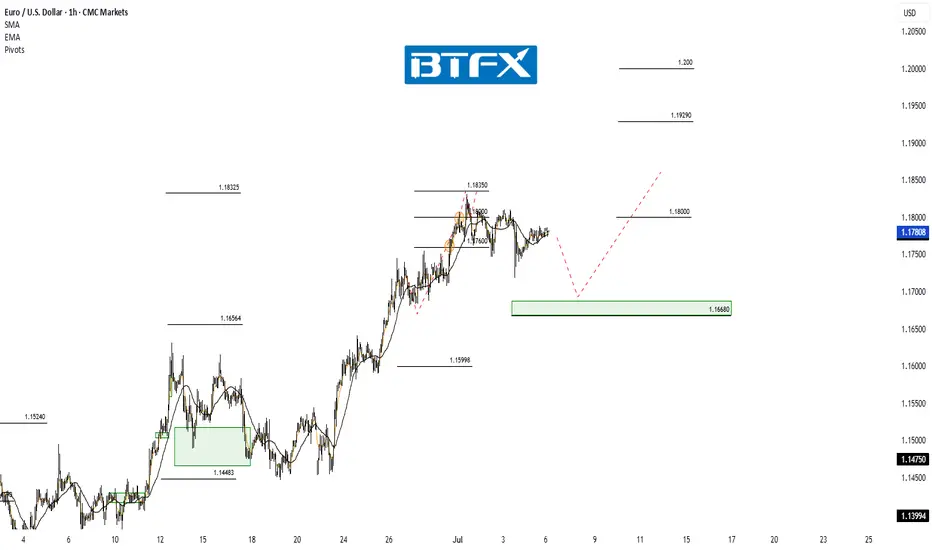
As highlighted in our previous idea, EUR/USD found support near the 1.16000 zone before mounting a push higher toward the 1.17889 level. Looking ahead into next week, we anticipate a pullback toward the 1.16550 area, which could provide the base for another attempt to reach 1.17889.
The impulsive rally from the 1st August low continues to reinforce our bullish outlook on EUR/USD.
Our broader view remains unchanged: we expect the pair to continue building momentum for another leg to the upside. A decisive break above 1.17889 would open the path toward the 1.18350–1.19290 zone, and ultimately the 1.20000 handle.
We’ll be monitoring price action closely to see whether this recovery gains traction and if buyers can sustain momentum through resistance. The longer-term outlook remains bullish, provided price continues to hold above the key support levels.
We’ll keep updating you throughout the week as the structure develops and share how we’re managing our active positions.
Thanks again for all the likes, boosts, comments, and follows — your support is truly appreciated!
All the best for the rest of the week.
Trade safe.
BluetonaFX
EUR/USD Structure Intact — Path Higher Remains in PlayHi Everyone,
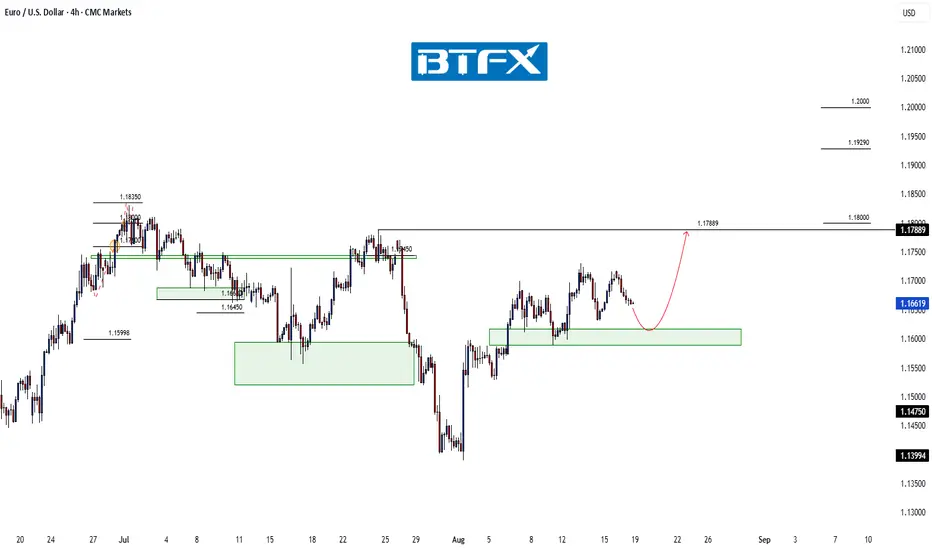
Since the 1st August low, EUR/USD has rallied swiftly back above the 1.16000 level, reclaiming the key 1.16450 zone. If the current consolidation holds above the 1.15888–1.16170 area, this should provide a base for further upside toward 1.17889.
A sustained push into this level in the coming sessions would further confirm renewed buying interest.
Our broader outlook remains unchanged: we continue to expect the pair to build momentum for another leg higher. A decisive break above 1.18350 could open the path toward the 1.19290 area and ultimately the 1.20000 handle.
We’ll be monitoring price action closely to see whether this recovery gains traction and if buyers can maintain momentum through resistance. The longer-term outlook remains bullish, provided price continues to respect the key support zone.
We’ll keep you updated throughout the week as the structure develops and share how we’re managing our active positions.
Thanks again for all the likes, boosts, comments, and follows. We truly appreciate the support!
All the best for the rest of the week.
Trade safe.
BluetonaFX
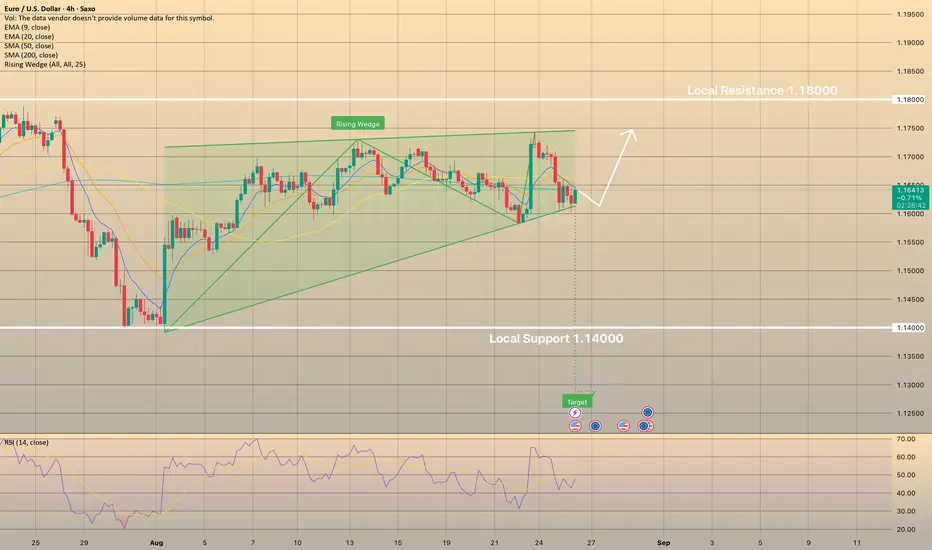
EURUSD retested bearish wedge. Ready to decline?EURUSD retested bearish wedge. Ready to decline?
EURUSD has been trading bullish since the beginning of August after disappointing NFP report data came out. By the end of last week price has come to a lower border of the wedge and SMA200 on 4-h chart, but failed to develop bullish momentum and pulled back from it. The asset shows weakness and further decline towards 1.14000 as a first target is expected. MACD is in the red zone.

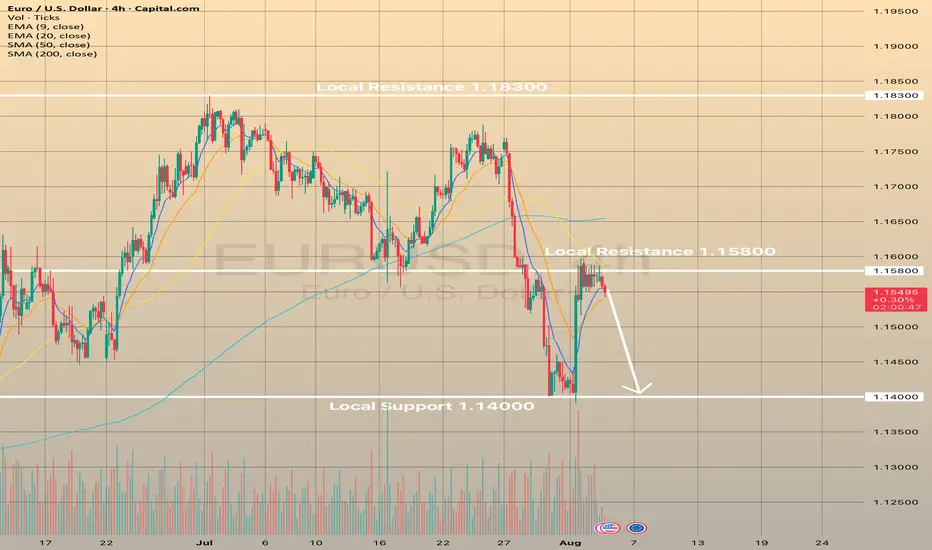
EURUSD fails to develop short-term bullish. Here is whyEURUSD fails to develop short-term bullish. Here is why
On August 1 the market received NFP report data. Numbers were so low that EURUSD has rocketed on 1.22% right immediately after publishing. The probability of a September reduction in interest rates is now estimated at approximately 94%, according to CME Fedwatch, up from 63% last week. Market analysts anticipate at least two quarter-point cuts by the end of the year. The odds increased following the release of disappointing non-farm payrolls data on August 1, which caused a decline in stock markets and led to Trump's reaction, firing the head of the Bureau of Labor Statistics and promising to replace her within a short timeframe.
Still, the pair has failed to develop on August 1 bullish momentum and is currently pulling back from the local resistance of 1.15800. If the price fails to hold the EMA20 on 4-h timeframe, then the decline towards 1.14000 is expected.
EUR/USD Recovery in Play — Eyes on ResistanceHi Everyone,
Since our last update, EUR/USD briefly dipped below the 1.16000 level but quickly reclaimed the key 1.16450 zone — a level that continues to serve as an important structural pivot.
Price has since stabilised above this support and is now moving back toward the highlighted resistance area around 1.17450. A sustained push toward 1.18000 in the coming sessions would further reinforce the presence of renewed buying interest.
Our broader outlook remains unchanged: we continue to anticipate the pair building momentum for another move higher. A decisive break above 1.18350 could open the path toward the 1.19290 area and ultimately the 1.20000 handle.
We’ll be watching closely to see whether this recovery gains traction and if buyers can sustain momentum through resistance. The longer-term view remains bullish, as long as price continues to hold above the key support zone.
We’ll continue to provide updates throughout the week as the structure develops and share how we’re managing our active positions.
Thanks again for all the likes, boosts, comments, and follows — we really appreciate the support!
All the best for the rest of the week.
Trade safe.
BluetonaFX
EUR/USD Holding Support — Watching for Bullish ReactionHi Everyone,
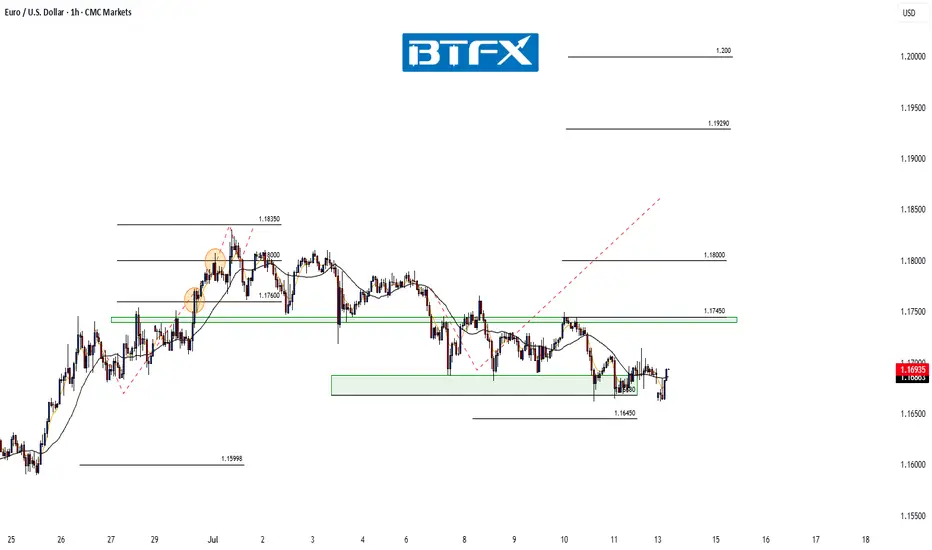
Since our last update, EUR/USD continues to range near the 1.16680 support level. We’re watching for buying interest to emerge above the key 1.16450 zone, which has acted as a critical level for the broader structure.
Should price manage to stabilise and form a base here, there’s potential for a move back towards the highlighted resistance area around 1.17450. A clear reaction from support could confirm renewed buying interest and set the stage for a retest of last week’s highs.
Our broader outlook remains unchanged: as long as price holds above 1.16450, we continue to look for the pair to build momentum for another move higher in the coming sessions. A decisive break above last week’s high could attract fresh buying interest, paving the way for a push towards the 1.19290 area and ultimately 1.20000.
We'll be watching closely to see if this recovery gains traction and whether buyers can sustain the move above resistance. The longer-term view remains bullish, provided price continues to respect the key support zone.
We’ll keep updating you through the week as the structure unfolds and share how we’re managing our active positions.
Thanks again for all the likes/boosts, comments and follows — we really appreciate the support!
All the best for the rest of the week. Trade safe.
BluetonaFX
EUR/USD Testing Support — Will Buyers Step In Again?Hi Everyone,
Since our last update, EUR/USD is currently testing the 1.16680 support level. We’re watching for buying interest to emerge above the key 1.16450 zone; if price can stabilise here, we could see a retest of the highlighted resistance area around 1.17450.
Our broader outlook remains unchanged: as long as price holds above 1.16450, we continue to look for the pair to build momentum for another move higher in the coming sessions. A decisive break above last week’s high could attract fresh buying interest, paving the way for a push towards the 1.19290 area and ultimately 1.20000.
We'll be watching closely to see if this recovery gains traction and whether buyers can sustain the move above resistance. The longer-term view remains bullish, provided price continues to respect the key support zone.
We’ll keep updating you through the week as the structure unfolds and share how we’re managing our active positions.
Thanks again for all the likes/boosts, comments and follows — we really appreciate the support!
All the best for the rest of the week. Trade safe.
BluetonaFX

EUR/USD Holds Above Key Support — Outlook IntactHi Everyone,
Price briefly dipped below the 1.16680 support, but our broader outlook remains unchanged as long as it continues to hold above the key 1.16450 level. Should buyers successfully defend the 1.16450 zone, we still see potential for the pair to stabilise and make another attempt higher in the coming sessions.
We’ll be monitoring price action closely to see if support continues to hold and whether momentum starts to build back to the upside.
We maintain the view that a decisive break above last week’s high could attract additional buyers, paving the way for a move towards the 1.19290 level and ultimately the 1.20000 level.
We’ll share further updates on the projected path for EUR/USD if price breaks above this key resistance.
The longer-term outlook remains bullish, with expectations for the rally to extend towards the 1.2000 level, provided the price holds above the key support at 1.10649.
We will continue to update you throughout the week with how we’re managing our active ideas and positions. Thanks again for all the likes/boosts, comments and follows — we appreciate the support!
All the best for a good end to the week. Trade safe.
BluetonaFX

EUR/USD Update: Breakout Potential Above Recent HighsHi Everyone,
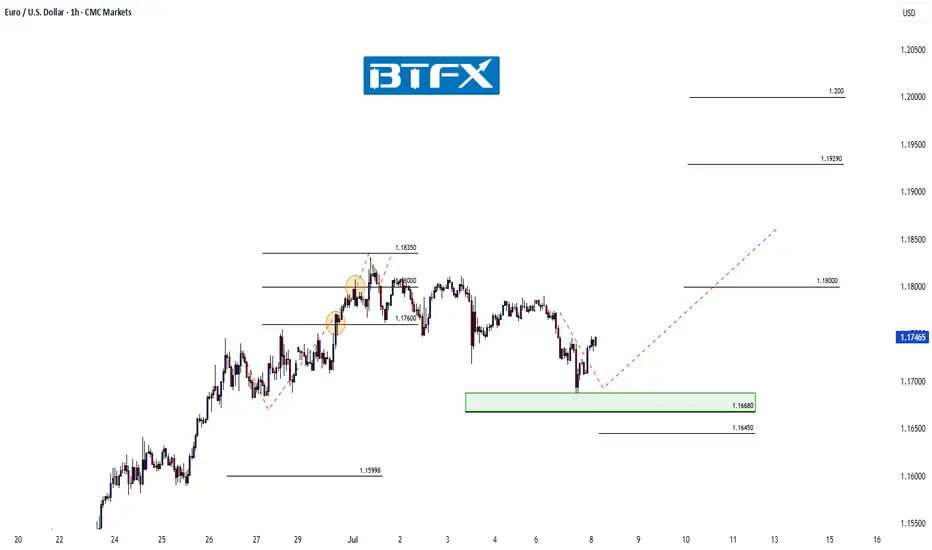
Monday played out as expected; a bounce off the highlighted support area appears to have provided enough momentum for a retest of the 1.18000 level. Price could briefly dip below the 1.16680 support; however, our outlook will remain unchanged as long as we hold above the 1.16450 level.
We maintain the view that a decisive break above last week’s high could attract additional buyers, paving the way for a move towards the 1.19290 level and ultimately the 1.20000 level.
We’ll share further updates on the projected path for EUR/USD if price breaks above this key resistance.
The longer-term outlook remains bullish, with expectations for the rally to extend towards the 1.2000 level, provided the price holds above the key support at 1.10649.
We will continue to update you throughout the week with how we’re managing our active ideas and positions. Thanks again for all the likes/boosts, comments and follows — we appreciate the support!
All the best for a good end to the week. Trade safe.
BluetonaFX
EUR/USD Analysis: US Dollar Strengthens at the Start of the WeekEUR/USD Analysis: US Dollar Strengthens at the Start of the Week
On 2 July, on the EUR/USD chart, we noted that the rally—during which the pair had gained more than 6% since mid-May—was under threat, citing several technical signals, including:
→ proximity of the price to the upper boundary of the ascending channel;
→ overbought conditions on the RSI indicator;
→ nearby resistance from the Fibonacci Extension levels, around 1.18500.
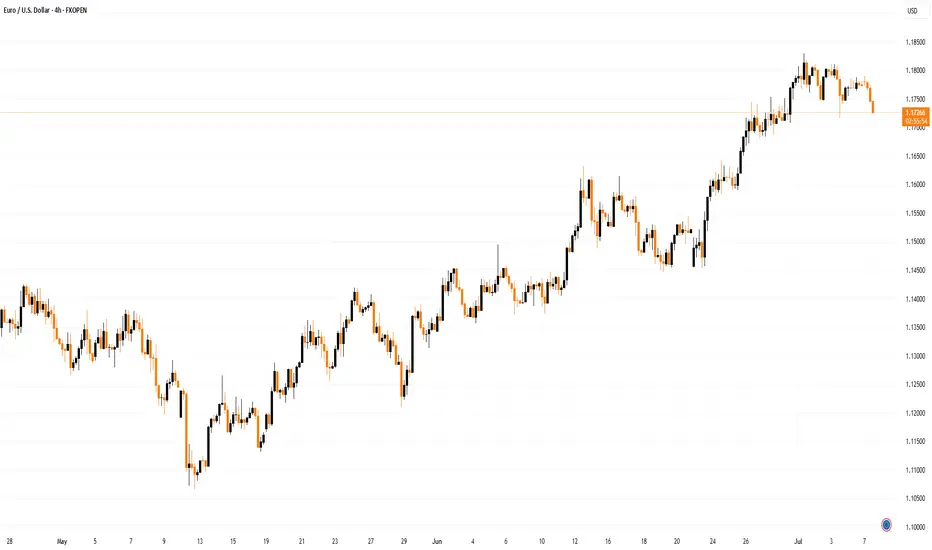
Trading at the start of the week points to renewed US dollar strength. This became particularly evident with the opening of the European session, which triggered a decline in EUR/USD to the 1.17500 area.
It is reasonable to assume that the dollar’s strength against the euro is linked to early-week positioning by traders, who are anticipating news regarding US trade agreements.
According to Reuters, the United States is close to finalising several trade deals in the coming days and is expected to notify 12 other countries today about higher tariffs.
EUR/USD Technical Chart Analysis
The ascending channel established last week remains in play, with the following developments:
→ a dashed midline within the upper half of the channel has been breached by bearish pressure (as indicated by the arrow);
→ a series of lower highs in recent sessions suggests the formation of a downward trajectory, within which the price could move towards the channel median—or potentially test its lower boundary.
P.S. In the longer term, analysts at Morgan Stanley maintain a bullish outlook, forecasting that EUR/USD could rise to 1.2700 by the end of 2027.
This article represents the opinion of the Companies operating under the FXOpen brand only. It is not to be construed as an offer, solicitation, or recommendation with respect to products and services provided by the Companies operating under the FXOpen brand, nor is it to be considered financial advice.
EUR/USD Rally Pauses Near 1.18000 – Higher Targets in SightHi Everyone,
Last week, price action delivered the 1.18000 level we had been calling for, and as expected, dynamic resistance around that area proved to be significant.
Looking ahead, we anticipate EUR/USD will continue to test the 1.18000 level this week while holding above the 1.16680 support zone. A strong break above last week’s high could attract further buyers, paving the way for a move towards the 1.19290 and ultimately the 1.20000 levels. We’ll share further updates on the projected path for EUR/USD if price breaks above this level.
The longer-term outlook remains bullish, with expectations for the rally to extend towards the 1.2000 level, provided the price holds above the key support at 1.10649.
We will continue to update you throughout the week with how we’re managing our active ideas and positions. Thanks again for all the likes/boosts, comments and follows — we appreciate the support!
All the best for a good end to the week. Trade safe.
BluetonaFX
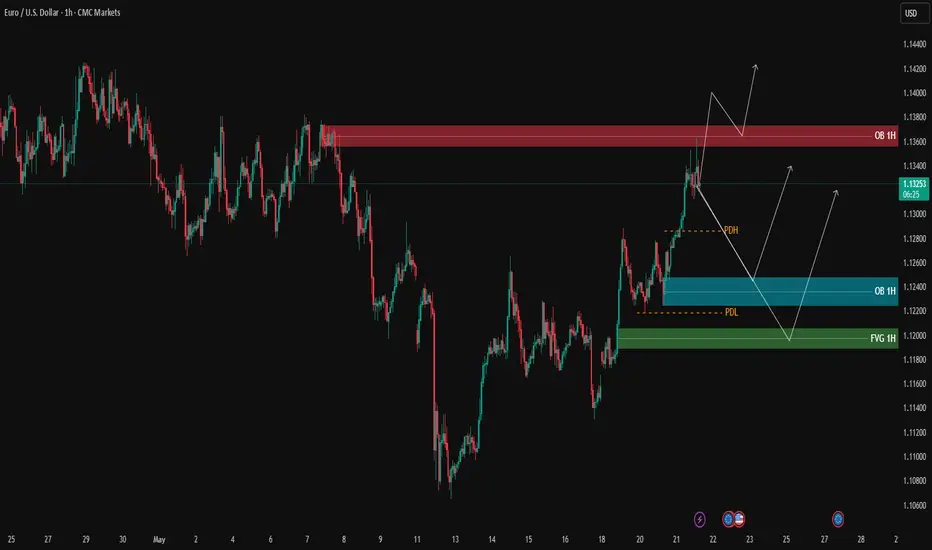
EURUSD – Testing 1H Supply Zone, Awaiting Confirmation | ProfitaAfter a strong bullish rally breaking previous highs, EURUSD is now reacting to the 1H supply zone (OB 1H) marked in red.
We’re seeing an initial bearish rejection from this zone. If sellers maintain control, price may retrace toward the lower demand areas:
Blue OB 1H zone (1.12200 – 1.12450)
Green FVG 1H further below
However, if buyers manage to push price above the red OB and close a candle above it, continuation to the upside remains a valid scenario.
📌 Key Levels
🟢 Support Zones:
1.12200 – 1.12450
1.11780 – 1.12000
🔴 Resistance:
1.13500 – 1.13800
⚠️ Note:
Watch for lower-timeframe (M5/M3) confirmations for entry. Only act on clear setups inside the zones.
🔍 Insight by ProfitaminFX
EURUSD: holds gains above 1.1500EUR/USD is finding support at the start of the week, holding above 1.1300 in European trading. A weaker US Dollar, fueled by renewed trade worries and pre-Fed positioning, is boosting the pair ahead of the US ISM Services PMI release.
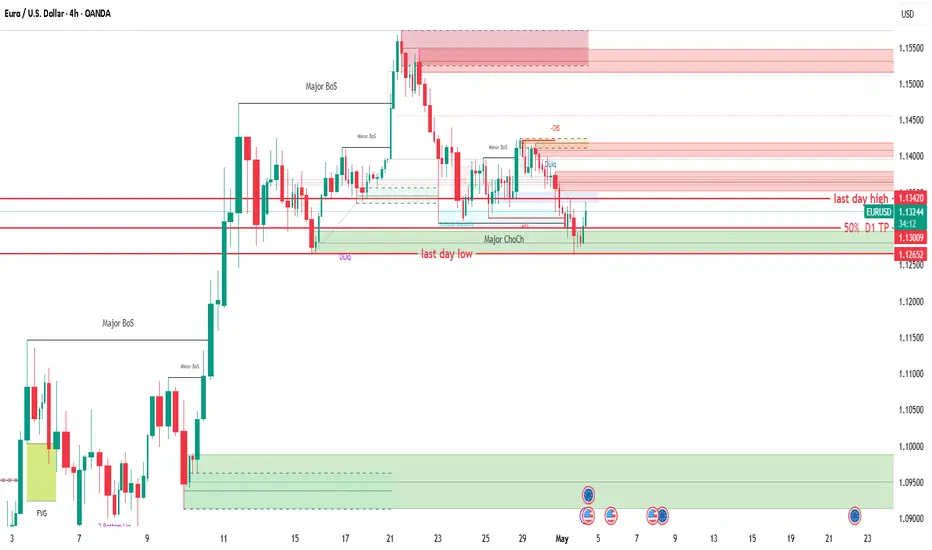
This is a 4H chart of EUR/USD with multiple SMC annotations.1. Chart Reading According to SMC
Structure Analysis:
• Major BOS: Confirmed bullish structure around April 10 after the rally from FVG.
• Minor BOS & OBs: Price formed lower highs and lower lows near the 1.1450–1.1500 zone.
• Major CHoCH (Change of Character): Marked clearly around the last day low, confirming shift
to bearish structure.
• Liquidity Sweeps: Price swept the daily low and reacted — indicating smart money
accumulation at a key level.
Key SMC Zones:
• OB (Bearish): 1.1380–1.1430 zone — price likely to reject here.
• OB (Bullish): ~1.1265–1.1300 (reacted twice).
• FVG: Older demand imbalance marked earlier in the rally (around 1.0940–1.1000).
⸻
2. Marked Points in Chart
• Major BoS / CHoCH: Structural shifts defining directional bias.
• D1 TP (1.1300): A take-profit level around the midpoint of a larger daily leg.
• Last Day High / Low: Defined for internal liquidity targeting.
• OBs & Liquidity Zones: Precisely mapped for institutional activity clues.
⸻
3. Swing High & Low of the Day
• Swing High: 1.13420 (Last day high zone).
• Swing Low: 1.12652 (Last day low, also tapped for liquidity sweep).
These are intraday reference points for short-term setups.
⸻
4. Trade Direction
• Current HTF Bias: Bearish (post major CHoCH & OB rejections).
• However, price is currently reacting from a demand zone near 1.1265.
• Short-Term Direction: Bullish retracement toward 1.1340–1.1380, possibly to mitigate OB or
FVG.
⸻
5. Best Risk-Reward Setup
Setup: Buy the retracement from demand (reactive long) .
• Entry: 1.1270–1.1285 (OB demand + liquidity sweep)
• SL: Below 1.1260
• TP1: 1.1340 (last day high)
• TP2: 1.1380 (upper OB/fill FVG)
• RRR:
• TP1: ~1:3
• TP2: ~1:5
OR
Setup: Wait for price to reach OB at 1.1380, then go short.
• Entry: 1.1380–1.1400
• SL: 1.1430 (above OB)
• TP1: 1.1300 (internal structure)
• TP2: 1.1265 (retest demand)
• RRR: ~1:4
⸻
6. Trade Setups for Multiple Timeframes
5-Minute Setup (Refined Entry within OB):
• Look for CHoCH or internal FVG near 1.1270–1.1285 (bullish confirmation).
• Entry after candle body closes above last bearish candle.
• SL: Below 1.1260
• TP: 1.1340 (intraday high).
1H Setup:
• Wait for price to retrace and form FVG or CHoCH inside 1.1265–1.1280.
• Enter long on bullish engulfing/OB mitigation.
• TP: 1.1340–1.1380
• SL: Below OB.
4H Setup:
• Trend is bearish, but bullish pullback expected.
• Either take the long into OB or wait to short at 1.1380.
⸻
7. CRT Model Evaluation
• C – Context: Market just made a major CHoCH, but reacted from a demand OB with a liquidity
sweep.
• R – Retracement: Price is retracing into premium zones — near 50% of the daily range.
• T – Trend Continuation: Expect bearish continuation from the 1.1380 zone, unless price breaks
structure.
⸻
Conclusion
• Short-Term Bias: Bullish retracement toward 1.1340–1.1380.
• Swing Bias: Bearish from OB rejections and structural breaks.
• Best Setup Now: Long from 1.1270–1.1280 → TP 1.1340–1.1380.
• Later Opportunity: Short from 1.1380 → TP back toward 1.1265.
EUR/USD remains capped below 1.1400, bullish bias prevailsEUR/USD's near-term outlook is neutral. The pair oscillates below a flat 20 SMA, while longer-term (100/200) SMAs maintain upward slopes. Momentum is flat around 100, and the RSI is only slightly higher near 45, suggesting limited upward potential.

EURUSD: ShortThis is a relatively standard double top pattern. The possibility of a decline after a small rebound is higher, so shorting is recommended.

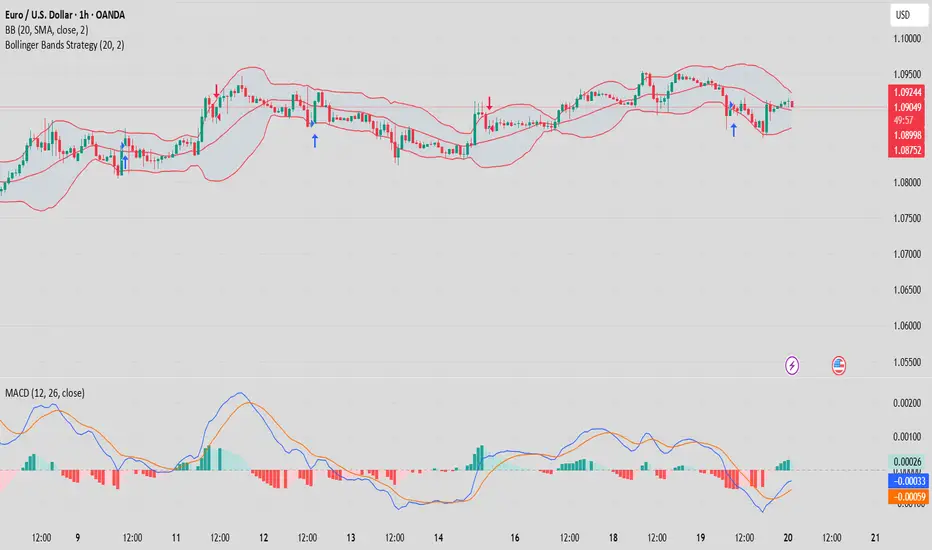
EURUSD(20250320) Today's AnalysisToday's buying and selling boundaries: 1.0903
Support and resistance levels:
1.0988
1.0956
1.0935
1.0871
1.0850
1.0819
Trading strategy:
If the price breaks through 1.0935, consider going long, with the first target price at 1.0956
If the price breaks through 1.0903, consider going short, with the first target price at 1.0871
EURUSD BUY/LONGeurusd breakout
take long on eurusd
hello traders trend is up trend and now price breakout a resistance level so ling is logical
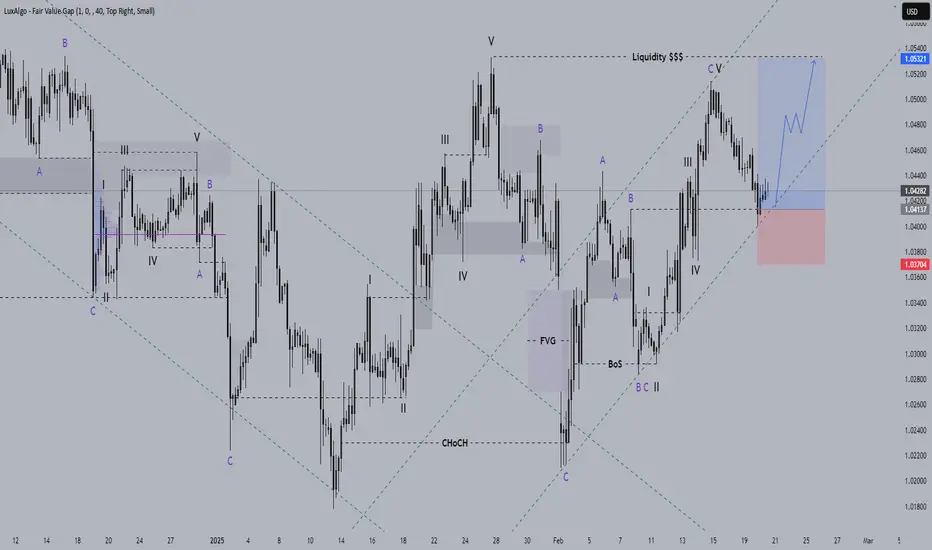
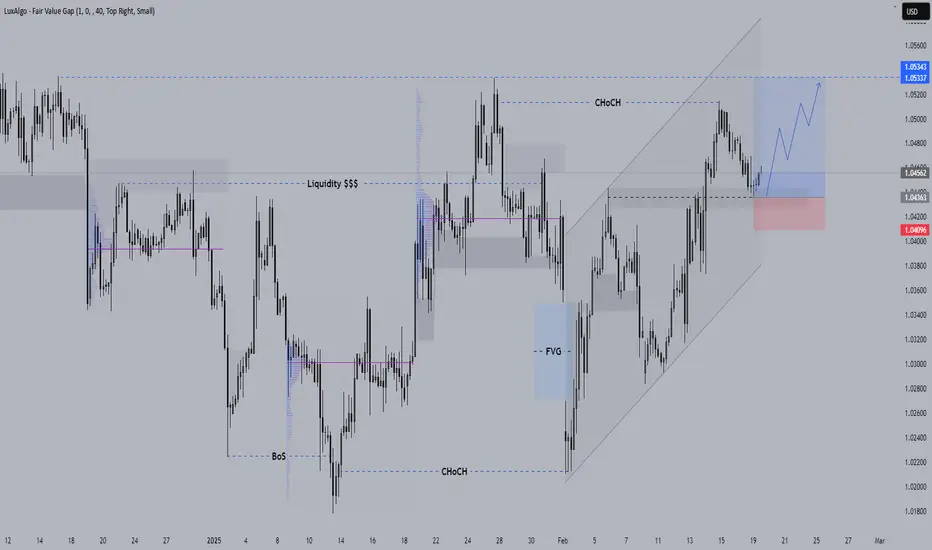
EURUSD: holds steady above 1.0400 amid US tariff threatsEUR/USD holds steady above 1.0450 in the European trading hours on Thursday. Broad US Dollar underperformance supports the pair. However, tariff threats from US President Donald Trump and geopolitical tension might cap its upside. US data and Fedspeak remains in focus.
EUR/USD Technical Overview
Technically, the bullish outlook of EUR/USD remains intact as the major pair holds above the key 100-period Exponential Moving Averages (EMA) on the 4-hour chart. However, the Relative Strength Index (RSI) is located below the midline, near 42.85, suggesting that further downside cannot be ruled out.
The first upside barrier for EUR/USD emerges near 1.0461, the high of February 19. The key resistance level to watch is the 1.0500-1.0505 zone, representing the psychological level and the upper boundary of the Bollinger Band. A decisive break above this level will see a rally to 1.0533, the high of January 27.
EURUSD: holds positive ground near 1.0450The EUR/USD pair posts modest gains to around 1.0450 during the Asian trading hours on Wednesday, bolstered by the weakening of the US Dollar. However, tariff concerns and tense Russia-Ukraine negotiations might boost the Greenback and cap the upside for the major pair.
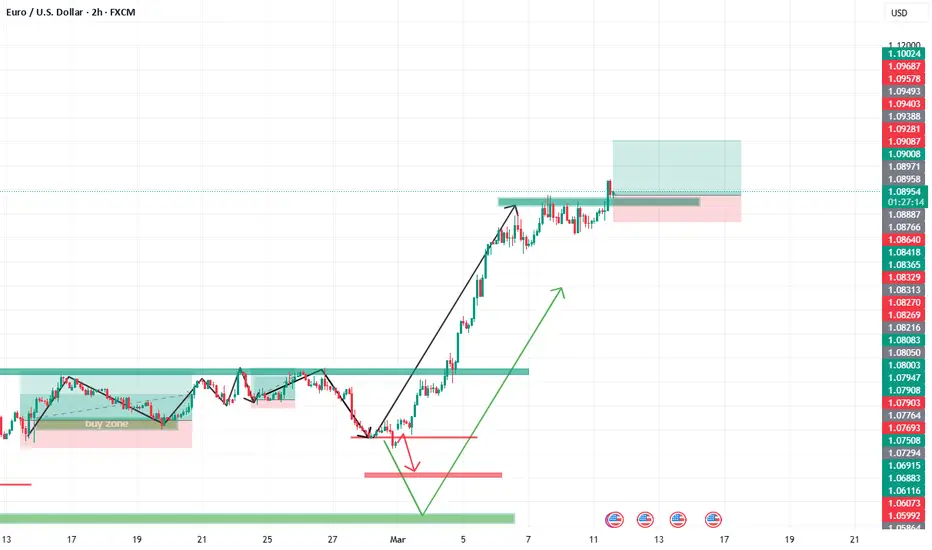
EURUSD Top-down analysis Hello traders, this is a complete multiple timeframe analysis of this pair. We see could find significant trading opportunities as per analysis upon price action confirmation we may take this trade. Smash the like button if you find value in this analysis and drop a comment if you have any questions or let me know which pair to cover in my next analysis.

Major Breakdown or Reversal? EUR/USD 2-Week AnalysisEUR/USD analysis on the 2-week timeframe (14 days), the chart clearly shows that the price has faced multiple rejections from the upper resistance line, marked in red. Additionally, the price has broken below the strong 2-week support zone and is now trading just above the lower supportive trendline, indicated by the green line.
The Stochastic RSI is signaling a potential reversal, suggesting that the current price action may retest the breakout levels before making a decisive move. This could either lead to a rebound from the support or further bearish continuation if the trendline breaks.
