EURUSD FORMED BEARISH PENNANT. THE PRICE IS READY TO DROP.EURUSD FORMED BEARISH PENNANT. THE PRICE IS READY TO DROP.
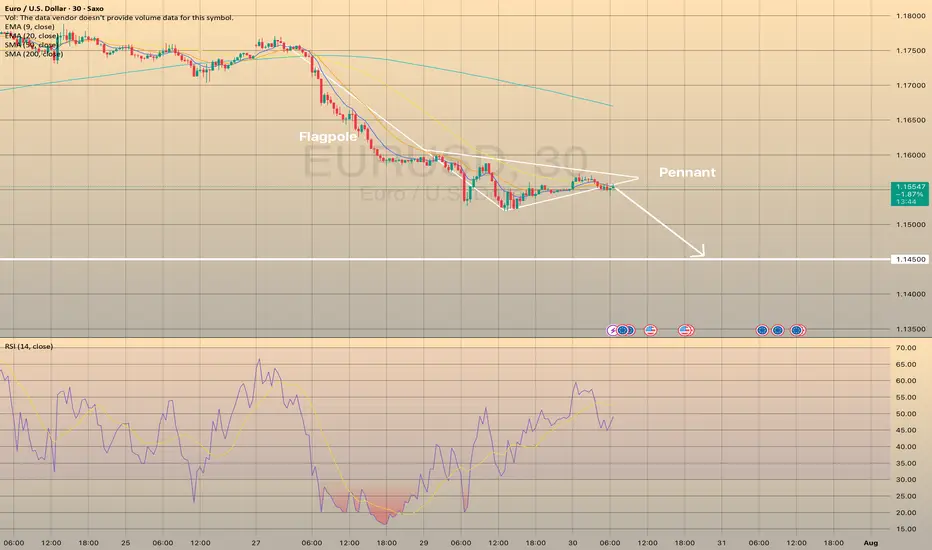
EURUSD has been trading sideways within the last day, showing lower highs and higher lows. Eventually, the price has formed the pennant chart pattern.
What is a pennant?
A pennant chart pattern is a short-term continuation pattern in technical analysis, resembling a small symmetrical triangle, formed after a strong price movement (flagpole). It consists of converging trendlines, indicating a brief consolidation before the trend resumes. Bullish pennants form after an uptrend, bearish pennants after a downtrend.
The price is expected to decline towards 1.14500 support level
Eurusdtrendanalysis
EURUSD REACHED THE TARGET.EURUSD REACHED THE TARGET.
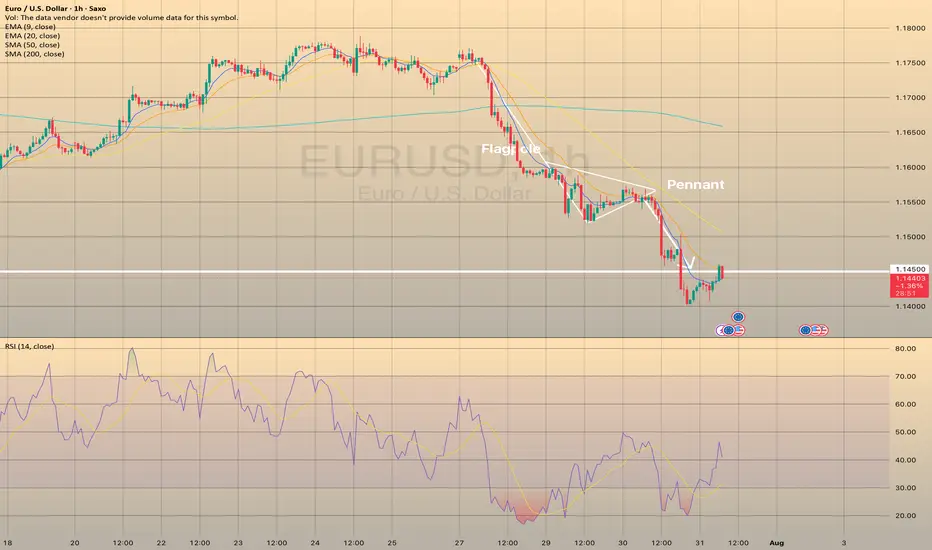
EURUSD has reached the 1.14500 level and even broke it down. Currently the price consolidates slightly below this level. If the price forms a false breakout of 1.14500 level, this will mean the end of short-term decline in the pair. Stay cautious.
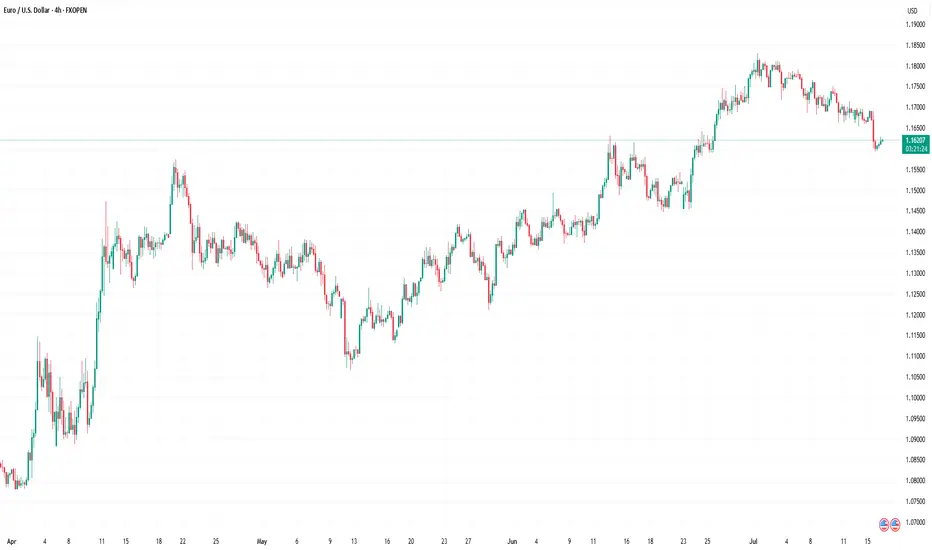
EUR/USD Hits Lowest Level Since Early JulyEUR/USD Hits Lowest Level Since Early July
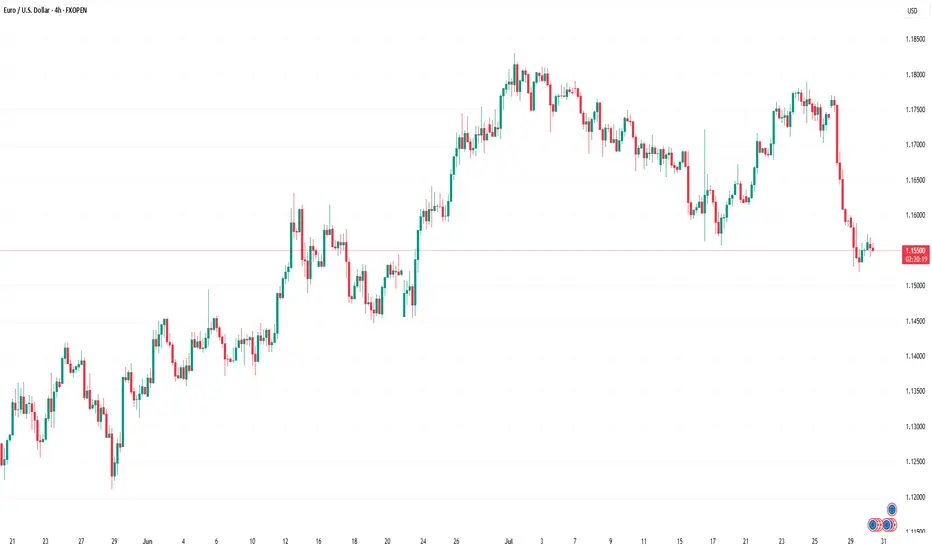
As the EUR/USD chart indicates today, the euro has fallen below the 1.1550 mark against the US dollar, reaching the lows of June 2025. As a result, July may become the first month in 2025 to record a decline in the currency pair.
Why Is EUR/USD Declining?
There are two key factors driving the euro’s weakness relative to the US dollar:
→ Anticipation of the Federal Reserve Meeting. At 21:00 GMT+3 today, the Fed’s interest rate decision will be released. According to Forex Factory, analysts expect the Federal Funds Rate to remain unchanged at 4.25%-4.50%.
→ Market Reaction to the US-EU Trade Agreement. The trade deal signed last weekend between the United States and Europe is being critically assessed by market participants.
As noted in our Monday analysis, signs of a bearish takeover emerged on the chart following the agreement’s signing. Since then, EUR/USD has declined by approximately 1.3%. The question now is whether the downtrend will continue.
Technical Analysis of the EUR/USD Chart
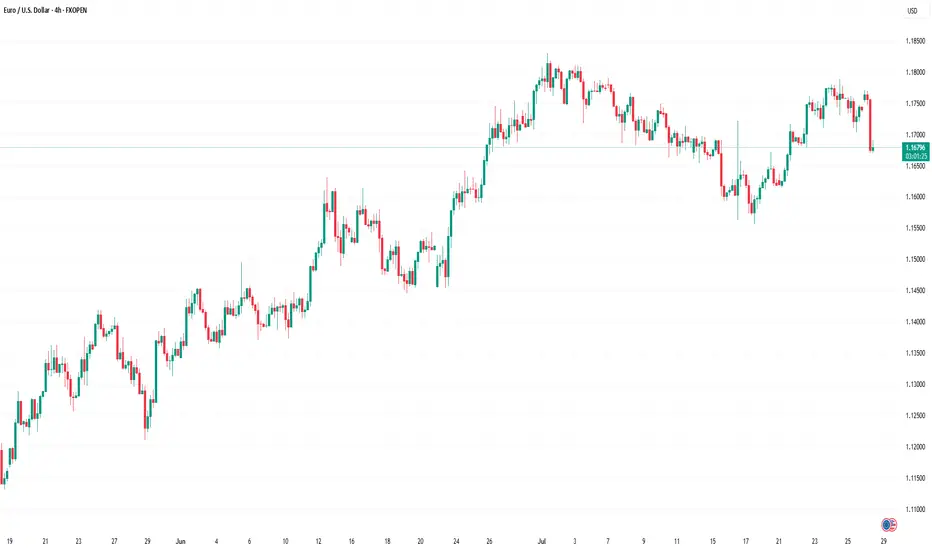
The upward channel that had remained valid since mid-May was decisively broken by bears this week. The nature of the breakout (highlighted by the red arrow) was particularly aggressive, with the price dropping from the 1.1710 level to the D point low without any meaningful interim recoveries.
Key observations include:
→ The drop has resulted in a classic bearish A-B-C-D market structure, characterised by lower highs and lower lows.
→ On the 4-hour timeframe, the RSI indicator has fallen into oversold territory, reaching its lowest point of 2025 so far.
→ Notably (as highlighted by the blue arrow), there was a strong rebound from the 1.1455 support level earlier. Bulls demonstrated significant strength at that time, breaking through the R resistance line.
Given these factors, we could assume that after this week’s sharp decline, EUR/USD may attempt a short-term recovery from the support zone (highlighted in purple). Should this scenario unfold, potential resistance may emerge near the 1.1630 level, as this area aligns with:
→ The 50% Fibonacci retracement of the C→D decline;
→ The breakout point of the lower boundary of the previous ascending channel, indicating a shift in market balance in favour of the bears.
This article represents the opinion of the Companies operating under the FXOpen brand only. It is not to be construed as an offer, solicitation, or recommendation with respect to products and services provided by the Companies operating under the FXOpen brand, nor is it to be considered financial advice.
Market Analysis: EUR/USD Dips FurtherMarket Analysis: EUR/USD Dips Further
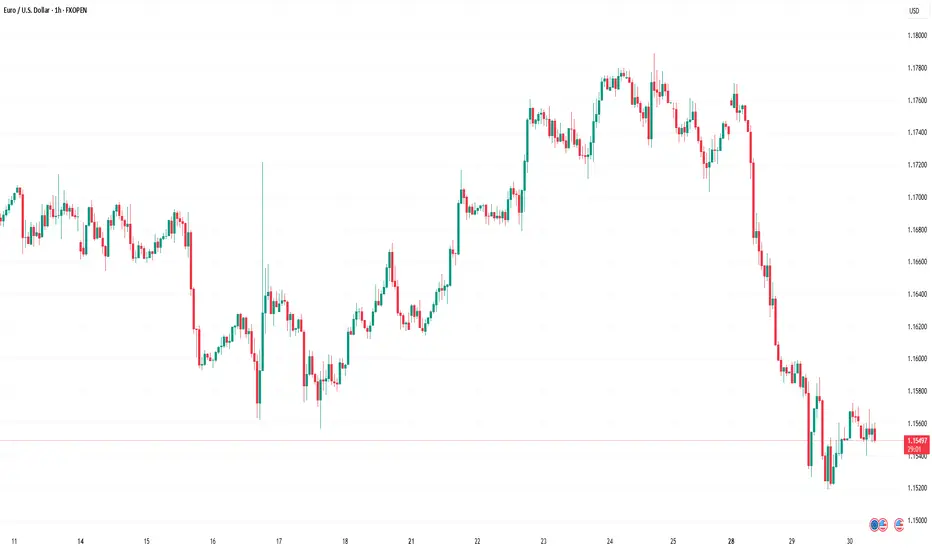
EUR/USD extended losses and traded below the 1.1600 support.
Important Takeaways for EUR/USD Analysis Today
- The Euro struggled to clear the 1.1800 resistance and declined against the US Dollar.
- There is a key downward channel forming with resistance at 1.1575 on the hourly chart of EUR/USD.
EUR/USD Technical Analysis
On the hourly chart of EUR/USD at FXOpen, the pair failed to clear the 1.1800 resistance. The Euro started a fresh decline below the 1.1720 support against the US Dollar.
The pair declined below the 1.1660 support and the 50-hour simple moving average. Finally, it tested the 1.1520 level. A low was formed at 1.1519 and the pair is now consolidating losses. The market is showing bearish signs, and the upsides might remain capped.
There was a minor increase toward the 23.6% Fib retracement level of the downward move from the 1.1770 swing high to the 1.1519 low. Immediate resistance on the upside is near the 1.1575 level.
There is also a key downward channel forming with resistance at 1.1575. The next major resistance is near the 1.1665 zone and the 50-hour simple moving average or the 50% Fib retracement level.
The main resistance sits near the 1.1770 level. An upside break above the 1.1770 level might send the pair towards 1.1800. Any more gains might open the doors for a move towards 1.1850.
On the downside, immediate support on the EUR/USD chart is seen near 1.1520. The next major support is near the 1.1465 level. A downside break below 1.1465 could send the pair towards 1.1350.
This article represents the opinion of the Companies operating under the FXOpen brand only. It is not to be construed as an offer, solicitation, or recommendation with respect to products and services provided by the Companies operating under the FXOpen brand, nor is it to be considered financial advice.
EURUSD - STRONGEST DECLINE FOR THE LAST COUPLE OF MONTHSEURUSD - STRONGEST DECLINE FOR THE LAST COUPLE OF MONTHS
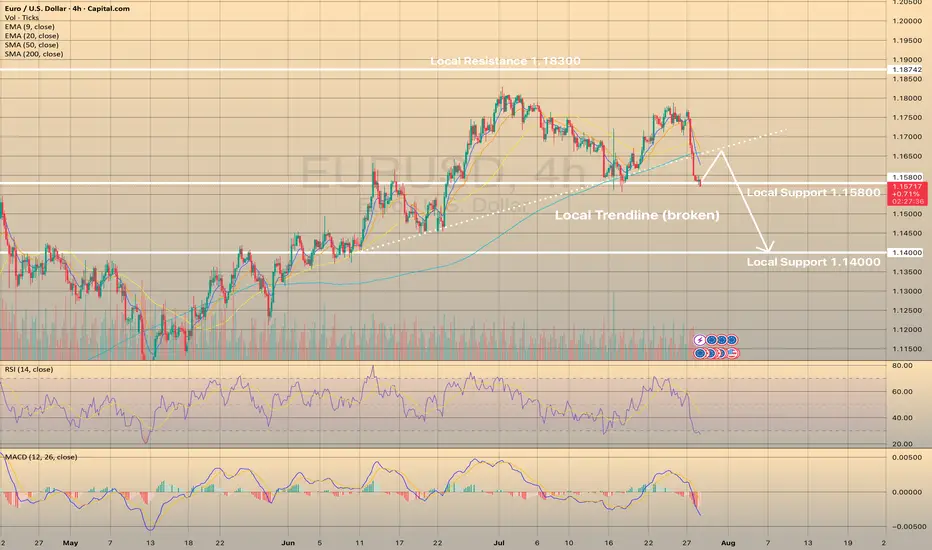
EURUSD has lost 1.32% yesterday on the U.S. - E.U. trade deal. Experts suggest that the relief felt by the United States and the European Union upon reaching a trade agreement has been overshadowed by worries about the potential economic harm caused by a 15% tariff on EU imports. The dollar has recently experienced a positive trend, and this trend could continue if U.S. economic data, including Friday's employment figures, indicates a strong economy. The investors who had previously made substantial bets on the euro's appreciation are now reversing their positions, causing the euro to weaken.
Technically, the asset broke down the local trendline and is currently trying to rebound from the local support level of 1.15800. RSI tells us that the asset is oversold, so the most possible outcome here is the EURUSD to rebound from current level, retest former trendline and continues downwards movement.
EUR/USD Robbery Blueprint Bear Strike Activated!💣🎯Operation Fiber Down: EUR/USD Robbery Blueprint (Day Trade Edition) 💰🔫
🚨 Thieves, Hustlers & Chart Bandits Assemble! 🚨
🌍 Hi! Hola! Ola! Bonjour! Hallo! Marhaba! 🌍
Welcome back to another Thief Trading Operation, where the money never sleeps—and neither do we. Let’s break into the vault of EUR/USD “The Fiber” with surgical precision. 🧠💼🕶️
🧨 THE MASTER ROBBERY PLAN: EUR/USD SHORT STRIKE 🔍💸
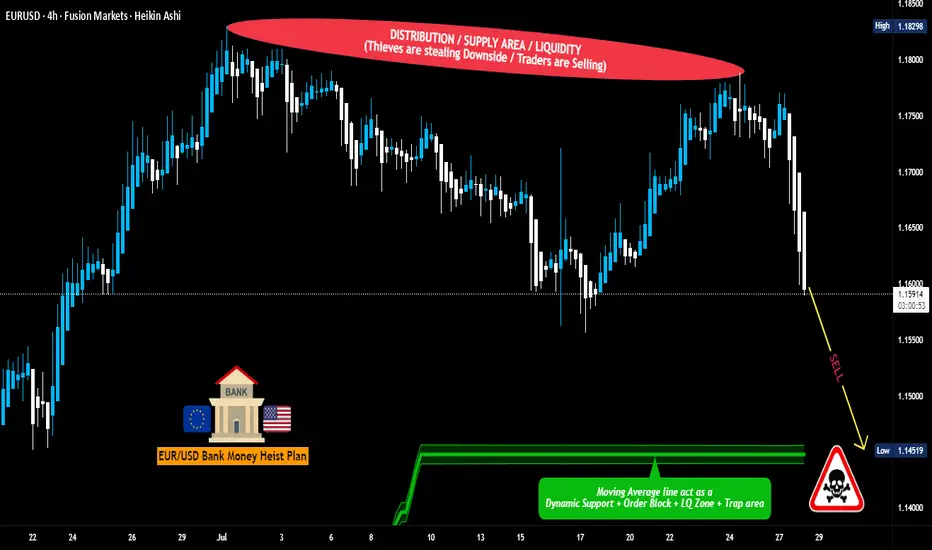
💀 Market Bias: Bearish – Trend Reversal + Supply Trap Setup
🎯 Target: 1.14600
🛑 Stop-Loss: Near Swing High (around 1.16700 – 4H chart view)
🕓 Timeframe Focus: 15m / 30m / 3H
🧭 ENTRY ZONE:
👣 Plan your entry from recent high retests—that’s where the big money bulls get trapped.
🎯 Use Sell Limit Orders (DCA style / Layered Limit Orders) like a true thief setting up tripwires.
💼 RISK STRATEGY:
💡 SL should match your lot size and order count—not one-size-fits-all!
📌 Place above key structure or swing level (e.g. 1.16700) based on timeframe.
🔍 BEHIND THE SCENES – THE WHY:
The EUR/USD "Fiber" pair is showing all the classic signs of a trend shift and bear raid setup, including:
📰 Fundamentals weakening the Euro
💣 COT Report reveals institutional exits
🍂 Seasonal Bias points to downward trend
📉 Intermarket Pressure from bond yields & USD strength
📊 Sentiment turning overly bullish = trap zone
⛽ Storage & Inventory imbalances adding fuel
📌 Reminder: Before any robbery, study the layout—Macro, Fundamentals, Sentiment, and Intermarket are your blueprint.
🚨 HEIST ALERT – PROTECT THE LOOT:
🕰️ High-Impact News Events? Tighten up!
💼 Don’t take fresh entries during releases.
🔐 Use Trailing SLs to lock in profits.
🎯 Exit with grace before the sirens start.
⚡🔥JOIN THE CREW, BOOST THE LOOT🔥⚡
💥 Smash the Boost Button 💥 if you're vibing with the Thief Trading Movement.
We ain’t just trading—we’re executing strategic robberies on the market’s weaknesses.
🧠💪 Every like = more power to the crew. Every comment = a new map to a vault.
We rob, retreat, and repeat. Let’s make money with skill, not luck. 🕶️💰🚁
⚠️ LEGAL COVER (For the Lawyers 😏):
This plan is not investment advice, just an organized heist blueprint by chart robbers.
Always manage your own risk and update your plan as the market evolves.
🕶️ Stay ready for the next master plan... Until then, keep your charts clean and your stops tight. 🕶️💣📉
– Thief Trader Out 🐱👤🚀
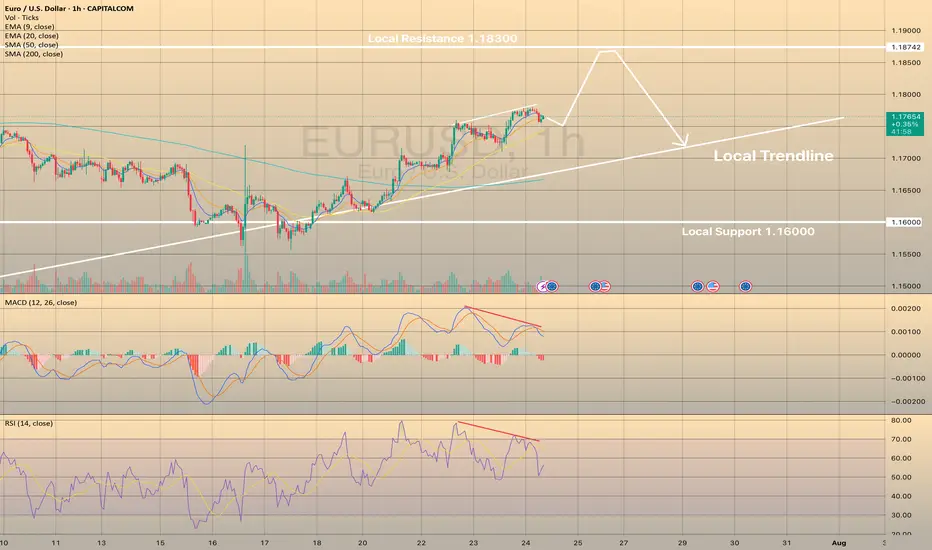
EURUSD LOSSES BULLISH MOMENTUM. WHERE TO GO?EURUSD LOSSES BULLISH MOMENTUM. WHERE TO GO?
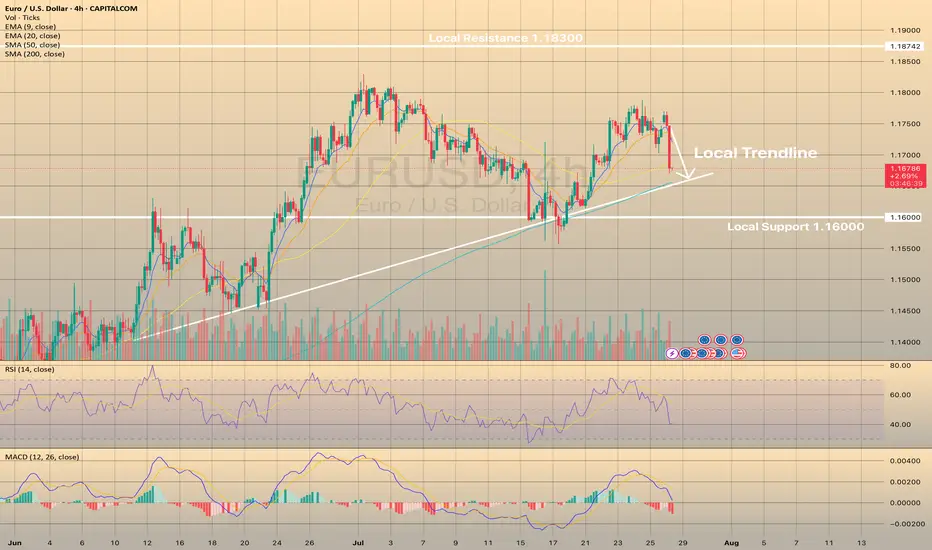
The asset didn't reach the local resistance of 1.18300 and started to consolidate before reaching this level. RSI shows weakness of the impulse on 4-h chart, as well as MACD is in the red zone. Therefore, we expect the price to slowly decline towards local trendline, where SMA200 is situated.
Europe and the US Sign Trade Agreement, EUR/USD DeclinesEurope and the US Sign Trade Agreement, EUR/USD Declines
The past weekend was marked by the official signing of a trade agreement between the United States and Europe, as announced by US President Donald Trump and President of the European Commission Ursula von der Leyen following their meeting in Scotland.
According to reports, the agreement is based on a 15% baseline tariff on goods exported from Europe to the United States, with certain exemptions. As previously reported, a trade agreement with a 15% baseline tariff had earlier been concluded between the US and Japan.
According to President Trump:
→ under no circumstances did he allow the baseline tariff for Europe to fall below 15%;
→ the European Union committed to investing in the US economy, purchasing weapons, and importing energy resources.
The financial markets’ reaction to this news is noteworthy:
→ European stock indices opened the week with a bullish gap, reflecting relief that previously feared tariffs of up to 30% did not materialise;
→ the EUR/USD pair is exhibiting bearish momentum this morning.
Technical Analysis of the EUR/USD Chart
As indicated by the black arrow, bearish sentiment intensified on Monday morning, pushing the pair towards the 1.1700 level, which had previously acted as resistance in mid-July.
From the perspective of the ascending channel (shown in blue), its median line is currently acting as a resistance level – following contact with it, a short-term rally was broken (highlighted in purple). This reinforces the notion that bears are currently in control.
Given the above, we could suggest that, should bearish sentiment persist on the EUR/USD chart, we may soon witness an attempt to break through the 1.1700 support level. A successful breach could open the path for further downside movement of the euro against the dollar, towards the lower boundary of the channel.
This article represents the opinion of the Companies operating under the FXOpen brand only. It is not to be construed as an offer, solicitation, or recommendation with respect to products and services provided by the Companies operating under the FXOpen brand, nor is it to be considered financial advice.
ECB Interest Rate Decision: What to Expect and How Could React📊 ECB Interest Rate Decision: What to Expect and How EURUSD Could React
This week’s spotlight is on the European Central Bank (ECB) Interest Rate Decision — a key market driver that could shape the near-term direction of the euro and broader European markets. Here's what to expect. 👇
🔔 Key Event to Watch
📅 ECB Interest Rate Decision
🕐 Date: July 24
⏰ Time: 12:15 p.m. UTC
📉 Forecast: Hold at 2.15%
📌 Economic Context
The European Central Bank is expected to hold interest rates steady on Thursday, likely marking the end of its current easing cycle after eight consecutive cuts that brought borrowing costs to their lowest levels since November 2022.
🔒 Main refinancing rate: 2.15%
💰 Deposit facility rate: 2.00%
Policymakers are likely to adopt a wait-and-see approach as they monitor the impact of persistent trade uncertaintyand potential U.S. tariffs on economic growth and inflation.
Adding to the cautious stance, inflation finally reached the ECB’s 2% target in June, and is now forecast to dip belowthat level later this year. This drop is expected to be sustained over the next 18 months, driven by:
A strong euro 💶
Falling energy prices 🛢️
Cheaper imports from China 🇨🇳
Markets are currently pricing in just one more rate cut by December, with around a 50% probability of that happening in September, before a possible tightening cycle resumes in late 2026.
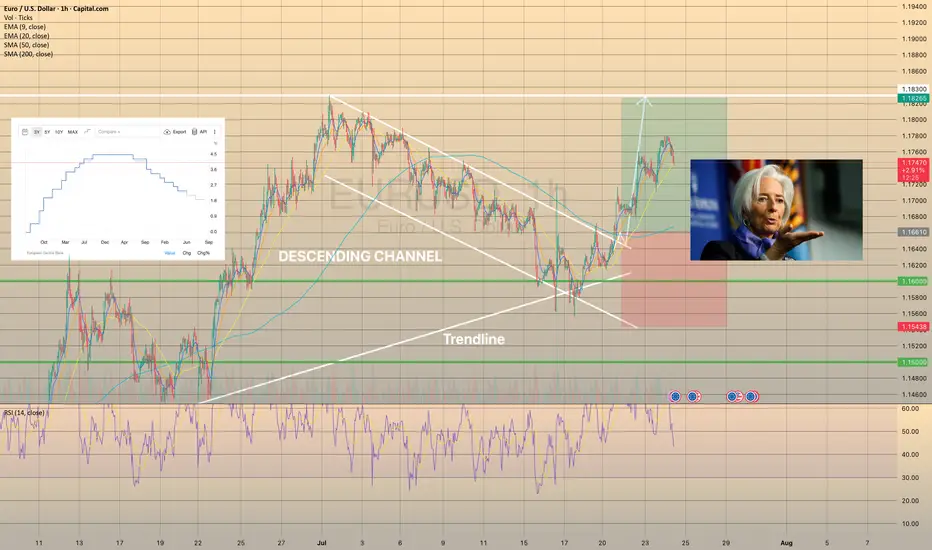
📈 EURUSD Technical Outlook
EURUSD has been trading within a descending channel since early July. However, it recently rebounded from trendline support, backed by bullish RSI divergence. The pair is approaching a breakout above the 1-hour SMA200, signaling a potential continuation of the uptrend. 🔼
A minor pullback is possible before a stronger move
Bullish momentum may continue if resistance is cleared
🎯 Target range: 1.18250 – 1.18300
🧩 Summary
The ECB is likely to keep rates unchanged at 2.15%, adopting a cautious tone amid easing inflation and global trade risks. This outcome could support the euro, particularly if U.S. rate expectations soften.
With technical indicators aligning with fundamental stability, EURUSD may be setting up for a bullish continuationin the coming sessions. 📊💶
EUR/USD Rises to 2.5-Week High Ahead of ECB MeetingEUR/USD Rises to 2.5-Week High Ahead of ECB Meeting
Today at 15:15 GMT+3, the European Central Bank (ECB) will announce its interest rate decision, followed by a press conference at 15:45 GMT+3. According to Forex Factory, the main refinancing rate is expected to remain unchanged at 2.15% after seven consecutive cuts.
In anticipation of these events, the EUR/USD exchange rate has risen above the 1.1770 level for the first time since 7 July. Bullish sentiment is also being supported by expectations of a potential trade agreement between the United States and the European Union. According to Reuters, both sides are reportedly moving towards a deal that may include a 15% base tariff on EU goods entering the US, with certain exemptions.
Technical Analysis of the EUR/USD Chart
From a technical perspective, the EUR/USD pair has shown bullish momentum since June, resulting in the formation of an ascending channel (marked in blue).
Within this channel, the price has rebounded from the lower boundary (highlighted in purple), although the midline of the blue channel appears to be acting as resistance (as indicated by the arrow), slowing further upward movement.
It is reasonable to assume that EUR/USD may attempt to stabilise around the midline—where demand and supply typically reach equilibrium. However, today’s market is unlikely to remain calm. In addition to the ECB’s statements, volatility could be heightened by news surrounding Donald Trump’s unexpected visit to the Federal Reserve.
This article represents the opinion of the Companies operating under the FXOpen brand only. It is not to be construed as an offer, solicitation, or recommendation with respect to products and services provided by the Companies operating under the FXOpen brand, nor is it to be considered financial advice.
EURUSD IS ON ITS WAY TO LOCAL HIGHSEURUSD IS ON ITS WAY TO LOCAL HIGHS
EURUSD successfully rebounded from local support of 1.16000 and since then continues to rise towards local resistance of 1.18300. Recently the price has started to show the bearish divergence on RSI and Macd indicators. MACD went into the red zone.
What is the bearish divergence?
Bearish divergence is a technical analysis pattern where the price makes higher highs in an uptrend, but a momentum indicator (e.g., RSI, MACD) forms lower highs, signaling weakening bullish momentum and a potential downward reversal. To trade, identify the divergence in a clear uptrend with the indicator showing lower highs (e.g., RSI above 70). Sell or short when the price confirms a reversal (e.g., breaks below a support level or trendline) with increased volume. Set a stop-loss above the recent high. Target the next support level.
Generally speaking, it doesn't necessarily mean that EURUSD will drop immediately, the price may even grow a bit. However, it highlights some short opportunities.
#EURUSD: Still Extremely Bullish! Let's see how it goes! EURUSD is currently making minor correction and it is likely to reverse in coming days. We have to area from where price could reverse from. we advise you to read the chart and also do your analysis before making any decision.
Like and Comment For More!
Team Setupsfx_
Market Analysis: EUR/USD Pares GainsMarket Analysis: EUR/USD Pares Gains
EUR/USD declined from the 1.1750 resistance and traded below 1.1650.
Important Takeaways for EUR/USD Analysis Today
- The Euro started a fresh decline after a strong surge above the 1.1720 zone.
- There is a connecting bearish trend line forming with resistance at 1.1660 on the hourly chart of EUR/USD at FXOpen.
EUR/USD Technical Analysis
On the hourly chart of EUR/USD at FXOpen, the pair rallied above the 1.1720 resistance zone before the bears appeared, as discussed in the previous analysis. The Euro started a fresh decline and traded below the 1.1660 support zone against the US Dollar.
The pair declined below 1.1620 and tested 1.1590. A low was formed near 1.1592 and the pair started a consolidation phase. There was a minor recovery wave above the 1.1610 level.
EUR/USD is now trading below the 50-hour simple moving average. On the upside, it is now facing resistance near the 1.1630 level. It is close to the 23.6% Fib retracement level of the downward move from the 1.1749 swing high to the 1.1592 low.
The next key resistance is at 1.1660 and the 50% Fib retracement level. There is also a connecting bearish trend line forming with resistance at 1.1660.
The main resistance is near the 1.1690 level. A clear move above it could send the pair toward the 1.1720 resistance. An upside break above 1.1720 could set the pace for another increase. In the stated case, the pair might rise toward 1.1750.
If not, the pair might resume its decline. The first major support on the EUR/USD chart is near 1.1590. The next key support is at 1.1550. If there is a downside break below 1.1550, the pair could drop toward 1.1520. The next support is near 1.1485, below which the pair could start a major decline.
This article represents the opinion of the Companies operating under the FXOpen brand only. It is not to be construed as an offer, solicitation, or recommendation with respect to products and services provided by the Companies operating under the FXOpen brand, nor is it to be considered financial advice.

EUR/USD : US Dollar Strengthens Following Inflation ReportEUR/USD Analysis: US Dollar Strengthens Following Inflation Report
Yesterday, the US Consumer Price Index (CPI) report was released, showing an increase in consumer prices. According to Forex Factory, annual CPI rose from 2.4% to 2.7%, exceeding analysts' expectations of a 2.6% rise.
As reported by Reuters, the data supports the stance of Federal Reserve Chair Jerome Powell, who has repeatedly stated that the anticipated inflationary pressure—driven in part by tariffs—is a reason to refrain from further interest rate cuts.
However, President Donald Trump interpreted the data differently. On his Truth Social platform, he posted that consumer prices remain low and called for an immediate rate cut.
The market responded with a stronger US dollar—indicating that participants believe interest rates are likely to remain at current levels in the near term. Notably, the EUR/USD exchange rate fell to the 1.1600 level for the first time since late June (as indicated by the arrow).
Technical Analysis of the EUR/USD Chart
Analysing the EUR/USD chart as of 7 July, we identified:
→ A long-term ascending channel
→ A potential downward trajectory (marked by red lines)
Since then, the pair has followed the outlined path and declined by more than 1%.
It is worth noting that today, the EUR/USD price is near the lower boundary of a key trend channel, which may offer significant support — traders may look for a technical rebound from this level.
Additionally, attention should be paid to the upcoming release of the US Producer Price Index (PPI) at 15:30 GMT+3. These figures carry particular weight in light of potential renewed inflationary pressures. This and other upcoming data may prove decisive for the near-term direction of EUR/USD.
This article represents the opinion of the Companies operating under the FXOpen brand only. It is not to be construed as an offer, solicitation, or recommendation with respect to products and services provided by the Companies operating under the FXOpen brand, nor is it to be considered financial advice.
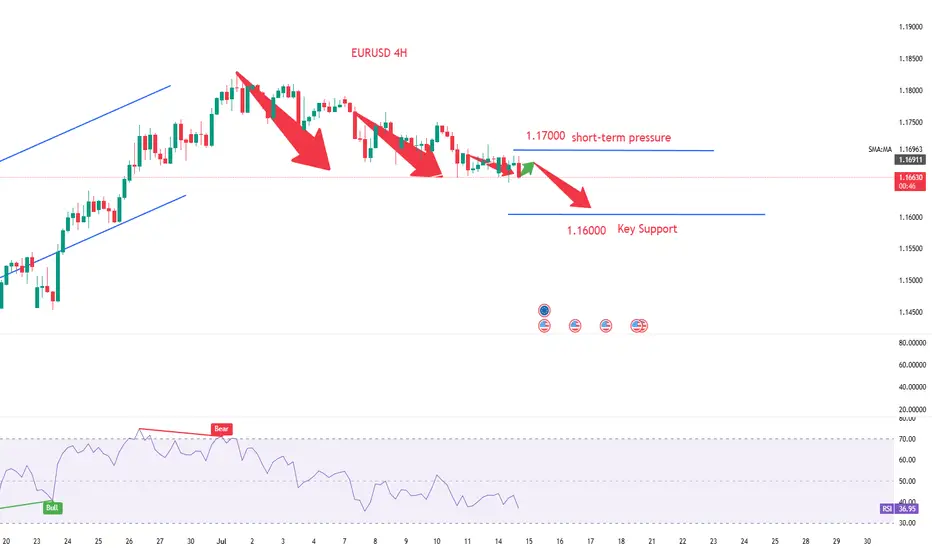
The euro's bearish structure remains unchanged.EUR/USD rebounded from around the three-week low of 1.1655 during the European session. However, the overall trend of the exchange rate remains within the descending channel that has been in place since early July. Market concerns over the U.S. government's new 30% tariff measures have dampened risk appetite, limiting the room for the exchange rate to rebound.
In the short term, the exchange rate is expected to contend within the 1.1650-1.1700 range. Analysts believe that if the euro fails to break through and stabilize above the 1.1700 threshold, the bearish structure will remain intact, and the exchange rate will continue to test lower support levels such as 1.1630 and 1.1600. A breakdown below these levels could open up further downside space, with the target pointing to around the lower Bollinger Band at 1.1387.
you are currently struggling with losses,or are unsure which of the numerous trading strategies to follow,You have the option to join our VIP program. I will assist you and provide you with accurate trading signals, enabling you to navigate the financial markets with greater confidence and potentially achieve optimal trading results.
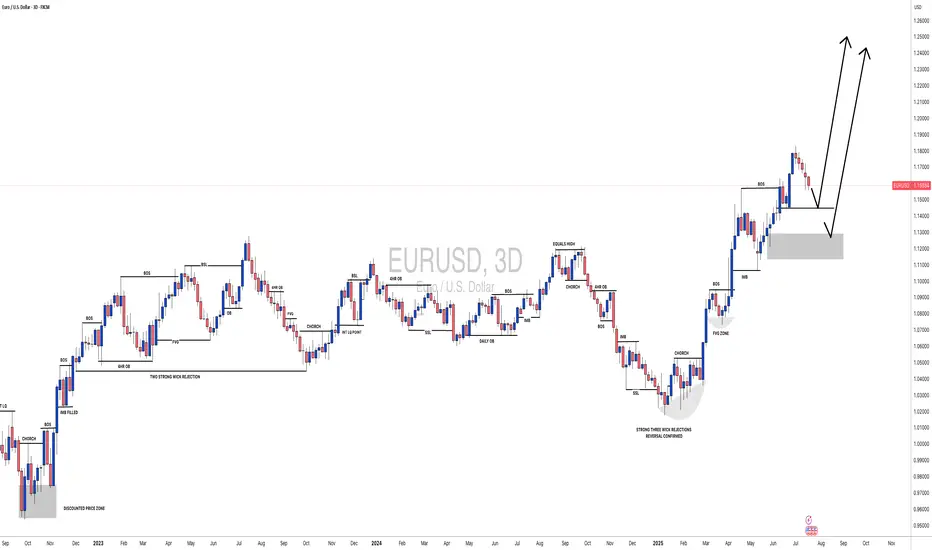
EUR/USD Holding Support — Watching for Bullish ReactionHi Everyone,
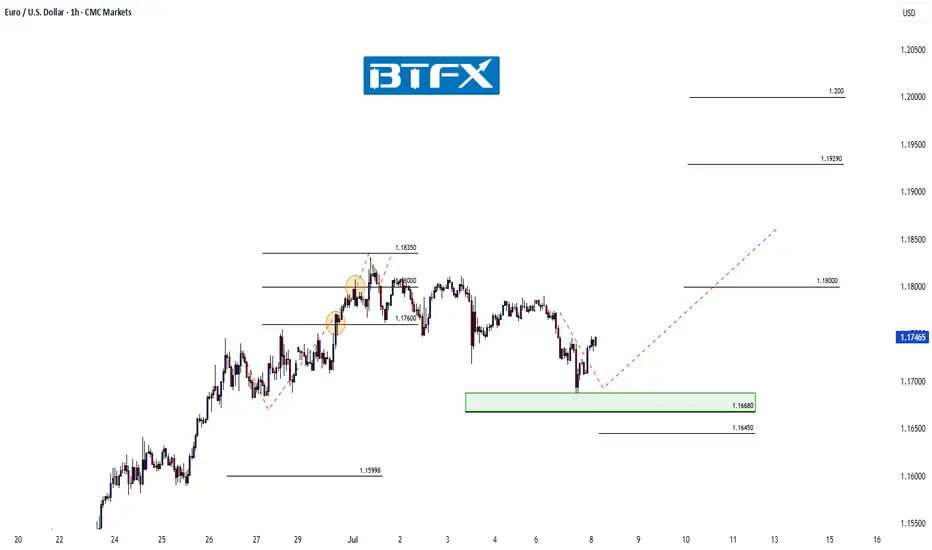
Since our last update, EUR/USD continues to range near the 1.16680 support level. We’re watching for buying interest to emerge above the key 1.16450 zone, which has acted as a critical level for the broader structure.
Should price manage to stabilise and form a base here, there’s potential for a move back towards the highlighted resistance area around 1.17450. A clear reaction from support could confirm renewed buying interest and set the stage for a retest of last week’s highs.
Our broader outlook remains unchanged: as long as price holds above 1.16450, we continue to look for the pair to build momentum for another move higher in the coming sessions. A decisive break above last week’s high could attract fresh buying interest, paving the way for a push towards the 1.19290 area and ultimately 1.20000.
We'll be watching closely to see if this recovery gains traction and whether buyers can sustain the move above resistance. The longer-term view remains bullish, provided price continues to respect the key support zone.
We’ll keep updating you through the week as the structure unfolds and share how we’re managing our active positions.
Thanks again for all the likes/boosts, comments and follows — we really appreciate the support!
All the best for the rest of the week. Trade safe.
BluetonaFX
EUR/USD Sells from 1.17200 back downWeekly Outlook: EUR/USD (EU)
This week, my bias on EUR/USD is similar to GBP/USD, as both pairs have been following a consistent bearish trend. Based on this structure, I’ll be watching to see if price begins a retracement back into an area of supply.
I’ve marked out the 8-hour supply zone, which sits at a premium level and was responsible for the last break of structure to the downside. If price retraces into this zone, I’ll look for potential sell confirmations on the lower time frames.
If price doesn’t tap into the supply zone first, I’ll then shift my focus to the 8-hour demand zone below. In that case, I’ll watch closely for signs of accumulation and a bullish reaction from this level, which could signal the start of a rally.
Confluences for EUR/USD Sells:
✅ Bearish trend has been consistent for the past few weeks.
✅ Breaks of structure have formed new supply zones to trade from.
✅ Liquidity exists below current price, which may be targeted first.
✅ The lower demand zone remains unmitigated, suggesting further downside movement.
📌 On the way down toward demand, I expect price to form another break of structure to the downside. The plan is to ride the sells down into demand, then look for potential buy opportunities if price begins to accumulate and react.
Let’s stay sharp and disciplined — have a solid trading week, everyone! 📊

EURUSD Weakened By New Tariff Tensions With US This is the Weekly FOREX Forecast for the week of July 14 - 18th.
In this video, we will analyze the following FX market: EURSUD
The latest headlines tell the story. The tariffs are triggering a slow run to the USD safe haven. The previous week showed the USD Index closed pretty strong. There's a good chance we'll see more of the same this coming week.
Look for the strength in USD to continue to be supported by fundamental news, and outperform the other major currencies, including the EURO.
Buy USD/xxx
Sell xxx/USD
Enjoy!
May profits be upon you.
Leave any questions or comments in the comment section.
I appreciate any feedback from my viewers!
Like and/or subscribe if you want more accurate analysis.
Thank you so much!
Disclaimer:
I do not provide personal investment advice and I am not a qualified licensed investment advisor.
All information found here, including any ideas, opinions, views, predictions, forecasts, commentaries, suggestions, expressed or implied herein, are for informational, entertainment or educational purposes only and should not be construed as personal investment advice. While the information provided is believed to be accurate, it may include errors or inaccuracies.
I will not and cannot be held liable for any actions you take as a result of anything you read here.
Conduct your own due diligence, or consult a licensed financial advisor or broker before making any and all investment decisions. Any investments, trades, speculations, or decisions made on the basis of any information found on this channel, expressed or implied herein, are committed at your own risk, financial or otherwise.

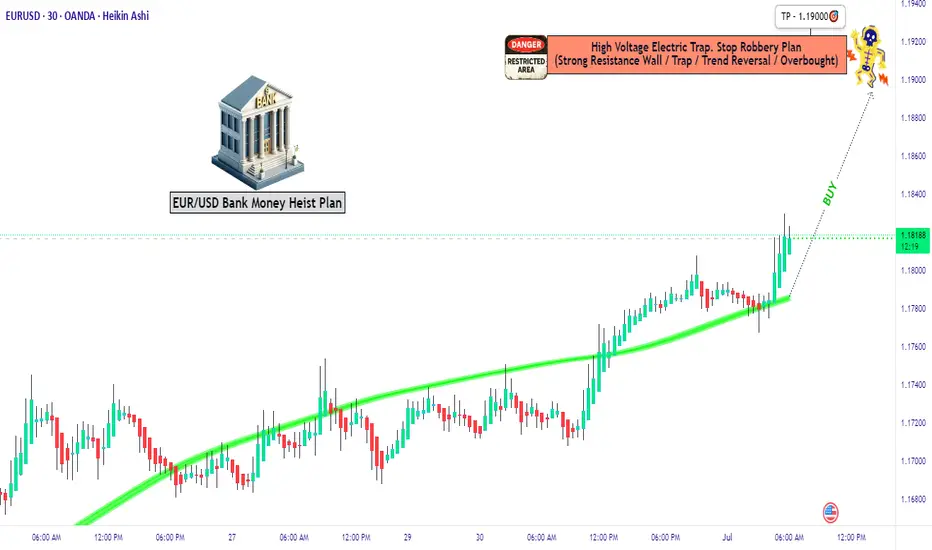
Ready to Swipe the Pips? | EUR/USD Heist Blueprint Unlocked🏴☠️💸 EUR/USD "Fiber Heist Plan" – Thief Trader Style 💸🏴☠️
The Vault is Open – Swipe the Bullish Bags! 🚀📈💰
🌟Hi! Hola! Ola! Bonjour! Hallo! Marhaba!🌟
Welcome, Money Makers & Market Robbers! 🤑✨
Here’s the latest masterstroke based on our Thief Trading Style™—a tactical breakdown of EUR/USD primed for a bullish breakout robbery. We’re targeting the red zone 🎯—where the weak hands panic, and the real players win.
🔓 Entry Plan (Buy Setup):
🟢 "The vault is wide open!" — We’re planning bullish entries using 15m–30m timeframe swing levels.
✅ Buy Limit Orders: Plot them smartly around most recent swing lows/highs.
⚠️ Chart Alert Suggested: Eyes on the prize, don’t miss the break-in.
🛑 Risk Guard (SL Setup):
💼 Stop-Loss: Set at nearest 30-min swing low (based on your risk appetite).
Remember, it’s about preserving your loot, not just grabbing it.
🎯 Target Area:
🎯 Primary Target: 1.19000
🎯 Optional Trailing SL: Ride the wave, lock the profits as price moves.
🧲 Scalpers' Notice:
Only scalp long. Got big pockets? Jump in. Smaller bags? Swing along.
💡 Trailing stop advised—don’t let the market steal your gains.
💹 Current Market Outlook:
EUR/USD is moving bullish—supported by technical signals, macro news, COT insights, and intermarket vibes.
🧠 Use all tools: Fundamental 📊 + Sentiment 🧭 + Quant + Bias Score 📈.
📎 Want the full breakdown? Check the 👉.Liinkk.🔗
(Keep updated, conditions shift fast!)
⚠️ News Risk Alert:
🚨 Stay alert during news drops—avoid fresh trades then.
Use trailing SLs to lock profits & guard against reversal raids.
💖 Support the Robbery Plan!
💥 Hit that Boost Button 💥 if you're riding with the Thief Team!
We steal smart, we trade sharp — every day’s a new heist in this market.
See you on the next plan! Stay legendary 🐱👤💸🤑🔥
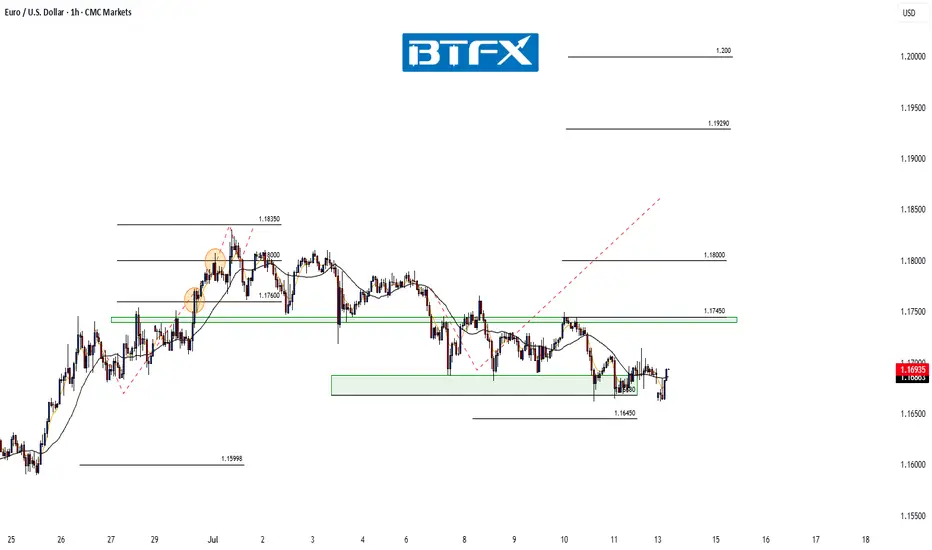
EUR/USD Testing Support — Will Buyers Step In Again?Hi Everyone,
Since our last update, EUR/USD is currently testing the 1.16680 support level. We’re watching for buying interest to emerge above the key 1.16450 zone; if price can stabilise here, we could see a retest of the highlighted resistance area around 1.17450.
Our broader outlook remains unchanged: as long as price holds above 1.16450, we continue to look for the pair to build momentum for another move higher in the coming sessions. A decisive break above last week’s high could attract fresh buying interest, paving the way for a push towards the 1.19290 area and ultimately 1.20000.
We'll be watching closely to see if this recovery gains traction and whether buyers can sustain the move above resistance. The longer-term view remains bullish, provided price continues to respect the key support zone.
We’ll keep updating you through the week as the structure unfolds and share how we’re managing our active positions.
Thanks again for all the likes/boosts, comments and follows — we really appreciate the support!
All the best for the rest of the week. Trade safe.
BluetonaFX

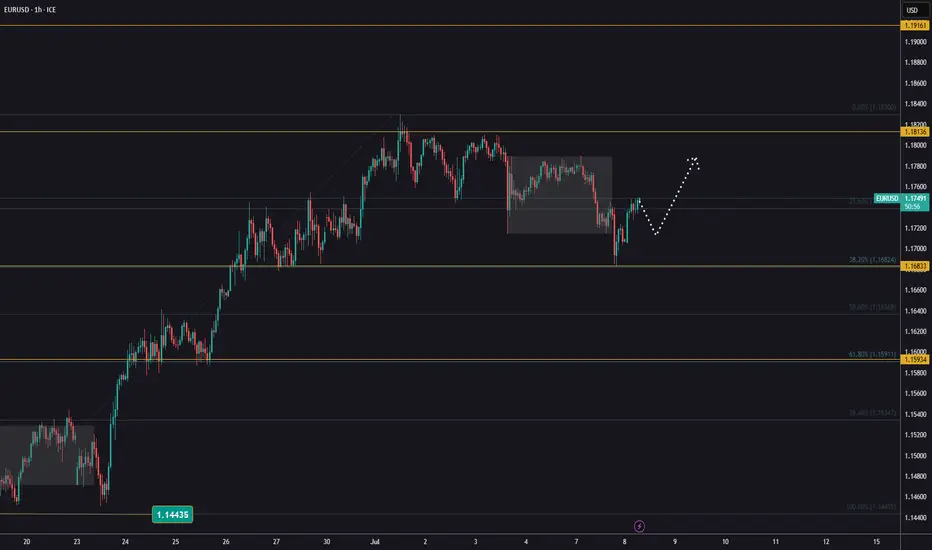
The trend continues for EURUSDYesterday, EURUSD once again tested the support level at 1,1683 and bounced off it.
The uptrend remains strong, and we are monitoring for its continuation.
All positions should align with the main trend.
Watch for the end of the current pullback as a potential buying opportunity.
The next resistance levels are 1,1813 and 1,1916!

Buying opportunities on EURUSDYesterday, EURUSD touched the support level at 1,1683 and bounced off it.
This opens up the potential for a new bullish move and buying opportunities.
We may see another test of the support zone, but the overall trend remains unchanged.
The next resistance levels are 1,1813 and 1,1916!
EUR/USD Update: Breakout Potential Above Recent HighsHi Everyone,
Monday played out as expected; a bounce off the highlighted support area appears to have provided enough momentum for a retest of the 1.18000 level. Price could briefly dip below the 1.16680 support; however, our outlook will remain unchanged as long as we hold above the 1.16450 level.
We maintain the view that a decisive break above last week’s high could attract additional buyers, paving the way for a move towards the 1.19290 level and ultimately the 1.20000 level.
We’ll share further updates on the projected path for EUR/USD if price breaks above this key resistance.
The longer-term outlook remains bullish, with expectations for the rally to extend towards the 1.2000 level, provided the price holds above the key support at 1.10649.
We will continue to update you throughout the week with how we’re managing our active ideas and positions. Thanks again for all the likes/boosts, comments and follows — we appreciate the support!
All the best for a good end to the week. Trade safe.
BluetonaFX