EUR/USD Analysis: US Dollar Strengthens at the Start of the WeekEUR/USD Analysis: US Dollar Strengthens at the Start of the Week
On 2 July, on the EUR/USD chart, we noted that the rally—during which the pair had gained more than 6% since mid-May—was under threat, citing several technical signals, including:
→ proximity of the price to the upper boundary of the ascending channel;
→ overbought conditions on the RSI indicator;
→ nearby resistance from the Fibonacci Extension levels, around 1.18500.
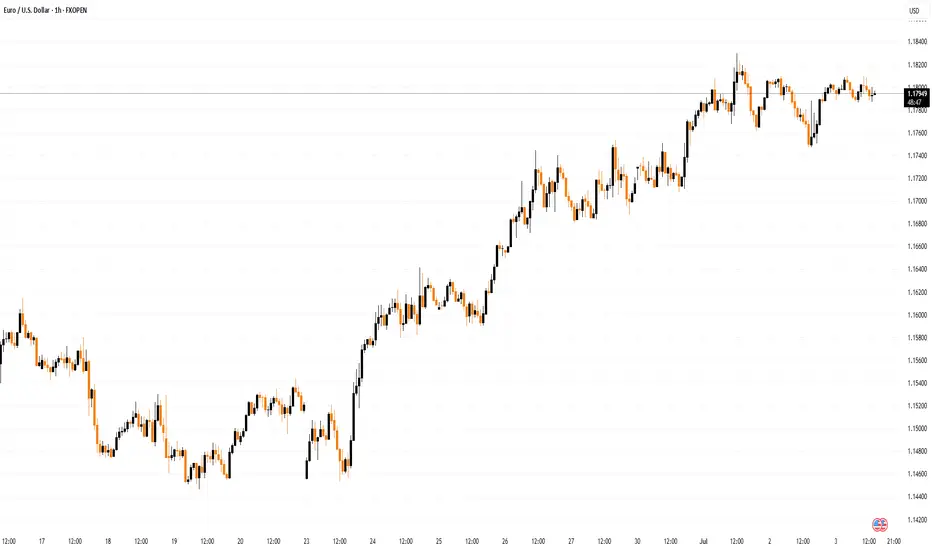
Trading at the start of the week points to renewed US dollar strength. This became particularly evident with the opening of the European session, which triggered a decline in EUR/USD to the 1.17500 area.
It is reasonable to assume that the dollar’s strength against the euro is linked to early-week positioning by traders, who are anticipating news regarding US trade agreements.
According to Reuters, the United States is close to finalising several trade deals in the coming days and is expected to notify 12 other countries today about higher tariffs.
EUR/USD Technical Chart Analysis
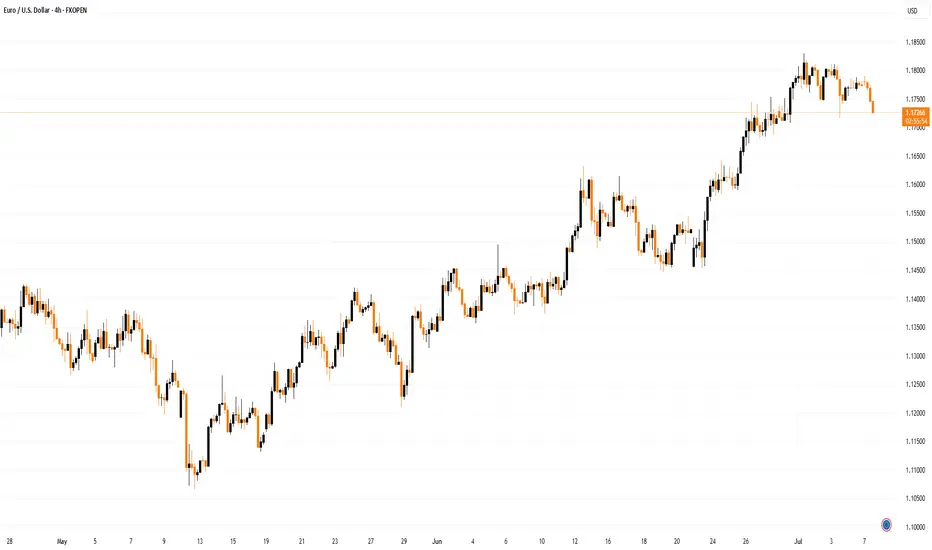
The ascending channel established last week remains in play, with the following developments:
→ a dashed midline within the upper half of the channel has been breached by bearish pressure (as indicated by the arrow);
→ a series of lower highs in recent sessions suggests the formation of a downward trajectory, within which the price could move towards the channel median—or potentially test its lower boundary.
P.S. In the longer term, analysts at Morgan Stanley maintain a bullish outlook, forecasting that EUR/USD could rise to 1.2700 by the end of 2027.
This article represents the opinion of the Companies operating under the FXOpen brand only. It is not to be construed as an offer, solicitation, or recommendation with respect to products and services provided by the Companies operating under the FXOpen brand, nor is it to be considered financial advice.
Eurusdupdate
EUR/USD Rally Pauses Near 1.18000 – Higher Targets in SightHi Everyone,
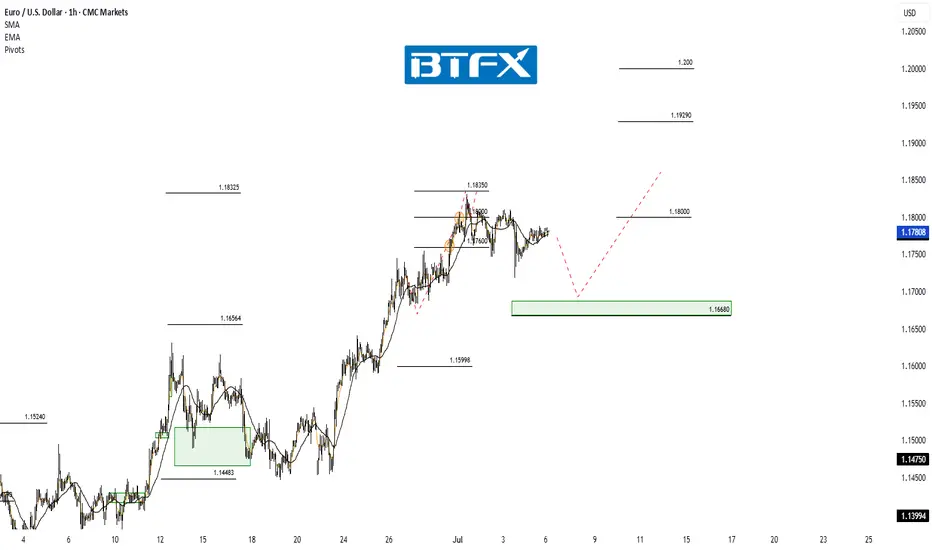
Last week, price action delivered the 1.18000 level we had been calling for, and as expected, dynamic resistance around that area proved to be significant.
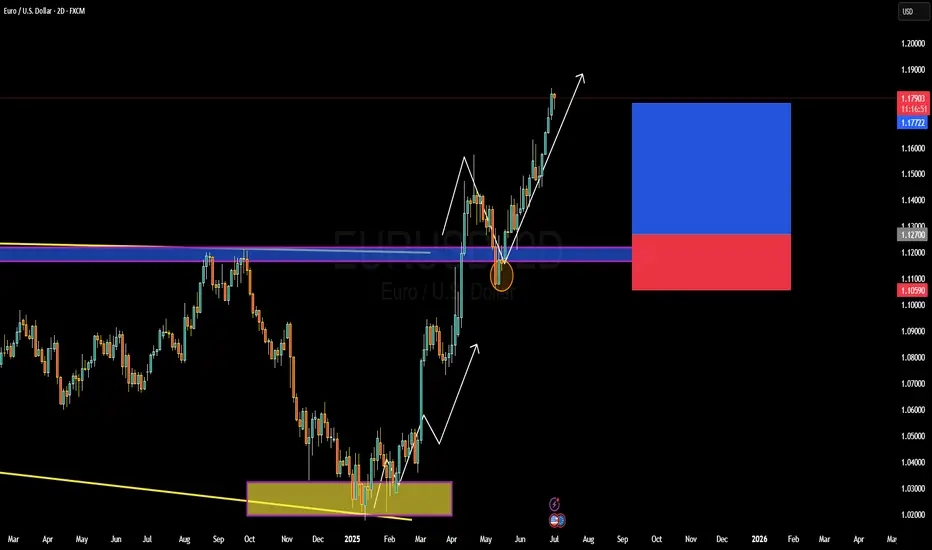
Looking ahead, we anticipate EUR/USD will continue to test the 1.18000 level this week while holding above the 1.16680 support zone. A strong break above last week’s high could attract further buyers, paving the way for a move towards the 1.19290 and ultimately the 1.20000 levels. We’ll share further updates on the projected path for EUR/USD if price breaks above this level.
The longer-term outlook remains bullish, with expectations for the rally to extend towards the 1.2000 level, provided the price holds above the key support at 1.10649.
We will continue to update you throughout the week with how we’re managing our active ideas and positions. Thanks again for all the likes/boosts, comments and follows — we appreciate the support!
All the best for a good end to the week. Trade safe.
BluetonaFX
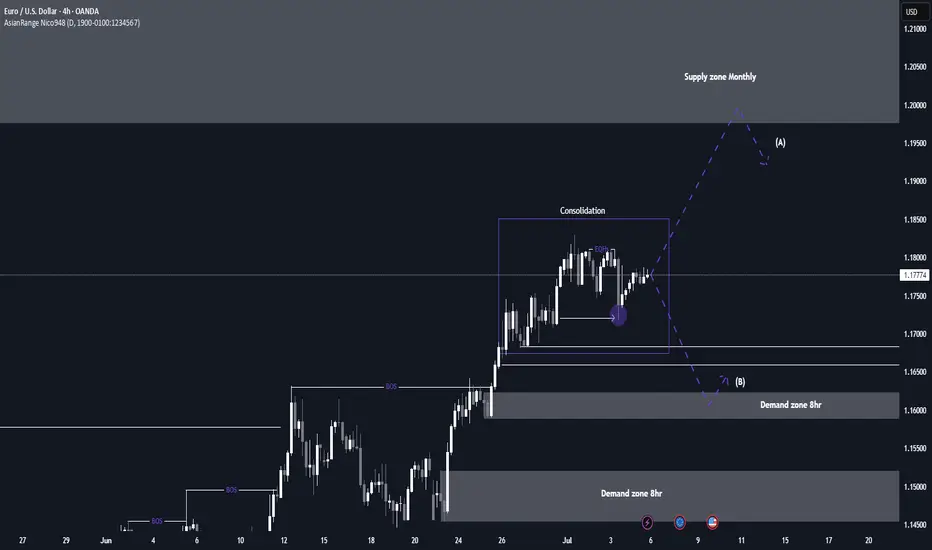
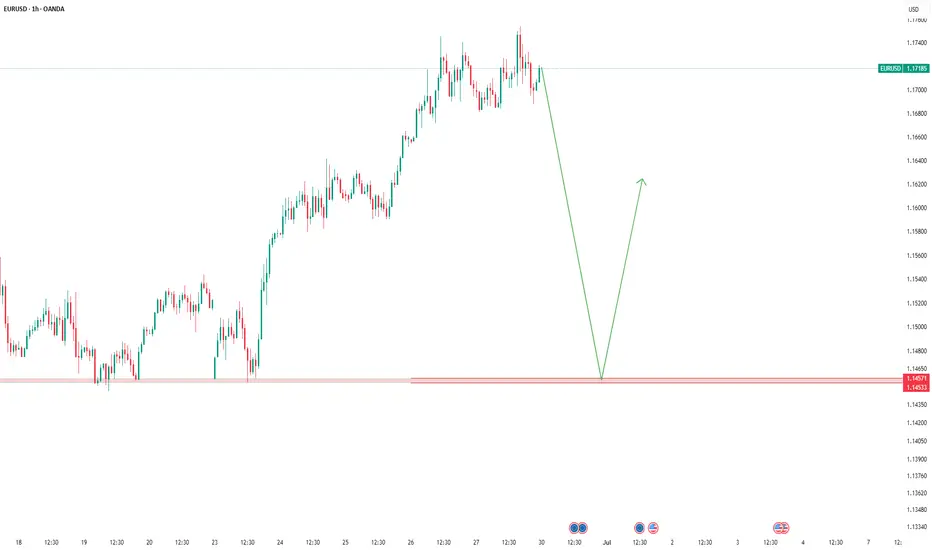
EUR/USD breakout awaiting EUR/USD has not provided a clear structure over the past week or two. The pair appears to be in consolidation, building liquidity on both sides of the current range. At the moment, I’m waiting for a decisive breakout, ideally followed by distribution within the monthly supply zone, although that zone is still some distance away.
This week, my focus will be on whether a new supply zone forms, closer to current price. If price sweeps the nearby equal highs and then shows signs of reversal, this could give us a fresh supply area to work from. Alternatively, if price moves lower, I’ll be looking at the 8-hour demand zone around 1.16000 for a possible long setup.
Confluences for EUR/USD:
- Although price has been slightly bullish, the current consolidation phase suggests a potential reversal could be on the horizon.
- Liquidity is building on both sides of the range, making a reaction from the monthly supply zone increasingly probable.
- There’s significant downside liquidity still untapped, such as Asia session lows, which could serve as short-term targets.
- For clearer confirmation, we still need a decisive break in market structure to the downside.
P.S. If price sweeps the lower liquidity and moves into the 8-hour demand zone near 1.16000, I will be watching for accumulation to form and signs of bullish intent from there.
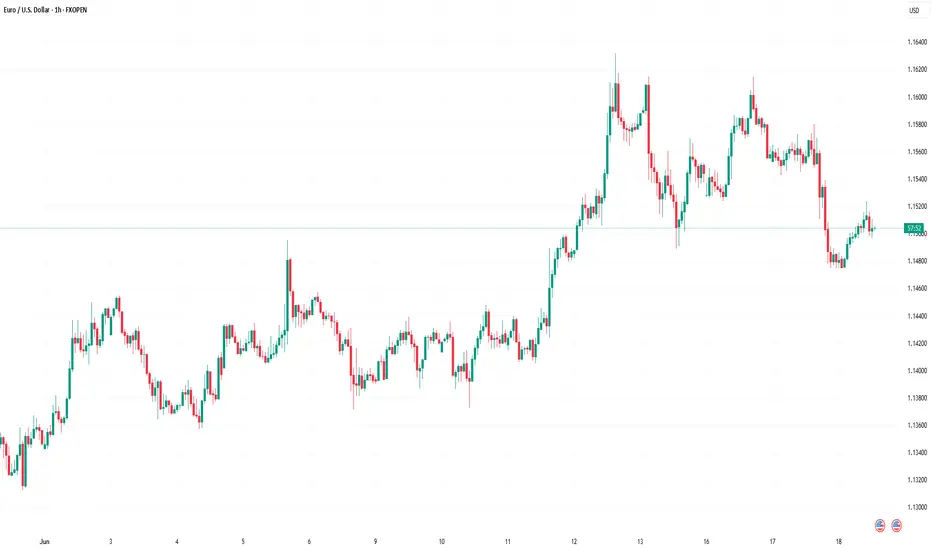
EUR/USD Rallies on Broad Dollar WeaknessEUR/USD Rallies on Broad Dollar Weakness
EUR/USD started a fresh increase above the 1.1750 resistance.
Important Takeaways for EUR/USD Analysis Today
- The Euro started a decent increase from the 1.1600 zone against the US Dollar.
- There is a connecting bullish trend line forming with support near 1.1770 on the hourly chart of EUR/USD at FXOpen.
EUR/USD Technical Analysis
On the hourly chart of EUR/USD at FXOpen, the pair started a fresh increase from the 1.1600 zone. The Euro cleared the 1.1650 resistance to move into a bullish zone against the US Dollar.
The bulls pushed the pair above the 50-hour simple moving average and 1.1750. Finally, the pair tested the 1.1830 resistance. A high was formed near 1.1829 and the pair is now consolidating gains above the 23.6% Fib retracement level of the upward wave from the 1.1590 swing low to the 1.1830 high.
Immediate support on the downside is near a connecting bullish trend line at 1.1770. The next major support is the 1.1710 level. A downside break below the 1.1710 support could send the pair toward the 1.1680 level and the 61.8% Fib retracement level of the upward wave from the 1.1590 swing low to the 1.1830 high.
Any more losses might send the pair into a bearish zone toward 1.1645. Immediate resistance on the EUR/USD chart is near the 1.1830 zone. The first major resistance is near the 1.1850 level. An upside break above the 1.1850 level might send the pair toward the 1.1920 resistance.
The next major resistance is near the 1.1950 level. Any more gains might open the doors for a move toward the 1.2000 level.
This article represents the opinion of the Companies operating under the FXOpen brand only. It is not to be construed as an offer, solicitation, or recommendation with respect to products and services provided by the Companies operating under the FXOpen brand, nor is it to be considered financial advice.
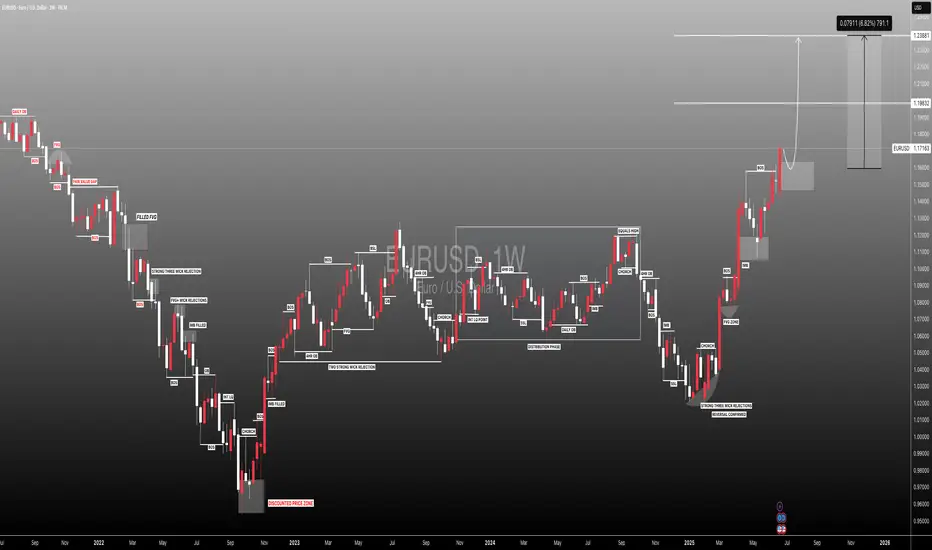
EURUSD BULISH OR BEARISH DETAILED ANALYSISEURUSD has been playing out exactly as forecasted, now trading confidently above the key 1.17 handle. Price action has respected prior structure levels perfectly, with the recent bullish impulse forming clean higher highs and higher lows. After a minor corrective move and successful retest of the previous breakout zone, we’re now seeing continuation momentum build toward the 1.21 target. This pattern is a textbook bullish flag followed by a clean breakout and retest, confirming the strength behind this current upside leg.
Fundamentally, the euro has gained strength due to growing divergence between the ECB and the Fed. With inflation in the Eurozone stabilizing and recent data indicating a modest recovery in manufacturing and services PMI, there's increasing speculation the ECB may hold rates longer, while the Fed is seen leaning toward eventual rate cuts as US labor data softens. The June NFP miss and downward revisions in prior data have weakened the USD’s position, creating a favorable environment for EURUSD bulls.
The technical confluence with macro fundamentals is striking. Risk sentiment is improving across global markets as inflation fears ease and rate clarity emerges. The euro remains supported by strong capital inflows and demand for yield stability. Additionally, EURUSD has cleared multi-month resistance zones with conviction, signaling institutional interest and momentum-based positioning. The recent candle formations suggest buyers are in firm control.
We remain on track for the 1.21 level, which aligns with prior swing highs and a key Fibonacci extension target. Any pullback toward the 1.16–1.1650 region should be viewed as a high-probability buying opportunity. With the DXY under pressure and euro zone resilience improving, EURUSD continues to be one of the top-performing major pairs heading into Q3. Stay patient and ride the wave—this move has more room to run.
EUR/USD Analysis: Rally May Be Under ThreatEUR/USD Analysis: Rally May Be Under Threat
The euro has appreciated by approximately 15% against the US dollar this year, as confidence in the United States continues to wane. As ECB Chief Economist Philip Lane noted in an interview at CNBC: “There is a degree of reorientation by global investors towards the euro.”
At the same time, officials at the European Central Bank have expressed concern that the rapid strengthening of the euro could undermine efforts to stabilise inflation at 2%. They warn that a move above $1.20 may pose risks for inflation and the competitiveness of export-oriented firms — an issue raised during the ECB’s ongoing ECB Forum on Central Banking in Portugal.
Could EUR/USD Reach the $1.20 Level?
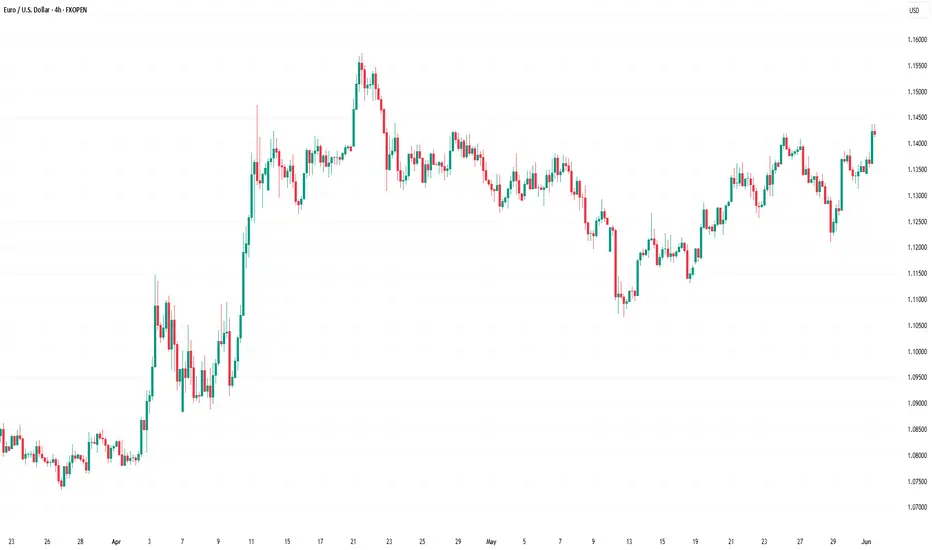
From a technical analysis perspective, EUR/USD is showing bearish signals:
→ If the early April rally (coinciding with Trump’s announcement of new tariffs) is taken as the initial impulse wave A→B, and the May low is interpreted as the end of the B→C corrective move, then, according to Fibonacci Extensions, the pair has now risen to a key resistance zone around 1.1850 (as indicated by the arrow on the chart).
→ In addition, the RSI indicator signals strong overbought conditions, while the price is hovering near the upper boundary of the ascending channel — a level that typically acts as resistance.
Given these factors, we could assume that EUR/USD may be in a vulnerable position, potentially facing a short-term correction — possibly towards the lower boundary of the channel, reinforced by support at the 1.1620 level. However, this does not negate the longer-term bullish outlook for the euro amid prevailing fundamental conditions.
This article represents the opinion of the Companies operating under the FXOpen brand only. It is not to be construed as an offer, solicitation, or recommendation with respect to products and services provided by the Companies operating under the FXOpen brand, nor is it to be considered financial advice.
EURUSD..BUYAnalysis complete — scenarios outlined. The zone could be a decision point for . Price reaction here may define the next move.
If price breaks and pulls back to retest, a reversal setup might emerge.
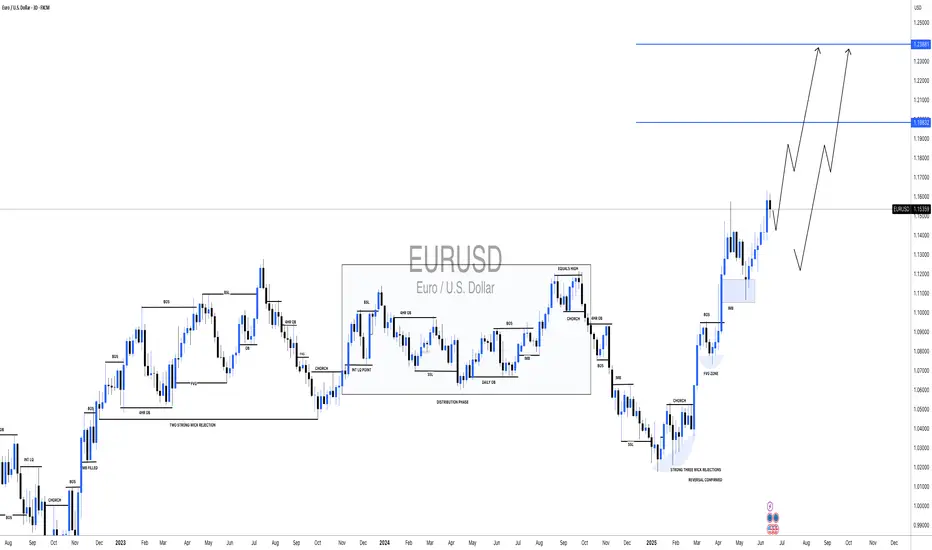
#EURUSD: +770 Pips Swing Move, DXY to Plumment! EURUSD is extremely bullish and is on track to cross the 1.21 area in our long-term swing plan. Based on recent price action, we have set two targets. As DXY continues to drop, the price is likely to remain bullish in the coming days or weeks. Please use accurate risk management while trading and consider this analysis.
Good luck and trade safely!
-Like
-Comment
-Share
Team Setupsfx_
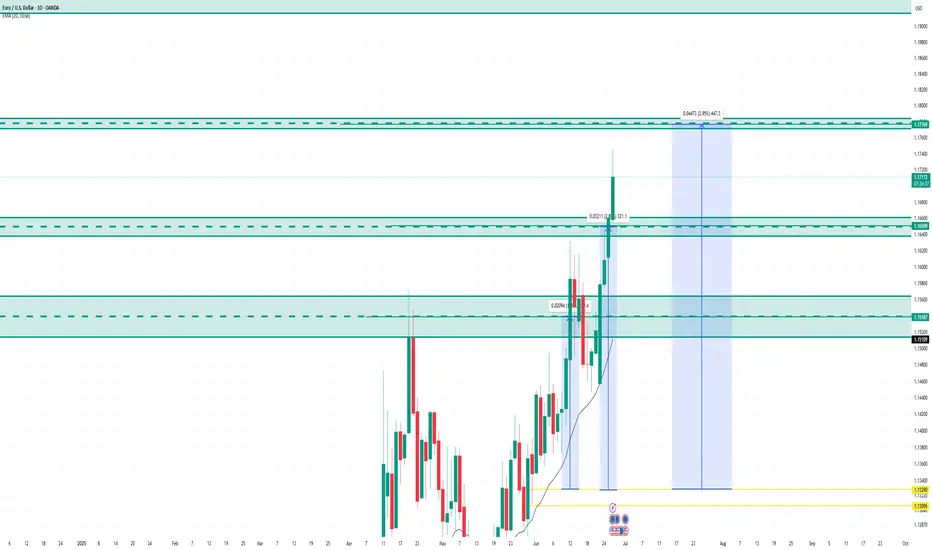
#EURUSD:Expecting A Strong Bull Move, Two Entries | Two TargetsIn our previous analysis, we clearly stated that the price would remain bullish as the DXY had to plummet, and it did exactly that, rising by 450 pips from our last entry. Currently, we have two areas from which we can see the price reversing. The first one is nearby and has a higher risk compared to our second entry, which may be safer for some traders. We need a strong confirmation before making any significant decisions.
Good luck and trade safely. We wish you the best in your trading journey.
Team Setupsfx_
EUR/USD Pair Hits Yearly HighEUR/USD Pair Hits Yearly High
Yesterday, the EUR/USD exchange rate rose above the 1.1700 level for the first time this year. The last time one euro was worth more than 1.70 US dollars was in autumn 2019.
The main driver behind the euro’s rise is the weakening dollar, largely due to decisions made by the Trump administration. This week alone, the EUR/USD pair has gained more than 2%, partly as a result of escalating tensions between the US President and the Chair of the Federal Reserve.
According to Reuters, Trump called Powell “terrible” and said he had three or four candidates in mind for the top job at the Fed. It was also reported that Trump had considered selecting and announcing a replacement for Powell by September or October (his current term officially runs until May 2026).
Technical Analysis of the EUR/USD Chart
Price movements are forming an upward channel (highlighted in blue), with the following observations:
→ Midweek, the price consolidated around the channel’s median line (as indicated by arrow 1);
→ It then broke through the 1.6300 level with strong bullish momentum (shown by arrow 2), a level that had acted as resistance earlier in the month;
→ The long upper wicks on the candles forming yesterday’s highs (circled) suggest increased selling pressure near the upper boundary of the channel.
Given this, we could assume that in the short term, the price might form a new consolidation zone around the median line above the 1.6300 level. Significant fundamental catalysts would be required to break the developing upward trend.
This article represents the opinion of the Companies operating under the FXOpen brand only. It is not to be construed as an offer, solicitation, or recommendation with respect to products and services provided by the Companies operating under the FXOpen brand, nor is it to be considered financial advice.
eurusd updateentry price 1.1329
stop loss update 1.133
take profit
1.153
1.165
1.177
1.194
result we hit first two target
Shorting Optimism: EUR/USD Rally vs RealityAfter the spike to 1.1640 driven by temporary ceasefire news and USD weakness, I’ve taken a short position on EUR/USD. The market priced in too much optimism too fast, and I see limited upside beyond this zone in the current macro landscape. I’m positioned for a controlled retracement back toward the 1.1460–1.1520 region.
The play? Fade the overextension, follow structure, and manage from strength.
Technicals:
• The pair ran into a strong supply zone near 1.1640, which aligns with a previous liquidity sweep.
• Momentum has slowed visibly on lower timeframes, with candles rejecting highs and wicks printing upper tails.
• Daily and 4H SMAs are overstretched. The 20 SMA on H4 is accelerating upward, but RSI is near overbought and flattening.
• My short entry was taken with a stop above 1.1745 and first target at 1.1540, second at 1.1500.
• A potential retest of the 1.1660 zone could offer additional entries if invalidation remains intact.
Fundamentals:
• ECB vs Fed Divergence: The Fed holds firm on rates amid sticky inflation, while the ECB is under pressure to ease further due to weak growth.
• EU Struggles: PMI data remains in contraction territory; HICP cooling to 1.7% YoY suggests little reason for tightening.
• Political Instability: Germany and France both facing internal political crises — risk premia rising.
• Ceasefire Priced In: EUR rally on Middle East headlines lacks depth — conflict paused, not resolved.
• USD Resilience: Weak recent data aside, the USD remains a safe haven. Fed’s Powell reiterated that cuts aren’t imminent.
⚠️ Bias: Bearish as long as price trades below 1.1640. Watching how the market reacts to Fed testimony and ECB rhetoric this week.
🧠 Reminder: Don’t get emotional after vertical rallies. When everyone gets excited, I look for exhaustion. That’s where trades begin.
Note: Please remember to adjust this trade idea according to your individual trading conditions, including position size, broker-specific price variations, and any relevant external factors. Every trader’s situation is unique, so it’s crucial to tailor your approach to your own risk tolerance and market environment.
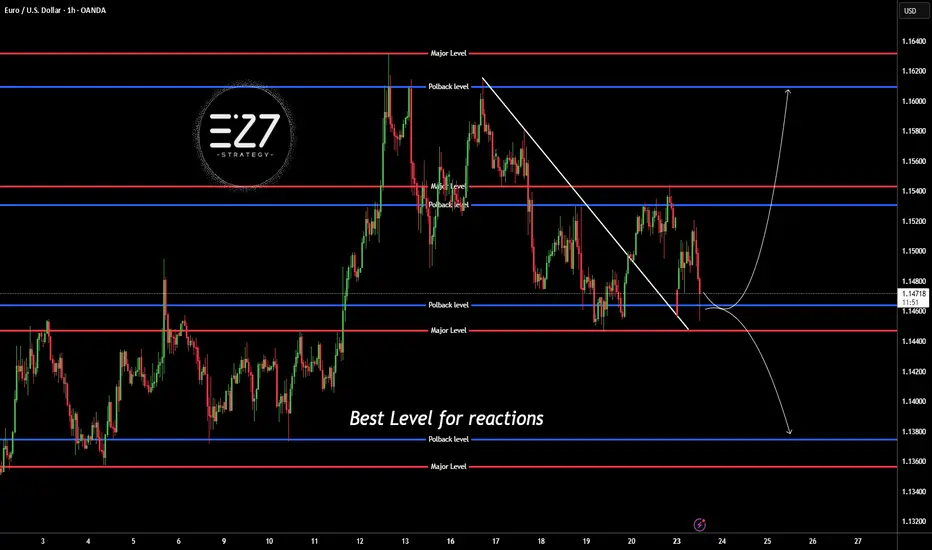
EURUSDThis levels is for reactions to support and resistace.
Price can now in Bull-trend if keep 1.145$ in sypport and breaked trendline.
⚠️Control risk management for positions.
EUR/USD Holds Neutral Tone Ahead of Fed DecisionIn recent hours, the pair has shown limited movement of just 0.5%, reflecting a neutral bias as the market prepares for the upcoming Federal Reserve policy announcement. At this point, expectations suggest that the U.S. central bank will maintain a neutral stance, keeping the interest rate steady at 4.5% in the short term.
However, the key focus will be on the Fed’s accompanying statement, where the greatest uncertainty lies. If the tone remains hawkish, it's likely that demand for the U.S. dollar will strengthen, potentially adding downward pressure to EUR/USD.
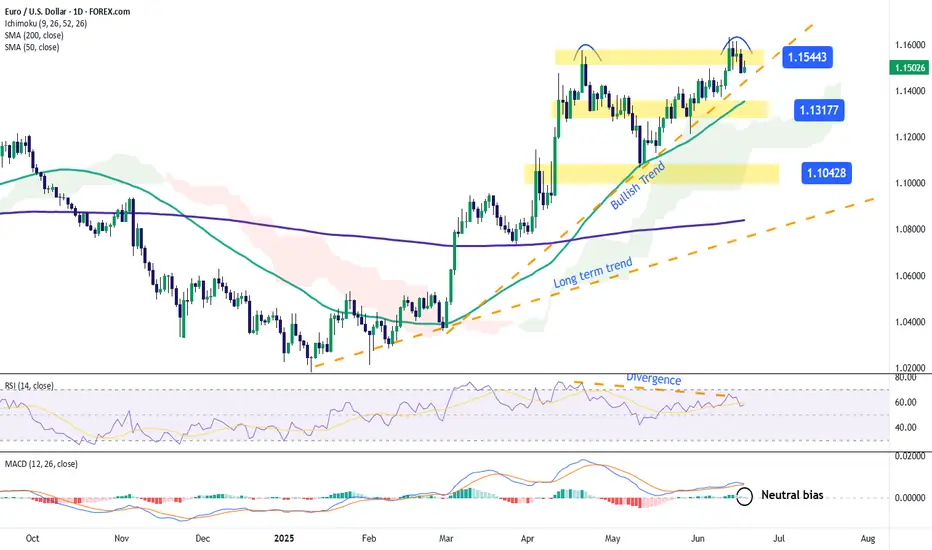
Uptrend Remains Intact
Since early March, the pair has maintained a steady bullish trend, without any major corrections that would threaten the current structure. That said, the price has once again approached key resistance zones, but has yet to break through them in a sustained manner—opening the door for range-bound movement if this pattern continues.
Technical Indicators
RSI: The Relative Strength Index has begun to show lower highs, while EUR/USD continues to print higher highs. This bearish divergence indicates an imbalance in market forces, potentially signaling room for a short-term correction.
MACD: The MACD histogram is fluctuating near the zero line, reflecting a technically neutral environment. As long as this behavior continues, the pair may enter a consolidation phase, awaiting a clearer directional signal.
Key Levels to Watch:
1.15443 – Current Resistance: Marks the multi-month high. A sustained move above this level could revive the bullish momentum.
1.13177 – Intermediate Support: Aligns with a recent neutral zone and the 50-period moving average. It acts as a technical support in the event of short-term pullbacks.
1.10428 – Key Support: Represents the lowest level of recent months. A break below this area could trigger a stronger bearish bias, putting the current uptrend at risk.
Written by Julian Pineda, CFA – Market Analyst
Follow him at: @julianpineda25
Market Analysis: EUR/USD Faces RejectionMarket Analysis: EUR/USD Faces Rejection
EUR/USD declined from the 1.1640 resistance and traded below 1.1550.
Important Takeaways for EUR/USD Analysis Today
- The Euro started a fresh decline after a strong surge above the 1.1600 zone.
- There is a connecting bearish trend line forming with resistance at 1.1545 on the hourly chart of EUR/USD at FXOpen.
EUR/USD Technical Analysis
On the hourly chart of EUR/USD at FXOpen, the pair rallied above the 1.1600 resistance zone before the bears appeared, as discussed in the previous analysis. The Euro started a fresh decline and traded below the 1.1550 support zone against the US Dollar.
The pair declined below 1.1520 and tested the 1.1475 zone. A low was formed near 1.1475 and the pair started a consolidation phase. There was a minor recovery wave above the 1.1495 level.
The pair tested the 23.6% Fib retracement level of the downward move from the 1.1614 swing high to the 1.1475 low. EUR/USD is now trading below 1.1550 and the 50-hour simple moving average. On the upside, the pair is now facing resistance near the 1.1505 level.
The next key resistance is at 1.1545 and the 50% Fib retracement level of the downward move from the 1.1614 swing high to the 1.1475 low. There is also a connecting bearish trend line forming with resistance at 1.1545.
The main resistance is near the 1.1580 level. A clear move above the 1.1580 level could send the pair toward the 1.1615 resistance. An upside break above 1.1615 could set the pace for another increase. In the stated case, the pair might rise toward 1.1650.
If not, the pair might resume its decline. The first major support on the EUR/USD chart is near 1.1475. The next key support is at 1.1450. If there is a downside break below 1.1450, the pair could drop toward 1.1400. The next support is near 1.1350, below which the pair could start a major decline.
This article represents the opinion of the Companies operating under the FXOpen brand only. It is not to be construed as an offer, solicitation, or recommendation with respect to products and services provided by the Companies operating under the FXOpen brand, nor is it to be considered financial advice.
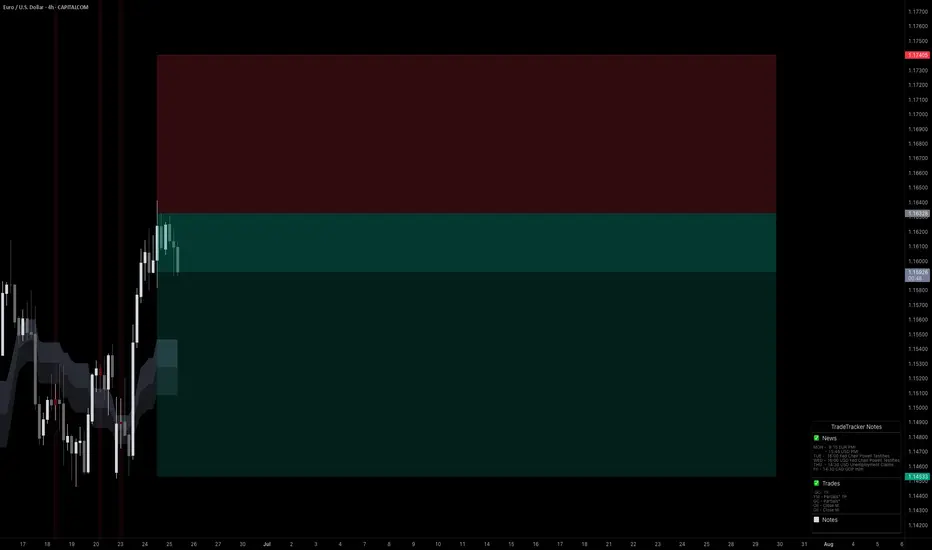
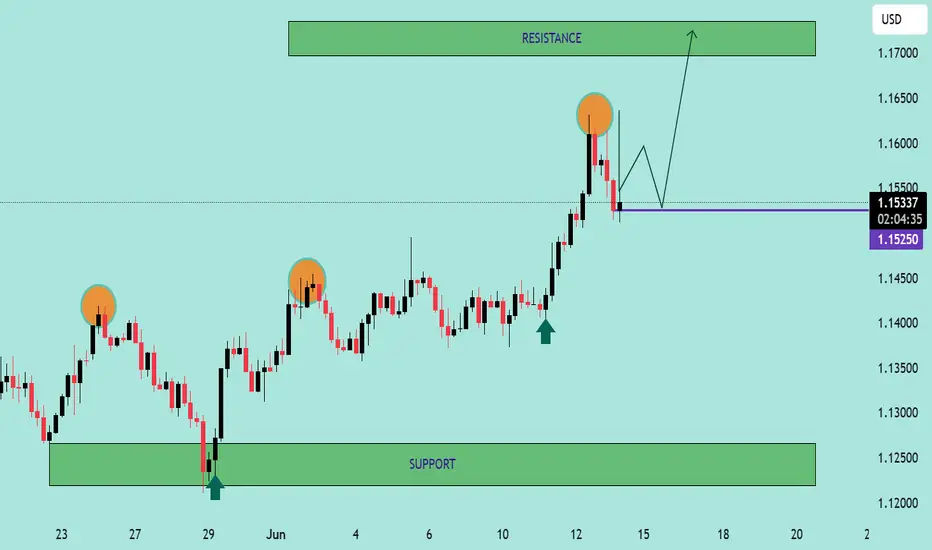
EUR/USD Breakout Retest StrategyEUR/USD Breakout Retest Strategy 🟢📈
📊 Technical Analysis Summary:
The chart illustrates a bullish breakout from a consolidation range with a well-defined support near 1.12500 and resistance between 1.16500–1.17000.
🔍 Key Observations:
🔸 Triple Rejection Zone:
Price faced rejection 3 times (highlighted with orange circles) near the same level before the breakout — classic liquidity sweep above resistance.
🔸 Strong Support Bounce:
Each time price reached the green support zone, it showed strong bullish reaction (green arrows) signaling solid buying interest.
🔸 Break and Retest Formation:
Price broke the previous highs and now seems to be retesting the breakout zone (around 1.15250–1.15300). A successful retest could confirm bullish continuation.
🔸 Projected Bullish Move:
If the retest holds, we may see price pushing up toward the 1.17000 resistance zone as marked.
📌 Trading Plan:
✅ Bullish Bias above 1.15250
✅ Look for bullish candlestick confirmation or breakout structure
🚫 Avoid trades if price drops below 1.15000 with momentum
📈 Target Zone: 1.16500 – 1.17000
🛑 Stop Loss suggestion: Below 1.14750
🧠 Keep patience during the retest — smart money often tests emotions before real moves! 💰📉📈
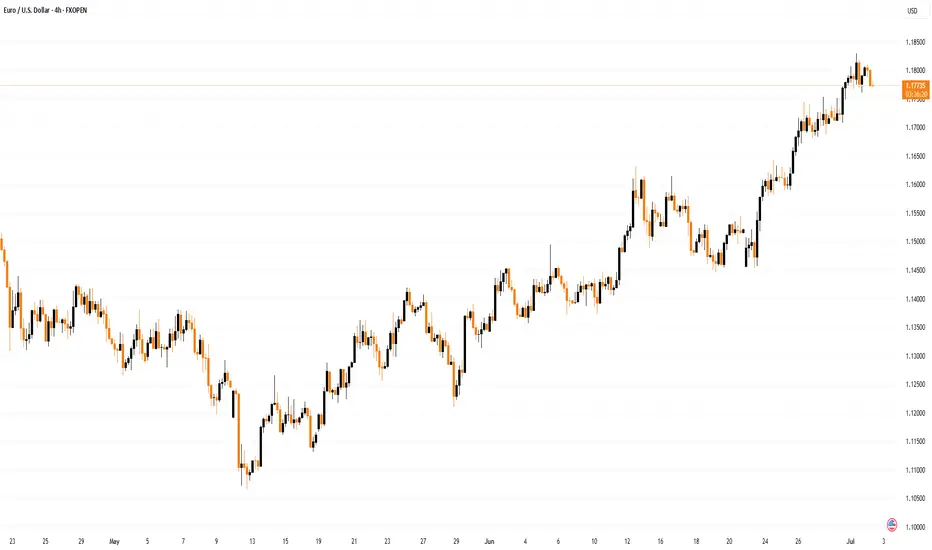
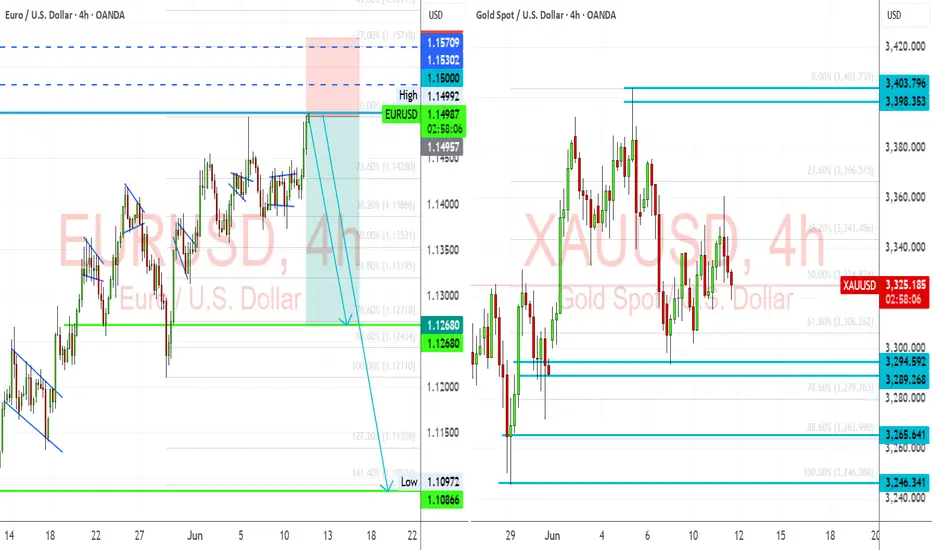
EURUSD Setup | CPI Fades, Fed Focus & Gold Leads Dollar ReboundEURUSD is showing signs of exhaustion after soft US CPI failed to extend the rally beyond 1.1495. While markets initially priced in a dovish Fed response, recent commentary and gold’s rejection from its highs suggest the dollar may be gearing up for a short-term recovery. With Gold pulling back and yields stabilizing, EURUSD could now follow suit lower into key support levels—especially if the Fed maintains a patient tone at this week’s meeting.
🔹 EURUSD (4H) Analysis
📉 Bias: Bearish
💡 Context:
EURUSD stalled just below 1.1500 after the CPI miss and now sits at a high-liquidity reversal zone. With DXY stabilizing and gold already rolling over, EURUSD may lag behind but eventually follow the same path. If the Fed leans hawkish or even neutral (ignoring political pressure), it could catalyze a drop toward 1.1268 and below.
📊 Technical Levels:
Resistance Zone: 1.1495–1.1530
Target 1: 1.1268
Target 2: 1.1086
Invalidation: Daily close above 1.1530 (or strong bullish follow-through after FOMC)
🪙 Leading Asset Clue:
Gold has already rejected major resistance (3,390–3,403) and is now pulling lower. Historically, EURUSD tends to follow when metals stall—especially if driven by real yields and Fed dynamics.
⚠️ Fundamentals to Watch:
🏦 FOMC Rate Decision & Dot Plot (June 12)
📈 US PPI + Jobless Claims (June 13)
💬 Fed Chair Powell's Press Conference
📰 Any shift in ECB or Fed rate cut timelines
🧠 Risk Factors:
Fed surprise dovish shift due to CPI softness
Market overreacts to rate cut expectations
Geopolitical risk-off flows favoring EUR
✅ Summary: Bias and Watchpoints
EURUSD
Bearish
Fed holding firm vs. ECB easing bias
Fed turning dovish post-CPI (Top Risk)
FOMC Rate Decision, PPI, Powell
📌 Final Note:
Gold is leading the turn as dollar strength resurfaces. EURUSD may lag initially but the macro context favors downside from this key resistance zone. Watch the Fed for confirmation—positioning into 1.1268 and 1.1086 looks attractive if the dollar gains traction post-FOMC.
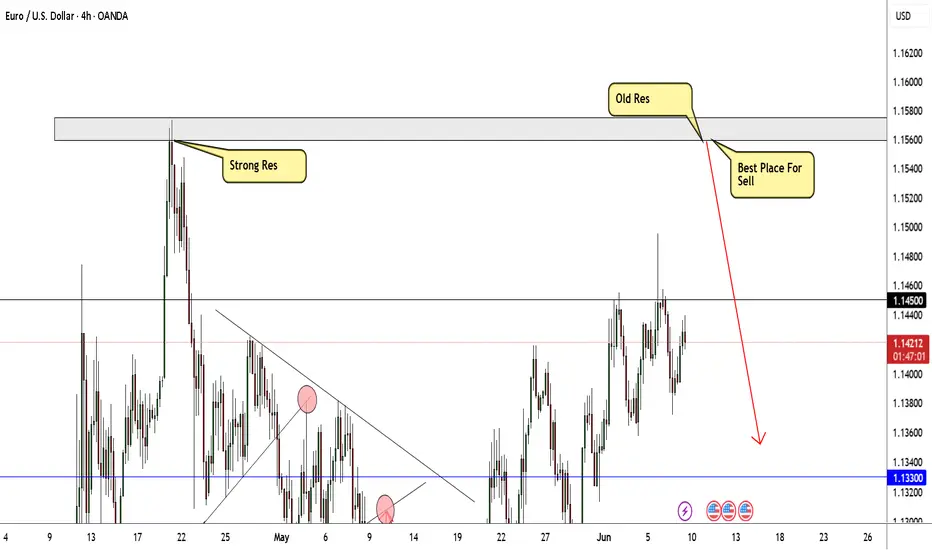
EUR/USD Best Place To Sell To Get 250 Pips , Don`t Miss It !Here is my EUR/USD Analysis and if you check the chart you will see that we have avery strong res area forced the price to go down hard last time , so i will sell this pair from the same res area , it will force the price to go down hard at least 250 pips , waiting the price to touch it and then we can sell it .
ECB Cuts Rates. EUR/USD Spikes to 1.5-Month HighECB Cuts Rates. EUR/USD Spikes to 1.5-Month High
Yesterday, as widely expected, the European Central Bank (ECB) cut interest rates for the eighth time since May 2024. According to ForexFactory, the main refinancing rate was lowered from 2.40% to 2.15% (having stood at 4.50% in May 2024).
According to Reuters:
→ ECB President Christine Lagarde stated that interest rates are now at a “good level”, despite the extremely high uncertainty caused by tariff threats from President Donald Trump.
→ Following the press conference, markets interpreted the message as a sign that the ECB is unlikely to cut rates again at its next meeting in July.
In response to the ECB's decision, the EUR/USD rate jumped to its highest level in a month and a half, but later retreated (as indicated by the arrow) back to previous levels.
Technical Analysis of the EUR/USD Chart
Four days ago, while analysing the EUR/USD chart, we:
→ drew an ascending channel;
→ suggested that bullish momentum could push the EUR/USD rate up to the psychological level of 1.1500 during the current week.
In fact, at yesterday’s peak, the rate came very close to 1.1500. However, a candlestick with a long upper shadow had formed on the EUR/USD chart, by the end of the day. Additionally, this morning, the 1.1450 level has acted as a resistance zone.
This suggests bearish activity, which could pull the rate down towards the lower boundary of the local channel (outlined in black), and possibly even attempt a breakout below it.
This article represents the opinion of the Companies operating under the FXOpen brand only. It is not to be construed as an offer, solicitation, or recommendation with respect to products and services provided by the Companies operating under the FXOpen brand, nor is it to be considered financial advice.
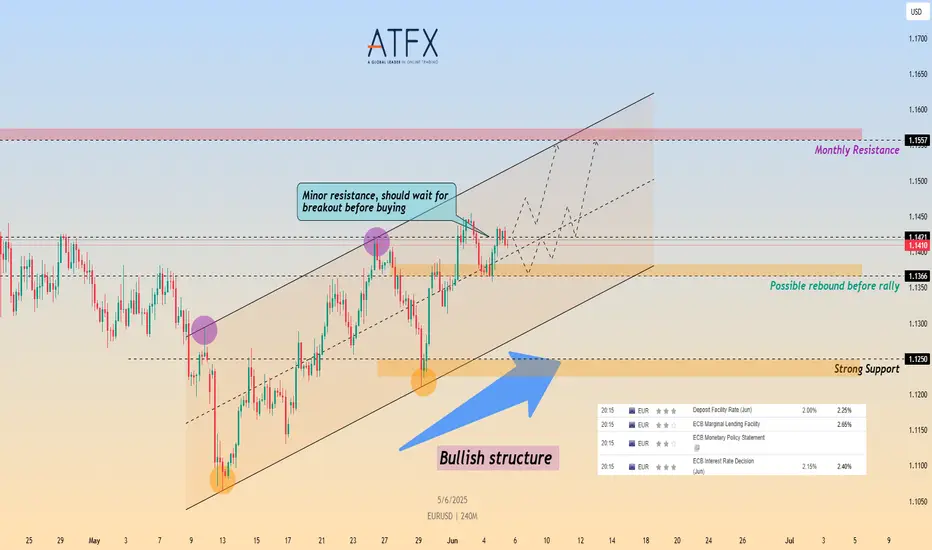
EUR/USD Awaits ECB Decision Near 1.1400 Amid Rate Cut BetsCMCMARKETS:EURUSD FX:EURUSD EUR/USD is consolidating above the 1.1400 psychological level as markets brace for the European Central Bank’s monetary policy announcement. The ECB is widely expected to cut its Deposit Facility Rate by 25bps to 2.00%, marking its seventh consecutive rate cut since June 2024.
Technically, the pair continues to trade within a well-defined ascending channel, reflecting a broader bullish structure. Current price action is facing a minor resistance near 1.1421, which is the top of the short-term range and also a key trendline rejection zone. A clean breakout above this area could expose the monthly resistance near 1.1557.
However, if OANDA:EURUSD EUR/USD fails to breach this level initially, a pullback toward 1.1366 (channel base support) is possible before bulls regain control. The bullish setup remains valid as long as price holds above this support zone.
Traders should monitor the ECB press conference for signals on whether the central bank may pause further easing later this year.
Resistance : 1.1421 , 1.1557
Support : 1.1366 , 1.1250
Market Analysis: EUR/USD Trims GainsMarket Analysis: EUR/USD Trims Gains
EUR/USD started a downside correction from the 1.1450 resistance.
Important Takeaways for EUR/USD Analysis Today
- The Euro struggled to clear the 1.1450 resistance and declined against the US Dollar.
- There was a break below a key bullish trend line with support at 1.1395 on the hourly chart of EUR/USD at FXOpen.
EUR/USD Technical Analysis
On the hourly chart of EUR/USD at FXOpen, the pair gained pace for a move above the 1.1300 zone, as mentioned in the previous analysis. The Euro tested the 1.1450 resistance and recently corrected gains against the US Dollar.
The pair dipped below 1.1400. There was a break below a key bullish trend line with support at 1.1395. It even traded below the 23.6% Fib retracement level of the upward move from the 1.1209 swing low to the 1.1454 high.
The pair is showing some bearish signs, and upside potential might remain limited. Immediate resistance is near the 50-hour simple moving average at 1.1395.
The next major resistance is near the 1.1450 zone. An upside break above the 1.1450 level might send the pair toward the 1.1500 resistance. Any more gains might open the doors for a move toward the 1.1550 level.
On the downside, immediate support on the EUR/USD chart is seen near the 50% Fib retracement level of the upward move from the 1.1209 swing low to the 1.1454 high at 1.1330. The next major support is near the 1.1300 level. A downside break below the 1.1300 support could send the pair toward the 1.1210 level.
This article represents the opinion of the Companies operating under the FXOpen brand only. It is not to be construed as an offer, solicitation, or recommendation with respect to products and services provided by the Companies operating under the FXOpen brand, nor is it to be considered financial advice.
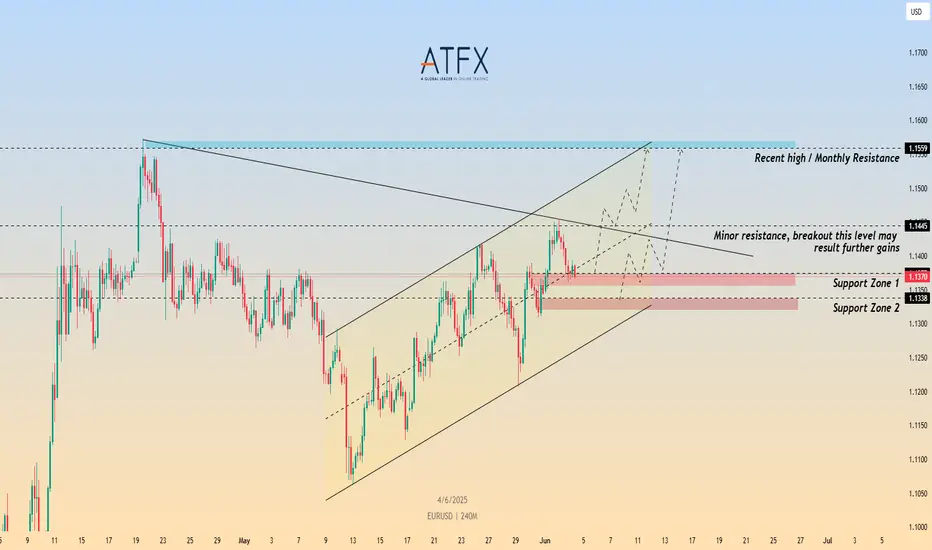
Euro Pulls Back – Eyes on ECB and Tariff TurmoilCMCMARKETS:EURUSD FX:EURUSD EUR/USD pulled back from a six-week high of 1.1454 to trade near 1.1379, down 0.52% on Tuesday, as strong U.S. labor market data and revived trade tensions lifted the dollar. April JOLTS job openings rose to 7.39M, beating expectations, signaling a resilient U.S. economy despite a 3.7% drop in factory orders.
In parallel, Trump’s announcement to double tariffs on steel and aluminum has reignited trade war concerns. Markets are also watching for a potential Trump–Xi call later this week.
Meanwhile, the Euro lost ground after May HICP inflation in the Eurozone fell to 1.9%, below the ECB’s 2% target. With core inflation slowing as well, markets have priced in a 25 bps rate cut at Thursday’s ECB meeting.
Technically, OANDA:EURUSD EUR/USD is still trading within a rising channel but rejected key minor resistance zone just below the descending trendline. A confirmed breakout above this area could open the path toward monthly resistance near 1.1559. On the downside, Support Zone 1 (around 1.1375) must hold to maintain the bullish bias; further weakness may expose Support Zone 2 (around 1.1338)
Resistance : 1.1445 , 1.1559
Support : 1.1375 , 1.1338
EUR/USD Rises to 4-Week HighEUR/USD Rises to 4-Week High
As shown on the EUR/USD chart today, the euro rose to a 4-week high against the US dollar this morning.
The euro's strength relative to the US dollar is supported by traders’ expectations ahead of the ECB's interest rate decision, scheduled for Thursday at 15:15 GMT+3.
This upcoming event is notable not only because the ECB is expected to cut rates from 2.40% to 2.15% (for the seventh consecutive time), but also due to the broader context shaped by ECB President Christine Lagarde’s recent remarks on the euro’s status as a reserve currency.
At the same time, the US dollar is weakening amid growing trade concerns—on Friday, the US President Donald Trump announced plans to double tariffs on steel and aluminum to 50%. He also accused China of breaching the recent trade truce.
Technical Analysis of the EUR/USD Chart
Seven days ago, when analysing the EUR/USD chart, we:
→ observed bullish sentiment;
→ highlighted the importance of the 1.1400 resistance level;
→ suggested that bears might attempt to strike back.
Since then, the price has pulled back from the mentioned level (as indicated by the arrow), but found support at the lower boundary of the ascending channel. The current bullish momentum could push EUR/USD towards the psychological level of 1.1500 during the week ahead.
This article represents the opinion of the Companies operating under the FXOpen brand only. It is not to be construed as an offer, solicitation, or recommendation with respect to products and services provided by the Companies operating under the FXOpen brand, nor is it to be considered financial advice.