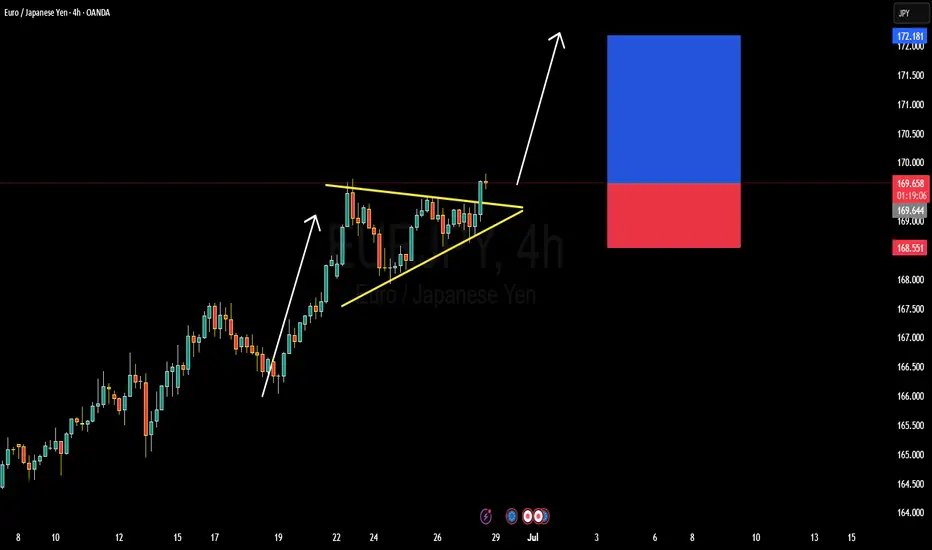
EURJPY BULLISH OR BEARISH DETAILED ANALYSISEURJPY has just broken out of a well-defined bullish pennant pattern on the 4H timeframe, confirming strong continuation potential to the upside. The price is currently hovering around 169.60 after consolidating in a tight structure, respecting both dynamic trendline support and horizontal resistance. This breakout signals renewed bullish momentum, and I'm now targeting the 172.10 zone as the next significant resistance level. The structure is clean, volume supported the breakout, and price action is aligned with the dominant uptrend.
Despite a relatively quiet start to the week—largely influenced by global risk-off sentiment surrounding Middle East tensions—EURJPY has held firm. Now that geopolitical jitters are easing slightly, yen weakness is resurfacing. The Bank of Japan remains firmly dovish, maintaining ultra-loose policy, while the Euro is supported by hawkish commentary from the ECB as inflation in the eurozone remains sticky. This divergence continues to fuel the long-term bullish bias for EURJPY.
Fundamentally, Japanese economic indicators remain soft, and there's still no clarity on when the BoJ will meaningfully shift policy. Meanwhile, EUR zone confidence indicators have stabilized, and speculation is growing around the ECB holding rates higher for longer into Q3. With widening yield differentials and a favorable risk sentiment return, this pair is positioned well for upside movement. Current momentum supports the probability of reaching the 172.00–172.10 area as risk appetite rebuilds across markets.
Technically and fundamentally aligned, EURJPY offers one of the strongest bullish continuation opportunities on the board right now. I will continue to monitor for minor dips as potential add-on areas, aiming for a full extension of the measured move from the pennant formation. Patience pays in setups like this where structure, sentiment, and macro all align.
Euurusd
AUDCAD 1H BUYAUDCAD After Forming Pin Bar Candle is Showing bullishness price action . Also there is a huge trendline liquidity pool . So we have of the Market to Grab all that Liquidity Upside.

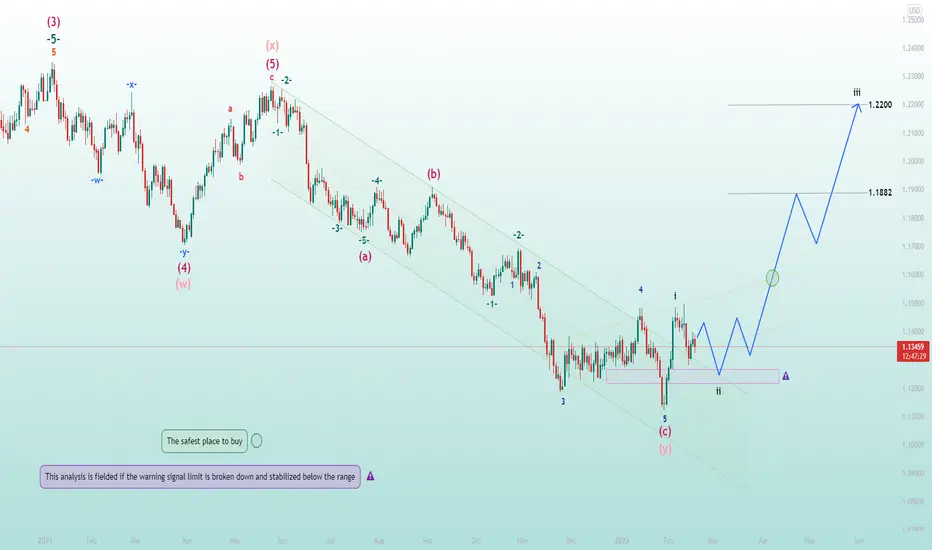
EURUSD |The safest place to buy✔️Hello traders , EURUSD in daily timeframe , In the wave count we had, we considered the waves as a complete leader and a complete correction.
It is over by counting a leading cycle, which may be for wave 1 or wave a
And a complex correction is formed, which is probably for wave b or wave 2.
Currently, the trend is breaking with the upper side of the channel and coming out of the previous wave angle, forming an upward trend that is probably for wave 1 from another wave, and then this wave is corrected, which I think will continue to correct as we specified in the analysis. And then there will be an ascent corresponding to wave 3 from another wave, and this wave is confirmed when the green circle is broken upwards.
This analysis is fielded if the warning signal limit is broken down and stabilized below the range.
🙏If you have an idea that helps me provide a better analysis, I will be happy to write in the comments🙏
❤️Please, support this idea with a like and comment!❤️
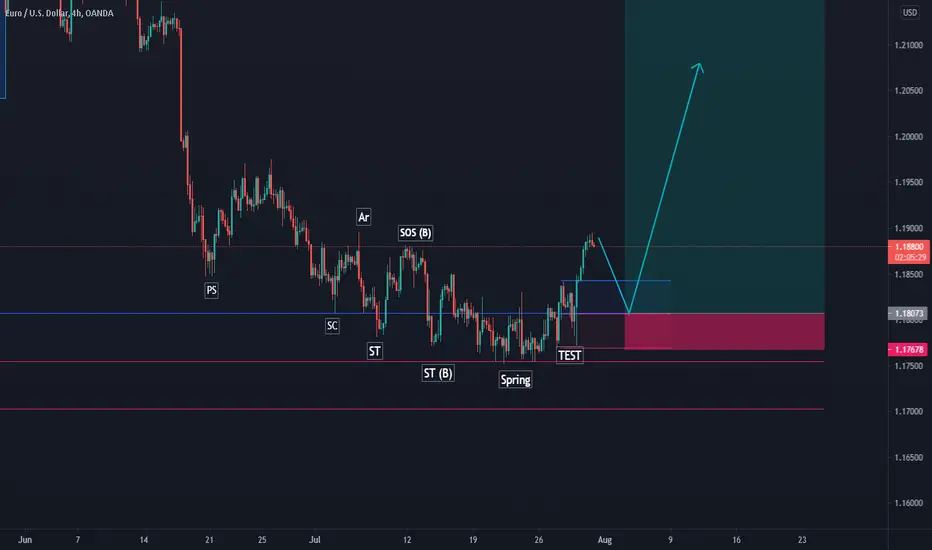
Eurusd Wyckoff Accumulation Schematic Eurusd Wyckoff Accumulation Schematic
Wait for to come prices in our lps zone or a demand zone and after confirmation you can buy EU
EURUSD Short #EURUSD WEEEKLY CHART Frame Outlook
Here Is The Possibility On EURUSD
Possibility Explanation
If We Break The NECKLINE
then market Goes To Touch The Support area Once Again
And Moving Here For a While
Then Down
SELL
When Market Is Opening
