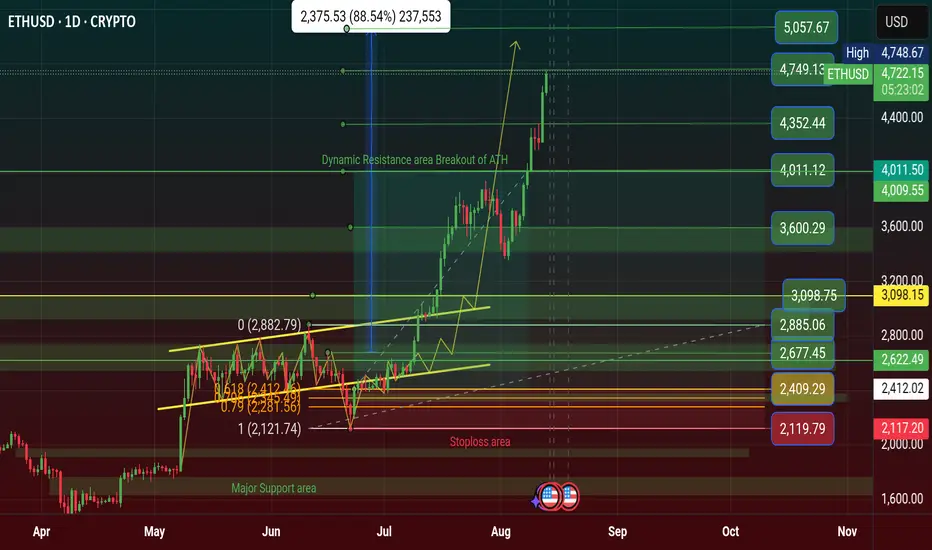
$ETH Surprised $4.7k and ATH breakout going to $5K✨ CRYPTOCAP:ETH Surprised $4.11K breakout going to Rocket $5K 🚀
Price will hit $5K on this month confirmed. previous post was price $4K see now. Who is Open long trade price at $4K ? just Hold it for $5K level.
🚦Vitalik Buterin Reclaims 'Onchain Billionaire' Status as CRYPTOCAP:ETH Surges Past $4,433
CRYPTOCAP:ETH co-founder Vitalik Buterin has once again joined the ranks of crypto's 10-figure holders, with his portfolio now valued at approximately $1.04 billion.
This milestone comes just days after ETH surpassed the $4,000 mark for the first time in eight months. Alongside Buterin, other prominent billionaires shaping the crypto and tech landscape include: Fred Ehrsam Co-founder of Coinbase and Paradigm, with an estimated net worth of $2.93 billion.
Volodymyr Nosov Founder and President of WhiteBIT Group, with wealth estimated between $6-$7 billion.
The Winklevoss Twins - Founders of Gemini exchange, each with an estimated personal net Worth of $2.7 billion. For more on notable figures like Larry Ellison, Bill Gates, and Mark Zuckerberg.
#Write2Earn #ETHETFsApproved #BinanceAlphaAlert #ETH4500Next? #SUBROOFFICIAL
Disclaimer: This article is for informational purposes only and does not constitute financial advice. Always conduct your own research before making any investment decisions. Digital asset prices are subject to high market risk and price volatility. The value of your investment may go down or up, and you may not get back the amount invested. You are solely responsible for your investment decisions and Binance is not available for any losses you may incur. Past performance is not a reliable predictor of future performance. You should only invest in products you are familiar with and where you understand the risks. You should carefully consider your investment experience, financial situation, investment objectives and risk tolerance and consult an independent financial adviser prior to making any investment.
Everyone
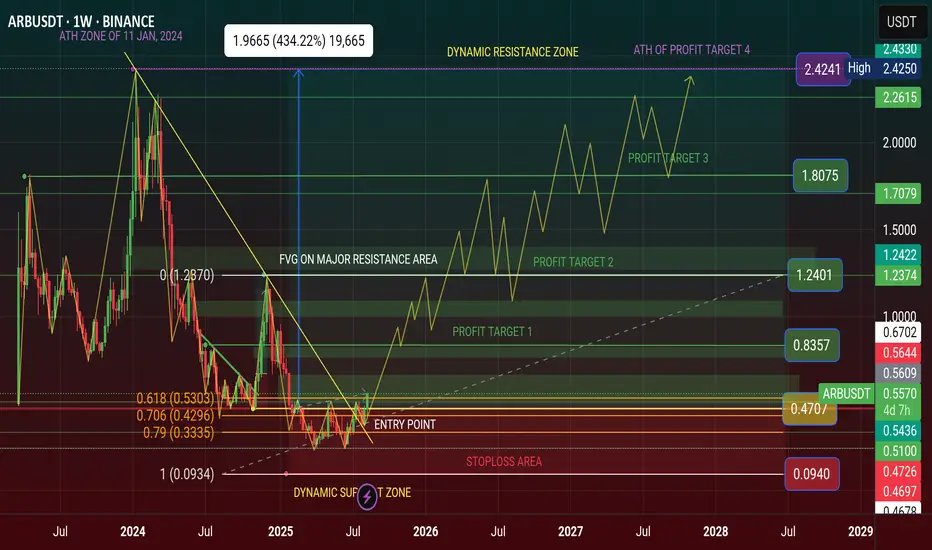
$ARB Finally Breakout $0.50 and going to +$1 This August 2025✨ AMEX:ARB Finally Breakout $0.50 and it's going to Rocket +$1 This August 2025 and +$2 in 2026
I was Share my Prediction on TradingView and Binance Square. Lastly, i was telling the ARB price is Showing a Bullish Reversal Pattern and this is Last hope in Bottom Price of Dynamic Support Level Area.
Now Price is showing Bullish Reversal of Double Bottom Pattern in Weekly Chart. Price Breakout The Neckline. My Premium Followers was Entered Long Trade or Buy Spot Trade of ARB Coin. They are now profitable in their ARB Coin investment.
🚦From News: Arbitrum (ARB) To Soar Further? Key Harmonic Pattern Signals Potential Upside Move
The cryptocurrency market is in bullish mode as Ethereum (ETH) broke above the $4,200 level for the first time since 2021. This surge has sparked a broad rally, with major altcoins including Arbitrum (ARB) riding the wave higher. ARB has posted an impressive 20% weekly gain, but more importantly, its price chart is now flashing a harmonic pattern that may reveal its next move.
Harmonic Pattern Hints at Potential Bounce
On the daily timeframe, ARB is shaping up a Bearish ABCD harmonic pattern — a formation that, despite its “bearish” name, often includes a bullish CD leg before the price reaches its Potential Reversal Zone (PRZ).
The structure began with a strong rally from point A around $0.3237 to point B near $0.5090, followed by a retracement to point C at $0.3702, where buyers stepped back in. Since then, ARB has rebounded and is now trading around $0.4680, signaling that the CD leg is firmly underway.
Harmonic projections suggest the CD leg could extend toward the 1.236 Fibonacci extension of the BC leg, putting the PRZ around $0.5456. If achieved, this would mark an approximate 18% upside from current levels.
What’s Next for ARB?
Momentum remains tilted toward the bulls. A sustained push toward $0.5456 would complete the ABCD pattern, but that zone could also act as significant resistance, prompting some traders to secure profits.
On the downside, ARB must hold above its 25-day moving average, currently near $0.4315. A breakdown below this level could weaken the bullish case and potentially lead to a deeper consolidation phase.
#Highlights #everyone #BinanceSquareFamily #Binance #ARB #SUBROOFFICIAL
Disclaimer: This article is for informational purposes only and does not constitute financial advice. Always conduct your own research before making any investment decisions. Digital asset prices are subject to high market risk and price volatility. The value of your investment may go down or up, and you may not get back the amount invested. You are solely responsible for your investment decisions and Binance is not available for any losses you may incur. Past performance is not a reliable predictor of future performance. You should only invest in products you are familiar with and where you understand the risks. You should carefully consider your investment experience, financial situation, investment objectives and risk tolerance and consult an independent financial adviser prior to making any investment.
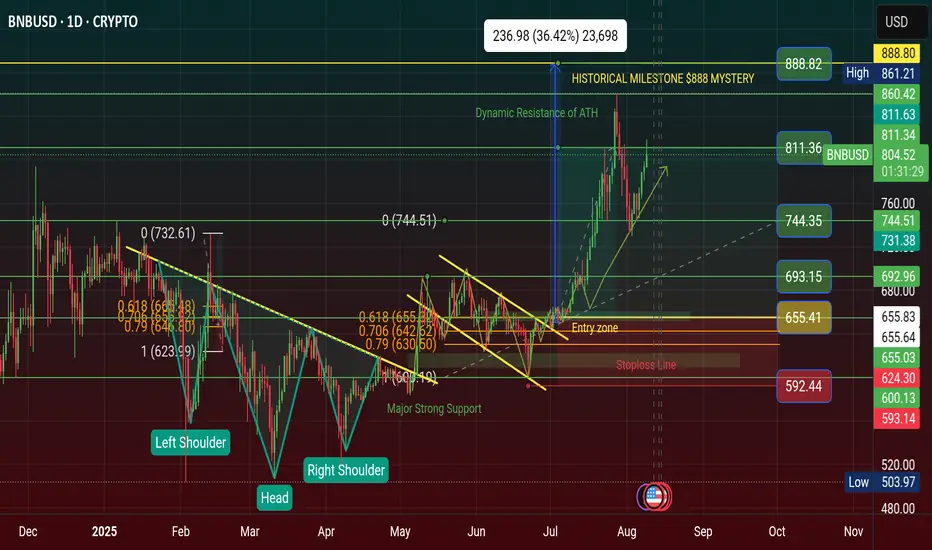
$BNB Finally Profit Done $811 & Road to $888-$1K Mystery in 2025CRYPTOCAP:BNB Finally Profit Done $811 & Road to $888-$1K in 2025. BNB price now Dynamic Resistance Area. Price will hit $888 - $1K if Breakout ATH of this month it will be happened. BNB price now Resistance area $863 of ATH and Weekly Time Fream Breakouts to $888 Mystery of Historical Milestone.
Breaking: Binance Taps Spain’s BBVA Bank to Custody Crypto, BNB Price Soars
BNB Price Rises 3%
BNB price jumped nearly 3% in the past 24 hours, with the price trading at $790 during writing. The 24-hour low and high were $765.52 and $790.98, respectively.
Furthermore, the trading volume saw a more than 25% increase in the last 24 hours, indicating a significant rise in interest among traders. It happened amid a broader crypto market recovery.
Popular analyst Ali Martinez, in an X post, predicted BNB price to move higher as it is in the discovery phase after hitting a new ATH. It also has one of the strongest year-to-date performances.
Traders’ confidence in BNB remained high as it resisted market volatility, while other crypto assets were down 20-40% after hitting ATH this year.
In the daily timeframe, the price was moving comfortably above the 50-SMA, 100-SMA, and 200-SMA at the time of writing.
Whereas, the Relative Strength Index (RSI) climbed to 58.08, signaling potential for a further upside move to $900.
CoinGlass data showed mixed trading activity in the derivatives market. At the time of writing, the total BNB futures open interest jumped more than 1.30% to $585.69 million in the last 24 hours.
However, 4-hour BNB futures open interest on Binance and OKX were down 0.02, 0.30%, but increased by 0.72% on Bybit.
This signals that derivatives traders remain cautious over a sudden rally in BNB price.
#highlight #everyone #BinanceSquareFamily #Binance #ETH #SUBROOFFICIAL
Disclaimer: This article is for informational purposes only and does not constitute financial advice. Always conduct your own research before making any investment decisions. Digital asset prices are subject to high market risk and price volatility. The value of your investment may go down or up, and you may not get back the amount invested. You are solely responsible for your investment decisions and Binance is not available for any losses you may incur. Past performance is not a reliable predictor of future performance. You should only invest in products you are familiar with and where you understand the risks. You should carefully consider your investment experience, financial situation, investment objectives and risk tolerance and consult an independent financial adviser prior to making any investment.
$ETH Finally $4,011 Profit Done Again, Breakout $4K price areaIf CRYPTOCAP:ETH price will be touch $4.5K and it's Breakout it will be happened $5K of new historical ATH.
Ethereum Price Target $4K as Trader Plans Partial Exit
Ethereum Maintains Market Leadership
The Ethereum Price Target $4K narrative is gaining traction as ETH continues to outperform the broader crypto market. Despite volatility, Ethereum’s resilience and strong fundamentals have kept it at the forefront of investor attention.
One experienced trader noted that ETH is “still the strongest asset in the crypto market,” following their lower time frame (LTF) plan closely. They believe the market could be nearing a local top, potentially with a brief spike — or deviation — above the $4,000 level.
Planned Exit Strategy Between $4K and $4.3K
The trader shared a specific strategy: selling 50% of their spot Ethereum holdings between $4,000 and $4,300. This position has been held for nearly two years, with an average entry price of around $2,400, meaning the planned sale would lock in substantial profits.
Such an approach reflects disciplined risk management — capturing gains after a strong rally while maintaining exposure in case the trend continues higher.
What This Means for the Market
If Ethereum does approach the $4K–$4.3K range, several scenarios are possible:
A deviation above $4K followed by a retracement could confirm a local top.
Sustained momentum beyond $4.3K could signal a stronger-than-expected breakout.
Broader crypto market sentiment will likely play a major role in price direction.
With ETH’s fundamentals stronger than ever and network upgrades continuing, the medium- to long-term outlook remains bullish — even if short-term corrections occur.
#highlights #BinanceSquareFamily #Binance #ETH #SUBROOFFICIAL
Disclaimer: This article is for informational purposes only and does not constitute financial advice. Always conduct your own research before making any investment decisions. Digital asset prices are subject to high market risk and price volatility. The value of your investment may go down or up, and you may not get back the amount invested. You are solely responsible for your investment decisions and Binance is not available for any losses you may incur. Past performance is not a reliable predictor of future performance. You should only invest in products you are familiar with and where you understand the risks. You should carefully consider your investment experience, financial situation, investment objectives and risk tolerance and consult an independent financial adviser prior to making any investment.

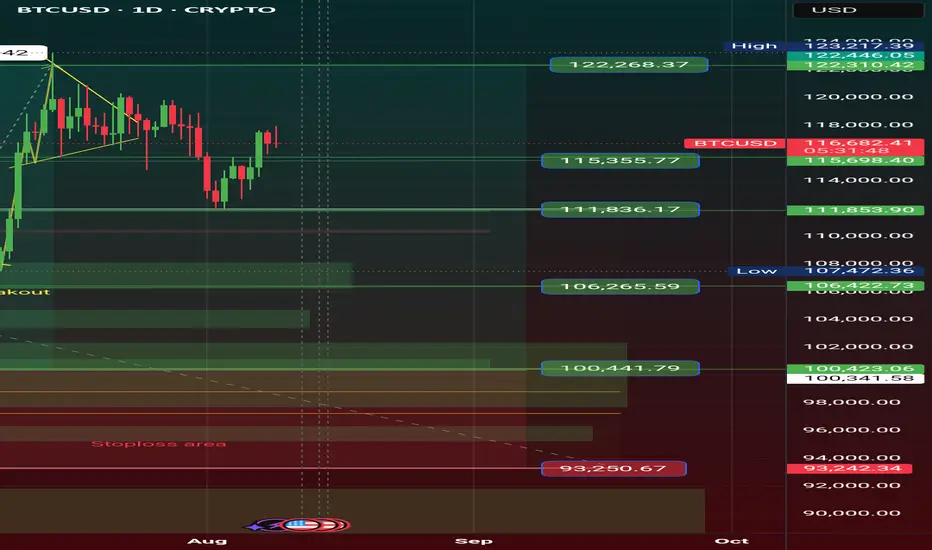
$BTC Finally Historical Profit Done at $123K Price of ATH CRYPTOCAP:BTC tying to push price upward movement and if it's Breakout the $120K-$122K Price Level area than it could be reached $128K - $136K price level area.
I'm guess it will be happened. Always Pattern indicate and say price movement of Bitcoin. I was many Prediction of popular coin and i will succeed in 2025. I'm long term analyst of long term investment of Traders.
🚦From News: Bitcoin Holds Firm Above $115K Support as Charts Point Toward $150K Target
Bitcoin holds above $115K support with charts pointing to a potential $150K Elliott Wave target.
Hashrate hits all-time high as energy value model places BTC valuation 45% above current price.
U.S. policy shift enables 401(k) crypto access, opening a $9 trillion market for Bitcoin adoption.
Bitcoin has held firm above the $115,000 support and is now showing signs of a large move on the charts. Price patterns and rising adoption trends are aligning as BTC prepares for a possible rally. At the time of writing, BTC was trading at $116,620, showing steady upward momentum.
Technical Structure Points Toward Upside Continuation
According to an analysis prepared by Lau, Bitcoin has taken the $115,000 support and may be preparing to break its all-time high. On Binance, the BTC/USDT daily chart displays a breakout from resistance near $116,438.79. The price reached a new high before retracing to $111,917.37, where it found support.
BTC’s price structure continues to show higher lows, aligning with the Elliott Wave pattern that targets $150,000. Key support levels remain at $98,385.45 and $89,326.51, confirming a strong technical base. According to Daan Crypto Trades, Bitcoin is steadily rising toward the $120,000 zone, where a cluster of stop losses and liquidation points may fuel further upside.
The current bullish flag formation is still intact, supported by the 50-day SMA at $113,154. The RSI has moved to 54, indicating recovering momentum without being overbought. Analysts view a break above $117,350 as a key signal for another upward push.
On-Chain Metrics and Market Drivers Support Growth
Bitcoin’s energy value stands at $167,800, which is around 45% above the current market price. According to Charles Edwards, founder of Capriole Investments, “Hash rates are flying and Bitcoin Energy Value just hit $145K.”
This model links BTC’s value to miner energy inputs and network security. Bitcoin’s hashrate reached an all-time high of 1.031 ZH/s on August 4, based on data from Glassnode. Alongside this, adoption is growing in the U.S. market.
President Trump’s policy allowing 401(k) crypto inclusion has opened a $9 trillion market. Crypto-linked equities and ETFs have also seen strong inflows, supporting long-term price action.
#highlights #everyone #premium #BinanceSquareFamily #Binance #BTC☀ #SUBROOFFICIAL
Disclaimer: This article is for informational purposes only and does not constitute financial advice. Always conduct your own research before making any investment decisions. Digital asset prices are subject to high market risk and price volatility. The value of your investment may go down or up, and you may not get back the amount invested. You are solely responsible for your investment decisions and Binance is not available for any losses you may incur. Past performance is not a reliable predictor of future performance. You should only invest in products you are familiar with and where you understand the risks. You should carefully consider your investment experience, financial situation, investment objectives and risk tolerance and consult an independent financial adviser prior to making any investment.
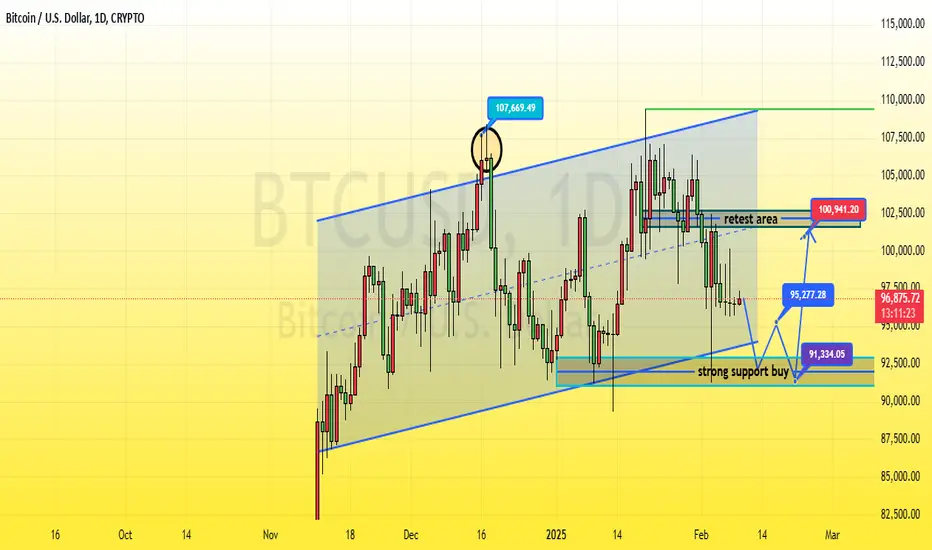
BTC/USD trend upward soon Bitcoin (BTC/USD) in an upward channel, with the price currently at 96,904.63. Key levels to watch:
- Support Zone: The strong support is around 91,334.05, where a potential buy opportunity could emerge.
- Retest Area: The price may also retest the 100,941.20 level before pushing higher.
If the price holds above the support, Bitcoin could rise back towards the 107,669.49 resistance.
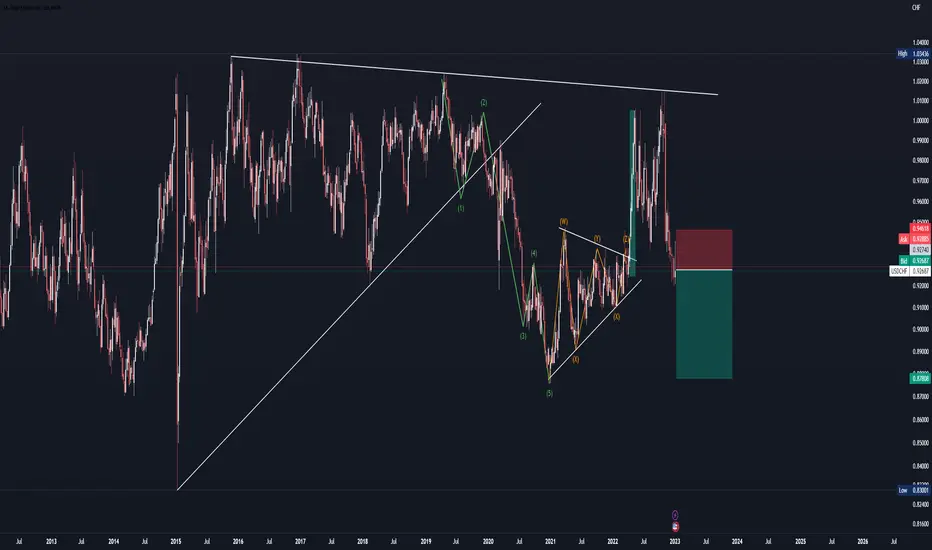
usd-chfI think about a USD-CHF in a time frame weekly I think reversal for down
and continues for down be careful for risk free and manage yore margine
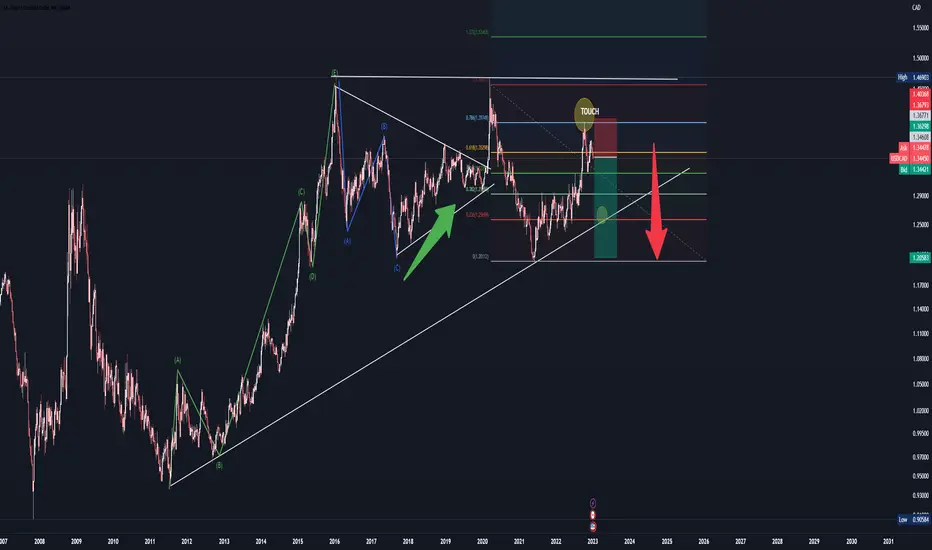
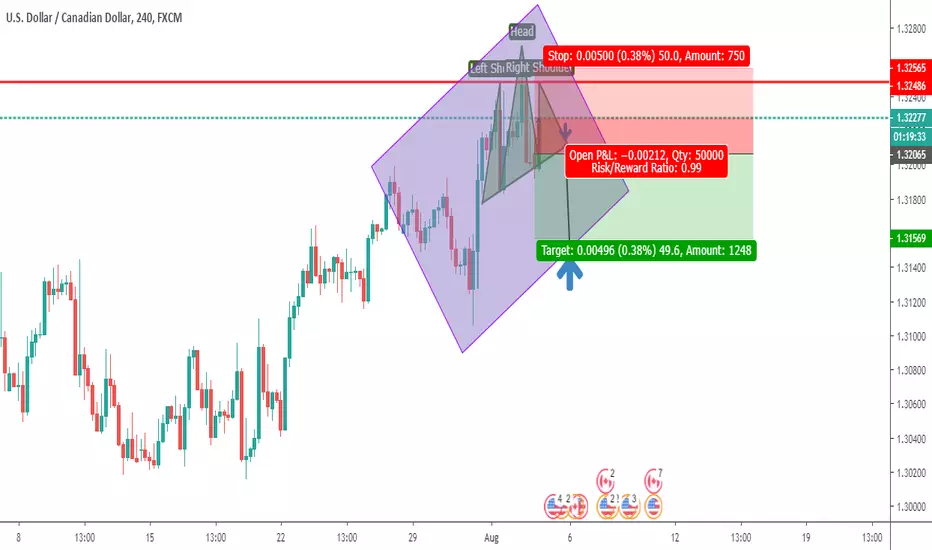
usd-cada simply analyzing just two trend lines (support and resistant ) and fib ret and touch level and reversal down I think the short position is the best idea for us-cad
GBPJPY (GJ)This is a beutifull trade gbpjpy, we wait to came the entry 167.769 for buy (Smart Money)
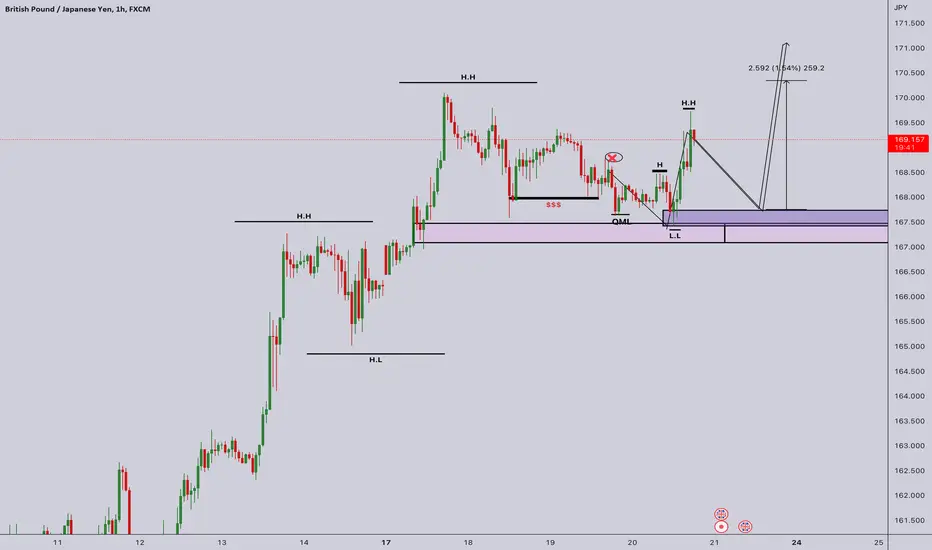
GBPJPY insight The market price violated our support, but couldn’t reach our demand region, instead it made a retest to our potential resistance(previous support)... now we’re expecting a short bearish impulse to the demand region... This will activate the aggressive bullish movement to break this ranging market or long correction and impulsively push up to form new highs...
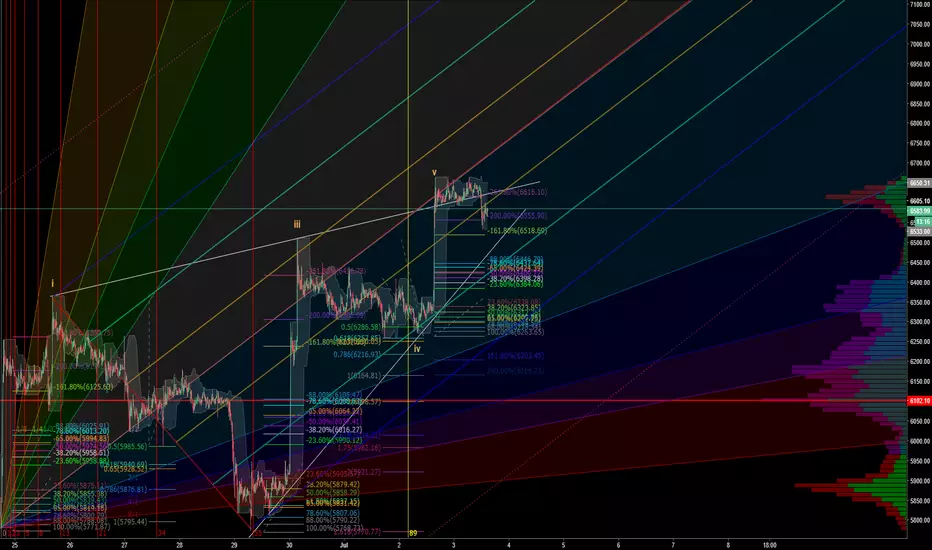
BTCUSD, since everyone wants to confuse the masses lets try!!!Pay for your calls?, they didn't catch this...receive signals? they didn't catch this either...listen to top analysts they didn't know either.Running best bot software in the world...ha! they did not catch this, my bet they will still not know..want a crystal ball?
Best to all i'm out!