HEAD AND SHOULDERSTHE FRACTURE MODEL “HEAD AND SHOULDERS”
The most well-known and, thus, the most convenient fracture model is H&S. Let’s review it in details, as other models appear its variations.
This key fracture model, as well as others, is a direct logical continuation and development of those statements connected with the tendency, which were discussed. Imagine a situation
when at the main ascending trend, successively increasing peaks and recessions gradually begin, which is called "slow down". As a result, the period of stagnation begins in the dynamics of the upward trend. At this time, the demand and supply on the market are practically balanced. When this distribution phase is completed, the support level that runs along the lower boundary of the horizontal "trade corridor" is broken. This is when a downward tendency emerges. It is formed accordingly by successive downward peaks and downturns.
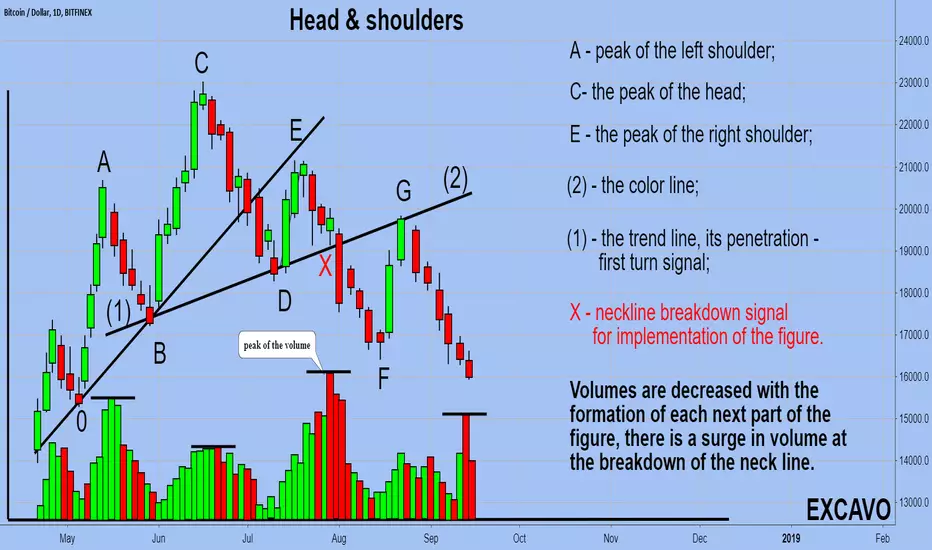
An example of the “head and shoulders” model for the peak of the market. The left and the right shoulders (A and E) are located on the same height approximately. The head (C) is higher than both shoulders. Pay attention that every next peak is accompanied by a decline in trade. The model is considered as completed when the closing price is fixed below the "neck" line (line 2). The minimum price point is equal to the vertical distance from the head to the neckline, which is laid down from the point of breakthrough of the neckline. With the subsequent rise, it is possible to return to the level of the neckline, but prices cannot cross it.
The price benchmark for the realization of this pattern can be determined by measuring the length from the highest point to the neckline and laying this distance after the breakout. But it should be noted that it will be a minimal price benchmark, as the reversal figure indicates a change in the trend, the beginning of the market pendulum move in the opposite direction, respectively, the goals can be equal to the entire length of the trend which was refracted.
Excavo
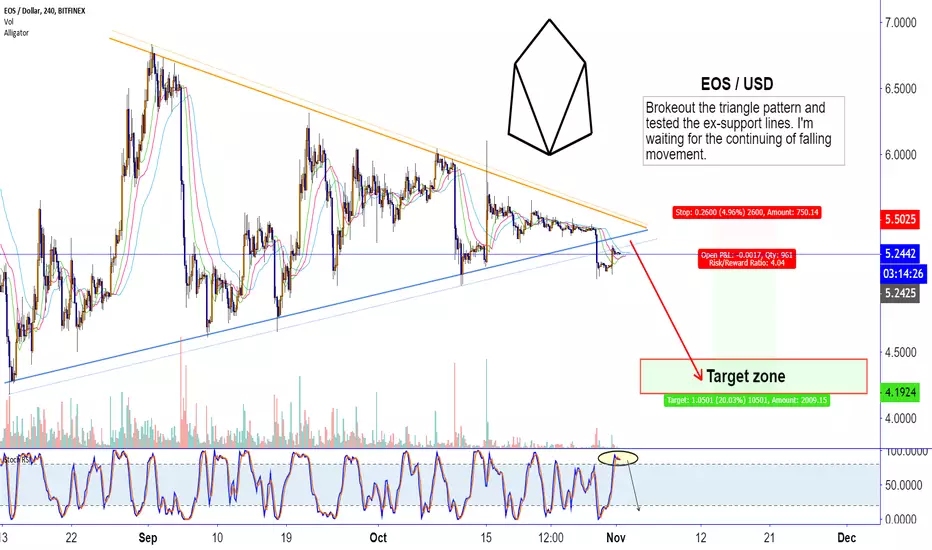
EOSEOSUSD
Brokeout the triangle pattern and tested the ex-support lines. I'm waiting for the continuing of falling movement.
Target ~ 4 - 4.5 $
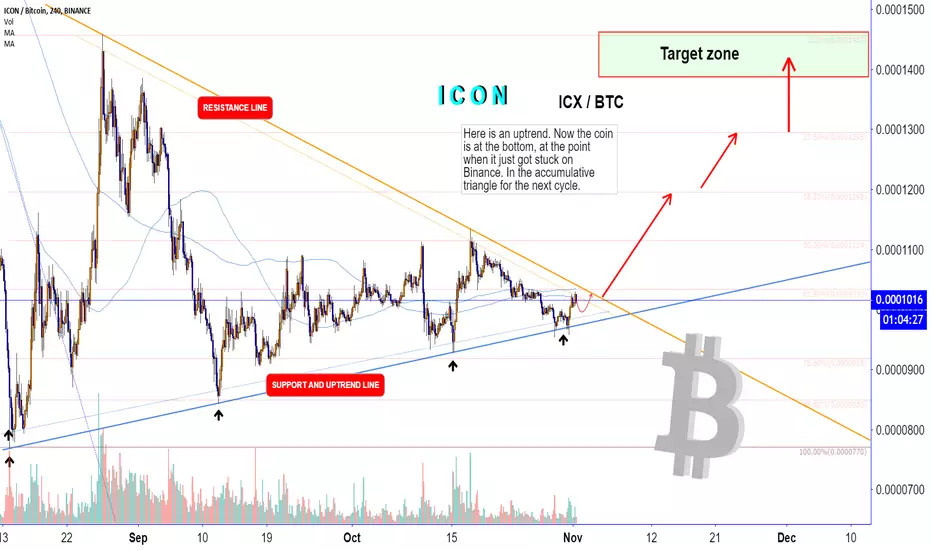
I C O NICXBTC
Here is an uptrend. Now the coin is at the bottom, at the point when it just got stuck on Binance. In the accumulative triangle for the next cycle.
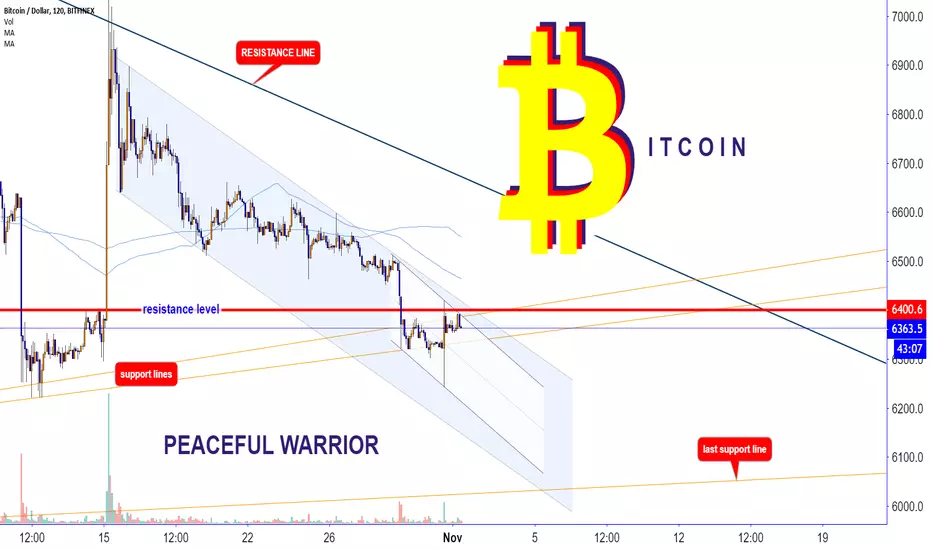
BITCOINBTCUSD
I note the resistance level of 6400, the price is currently between the support lines and downstream channels from October 15 and October 29. Last support line ~ 6100 by Bitfinex & Binance, ~ 6000 by Bitstamp. Also, don't forget about the big triangle.
Movement in the flat(sideway) continues on the daily chart.
Stoch RSI has crossed moving averages by 1W chart. It's strong signal to buy, but we have time for change or approve this crossing by the end of weekly candle.
Also we have dangerous cross between MA 200 with MA 500.
In 2014
Now 2018
Thank you for your attention. Share this analysis, LIKE and SUBSCRIBE ! I will give you a lot of useful information ! Have a nice trade.
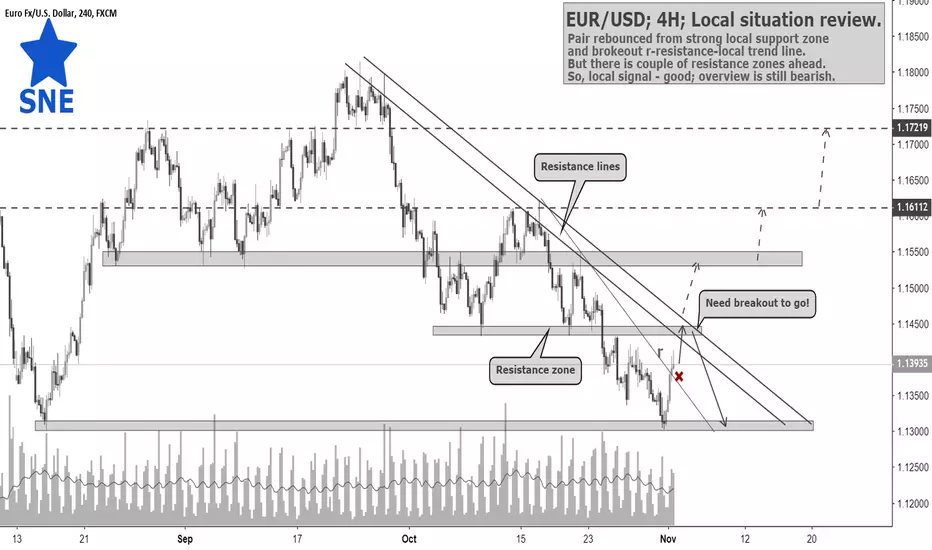
EUR/USD; 4H; Local situation review 01.10. by @SupernovaElitePair rebounced from strong local support zone
and brokeout r-resistance-local trend line.
But there is couple of resistance zones ahead.
So, local signal - good; overview is still bearish.
ICX/BTC; Binance; 1D; 31.10. by @SupernovaEliteThe simple rule of strong investors:
buy the deep - sell the high.
ICX - good project, now is in the deep -
good entry point for middle/long term position

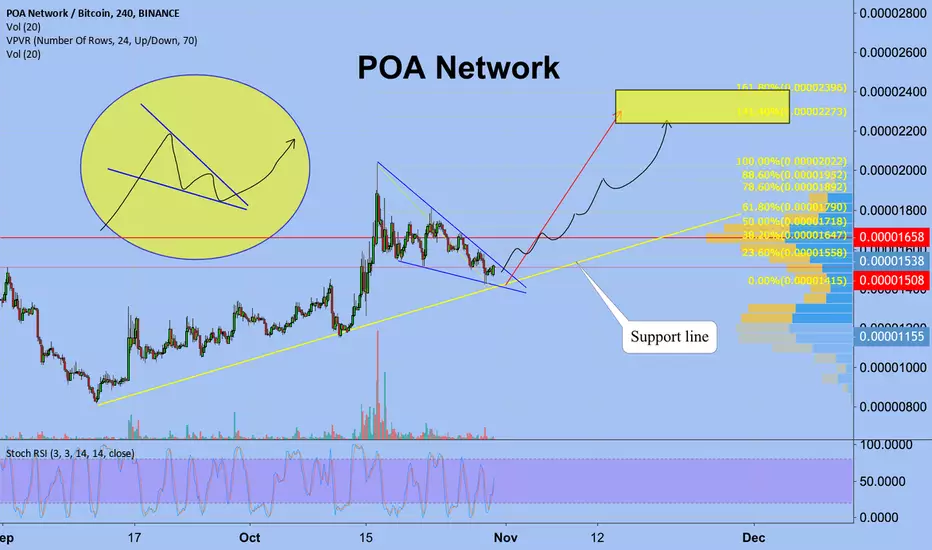
POA/BTC; Binance; 4H; 31.10. by @SupernovaElitePOA is in up-trend, brokeout of
continuation wedge-pattern from
Support zone. Good opportunity
for Long position.
Target - wedge length + 1.272 Fibo
extension level.
Dont forget about Risk-management!

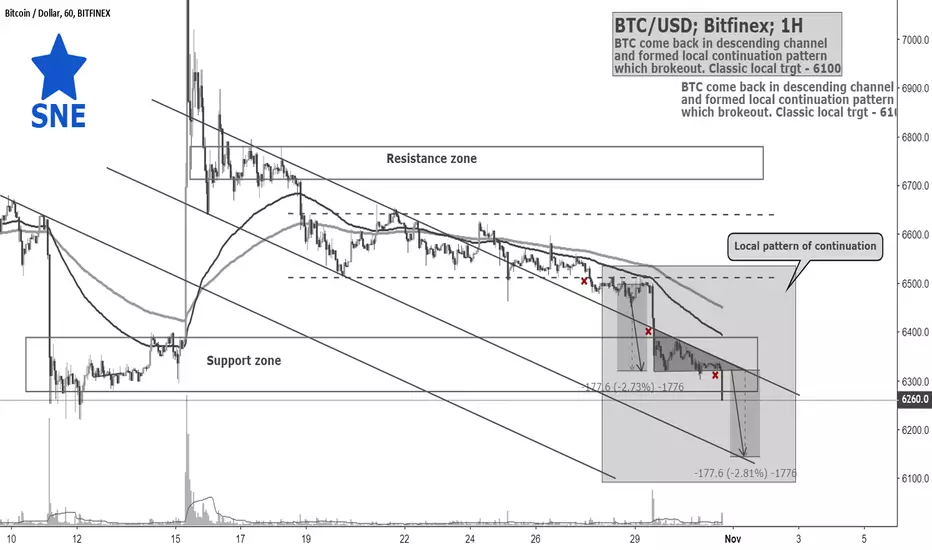
BTC/USD; Bitfinex; 1H; 31.10; review by @SupernovaEliteBTC come back in descending channel
and formed local continuation pattern
which brokeout. Classic local trgt - 6100
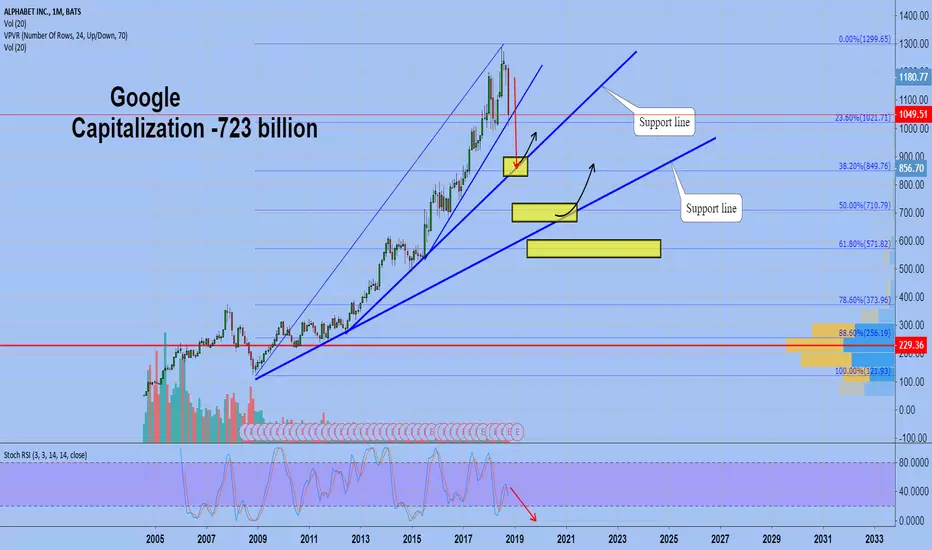
AppleStandart Elliott Wave. All stocks start to falling .
The main strategy in investing - buy at the bottom, sell at the top. Time to fix positions
Bear Rally Begins

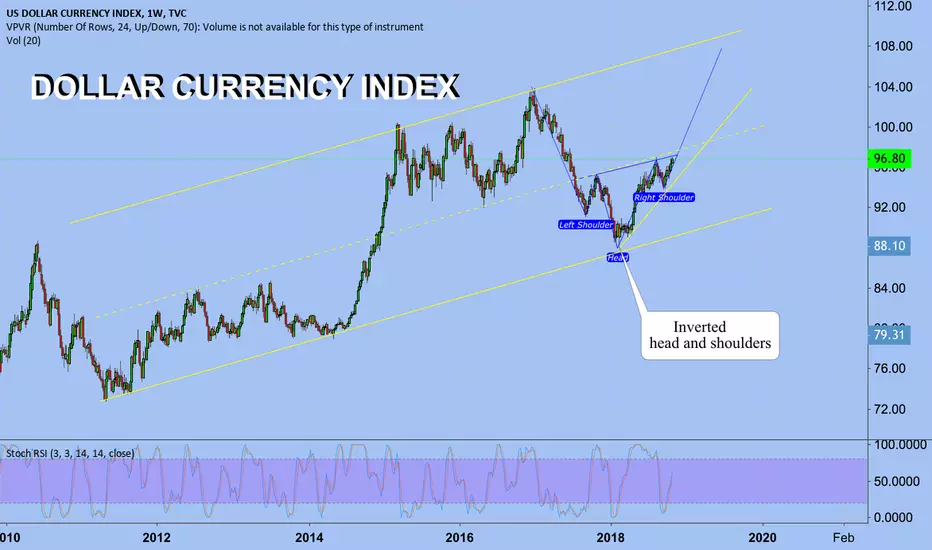
DXY Index DollarMoving in uptrend channel but now we are near middle line
Also I see inverted head and shoulders
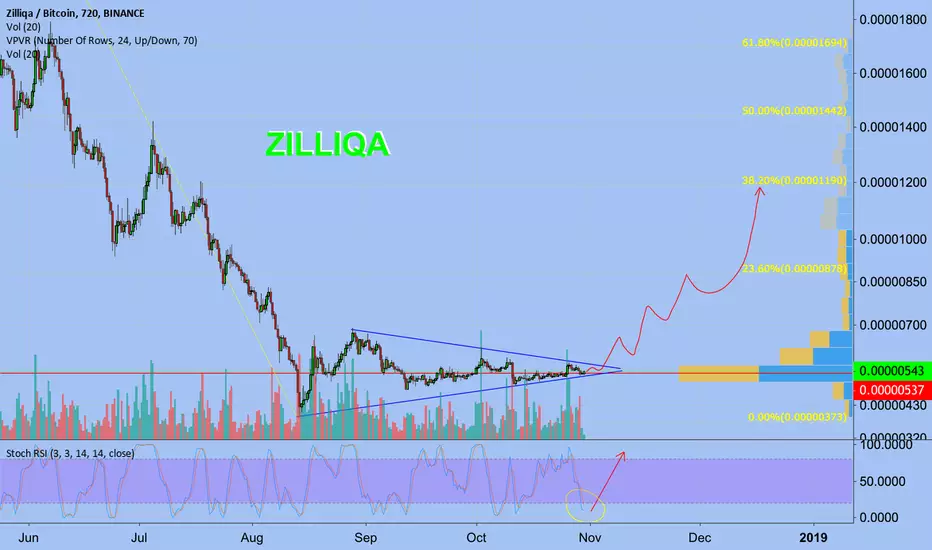
ZilliqaZILBTC
Zilliqa - the scalable and secure blockchain platform for hosting decentralized applications.
Very good project I add this coin in my portfolio
My strategy very simple as all big investors sell in high - buy in deep.
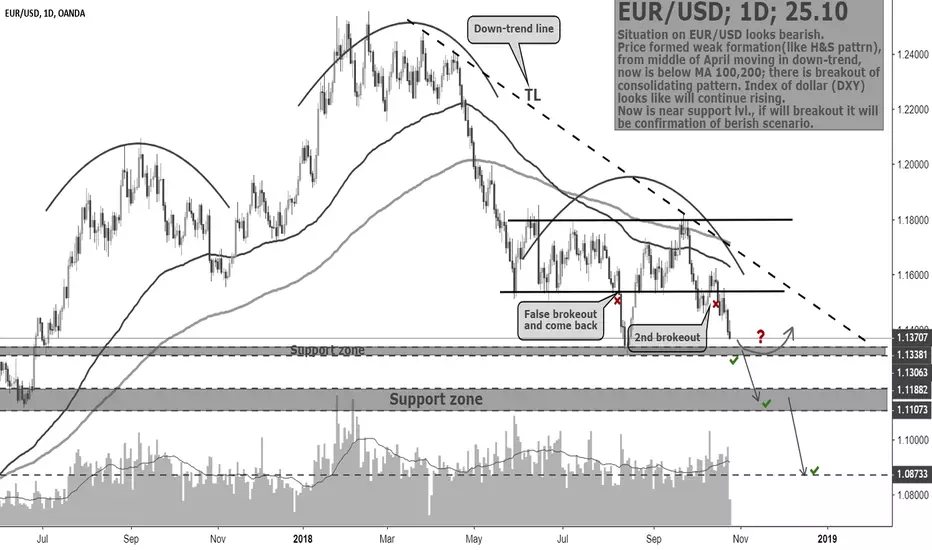
EUR/USD; 1D; 25.10 by @SupernovaEliteSituation on EUR/USD looks bearish.
Price formed weak formation(like H&S pattrn),
from middle of April moving in down-trend,
now is below MA 100,200; there is breakout of
consolidating pattern. Index of dollar (DXY)
looks like will continue rising.
Now is near support lvl., if will breakout it will
be confirmation of berish scenario.
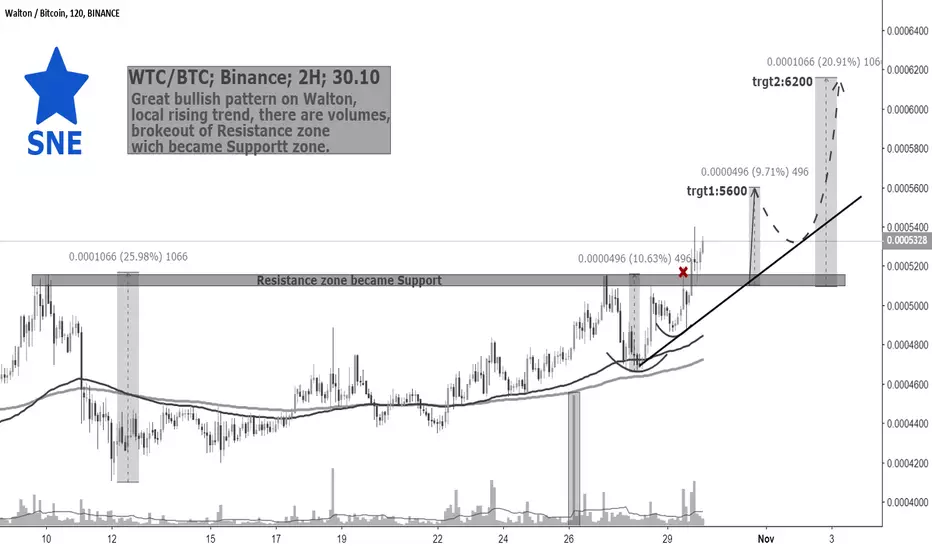
WTC(Walton)/BTC; Binance; 2H; 30.10. by @SupernovaEliteGreat bullish pattern on Walton,
local rising trend, there are volumes,
brokeout of Resistance zone
wich became Supportt zone.
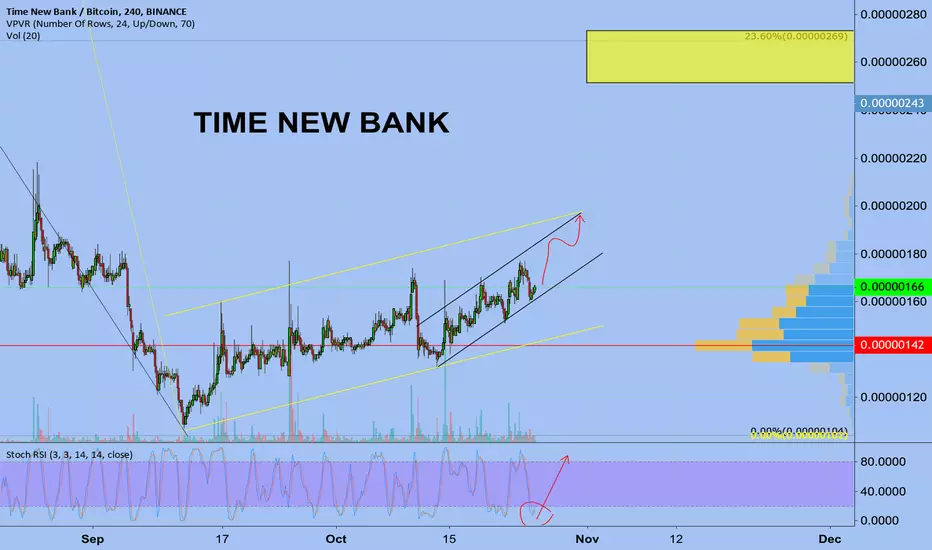
TIME NEW BANKTNB now in bottom and we in accumulation zone. We moving in up trend channel.
Just touched support line and go to the resistance line first
Good time to buy in deep for swing trading - position trading
NEWS
On October 24, 2018 (SGT), MiaoA, the world’s first time trading platform launched a new project, “individual digital time” of Bowen Pan (a well-known advisor and planner of the global blockchain training), which was officially launched and started trading.
medium.com
The “MiaoA Koi” event will run from October 23, 2018 to October 30, 2018.
medium.com
USDCHF Bearish Rising Wedge.ANALYSIS :
The long running Bullish Trend of USDCHF is about to end with a Bearish Rising Wedge.RSI is also showing Divergence indicating the end of Bullish Trend.So when the breakdown start, We will short USDCHF for about 1400 pips, don't miss it.
INDICATORS :
1. RSI
2. MACD
3. Moving average 20, 50,100
GOOD LUCK
FOLLOW Me for more ideas....
Leave a Like , Comment if you Agree

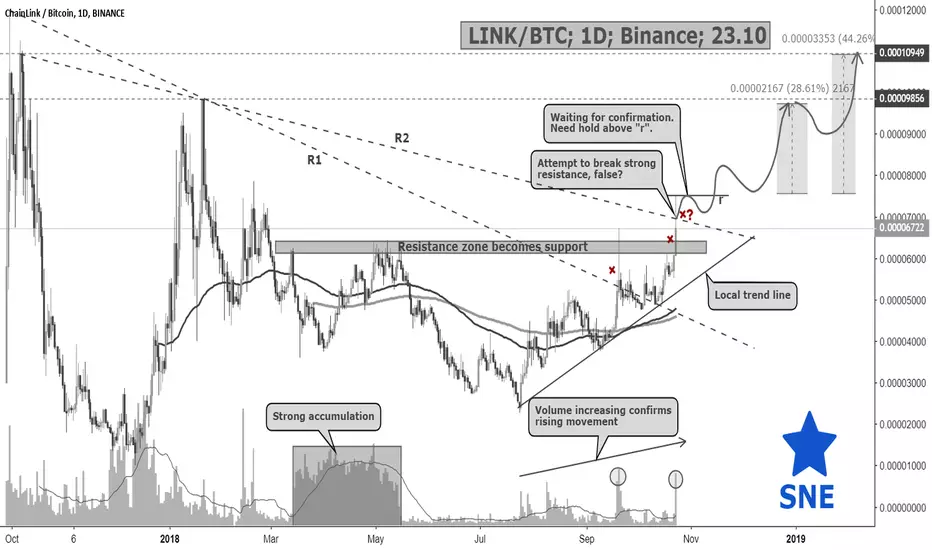
LINK/BTC; 1D; Binance; 23.10 by @SupernovaEliteFrom March 2018 to May 2018 there is big volume on LINK that looks like accumulating position by big players, then was breakdown and now formed local rising trend which realising with big volume impulses. Price brokeout R1 resistance then brokeout R2 but corrected. For confirmation of continuation LINK need next impulse and hold above r-local resistance. If we will see that - we can accumulate position for middle-term trade with 28% and 44% targets.
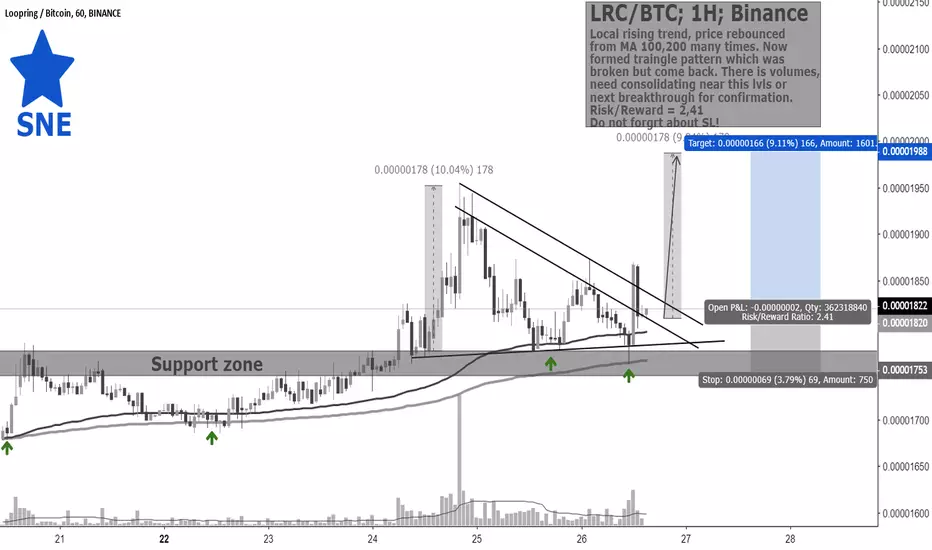
LRC/BTC; 1H; Binance; 26.10. by @SupernovaElite. Potential 10%!Local rising trend, price rebounced
from MA 100,200 many times. Now
formed traingle pattern which was
broken but come back. There is volumes,
need consolidating near this lvls or
next breakthrough for confirmation.
Risk/Reward = 2,41
Do not forgrt about SL!
EURAUD Bearish Cup and Handle. SHORTTECHNICAL ANALYSIS
Hey Guy's what's up! There is a Cup and Handle in EURAUD. So when the breakdown starts. we will short it.
First target = 1000 pips.
Second target = 1600 pips.
INDICATORS USED
1. MACD
2. RSI
3. SMA
GOOD LUCK
FOLLOW Me for more ideas....
Leave a Comment , Like if you Agree

GBPUSD Bullish Cypher. TECHNICAL ANALYSIS
Hey Guy's whats up! We saw Bullish Cypher in the GBPUSD. It is in right leg of it's completion. After completion It will be bullish.It has about 2000 pips profit potential. So don't missit.
INDICATORS USED
1. MACD
2. RSI
3. SMA
GOOD LUCK .
FOLLOW Me for more.....

USDJPY shortTECHNICAL ANALYSIS
Hey Guy's whats up ! Since few days USDJPY is running in a parallel channel.and we are looking to short it for about 600 pips.There is a HEAD and SHOULDER in short time frame. don't miss it.
INDICATORS USED
1. MACD
2. RSI
3. SMA
GOOD LUCK
FOLLOW Me for more....

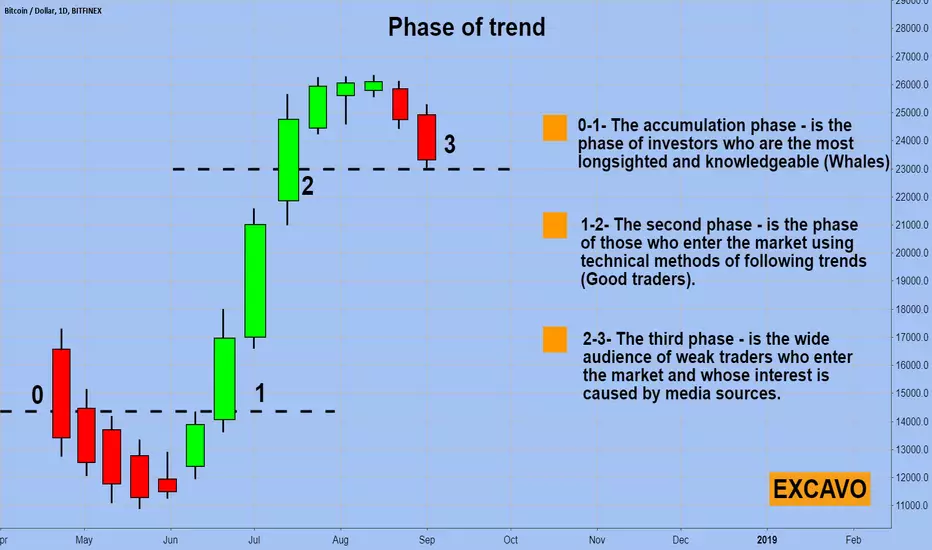
Phase of trend Three phases of the trend.
The main trend has three phases. Usually, three phases can be distinguished within the development of the main trend. The first phase, or the accumulation phase, emerges when the most far-sighted and informed investors begin to buy, since all the unfavorable economic information has already been taken into consideration by the market.
The second phase occurs when those who use technical methods for following trends join the game. Prices are already rapidly increasing, and economic information is becoming more and more optimistic. The tendency enters its third or final phase, when the general public comes into action, and the rush begins in the market, fueled by the media.
The newspapers write about the "the finest hour of the bulls," economic forecasts are filled with optimism, the number of speculation increases. And those informed investors who “have been accumulating” during the exit of the bear market, when no one wanted to buy, begin to “distribute”, that is, to sell, when everyone, on the contrary, is trying to buy.