Bullish Energy in Natural Gas: -DMI Extreme + Wedge BreakoutThe Spark in the Gas Market
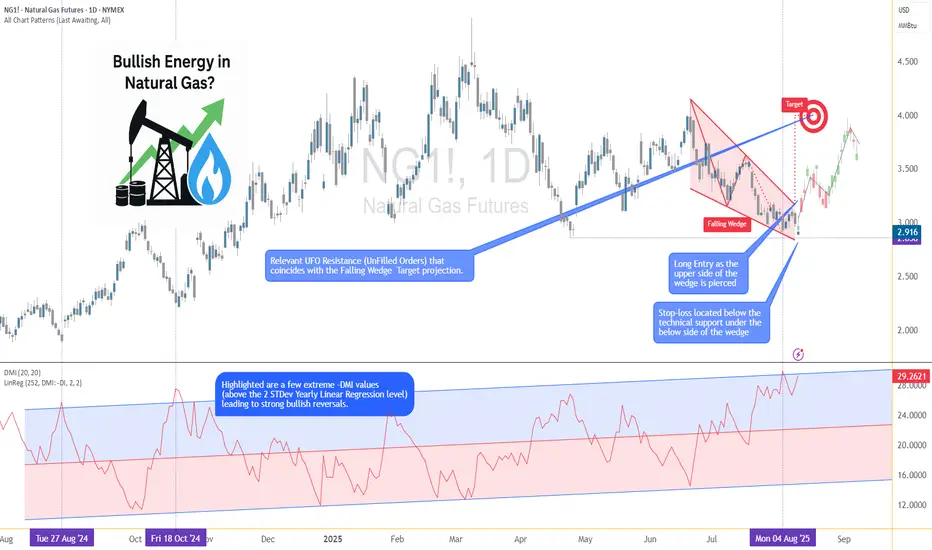
Natural gas has been quietly simmering in recent weeks, building pressure beneath a surface of consolidation. Traders watching closely will have noticed a rare alignment — one that history shows can potentially precede outsized moves. We’re talking about the convergence of two powerful signals: a -DMI yearly extreme and a falling wedge breakout.
In the past, this combination has marked moments when bearish momentum had run its course, giving way to swift and decisive bullish reversals. Now, that same alignment is flashing again, inviting a closer look at the technical landscape and the potential opportunities it presents.
Why This Setup Matters
The -DMI (Directional Movement Index) measures the strength of downward price moves. When it pushes beyond two standard deviations above its yearly linear regression channel, it signals an overextended bearish phase. Historically, these extremes have often coincided with market bottoms in Natural Gas Futures.
Layer on top a falling wedge — a bullish reversal chart pattern — and the probability of an upside move gains weight. The wedge compresses price action into a narrowing range, reflecting reduced volatility and setting the stage for a potential explosive breakout once resistance gives way. The current breakout level sits near 3.18, with technical projections aligning closely to a well-defined UFO resistance (UnFilled Orders) zone around 3.90.
The Technical Story Unfolds
Looking at the daily chart in the present, the -DMI has recently breached the +2 standard deviation boundary of its 252-period regression channel — a rare occurrence that, as said, has preceded multiple major bullish reversals in the past year. When this condition appeared, downside momentum often faded, making room for buyers to take control.
This time, the current signal aligns with a falling wedge that has been developing for weeks. Price is about to break above the wedge’s upper boundary at approximately 3.18, suggesting a potential trend reversal.
The Trade Blueprint
Direction: Long
Entry: 3.18 (confirmed breakout above wedge resistance)
Target: 3.90 (wedge projection + UFO resistance)
Stop Loss: 2.858 (below wedge and technical support floor)
Reward-to-Risk Ratio: ~2+ to 1
This structure allows traders to define risk tightly while targeting a meaningful upside move. The setup applies equally to both Natural Gas Futures (NG) and Micro Natural Gas Futures (MNG), offering flexibility in capital allocation. For smaller accounts or those wanting to reduce margin exposure, the MNG contract delivers the same tick size precision with only one-quarter of the notional value.
The Contract Advantage
Natural Gas Futures (NG) represent 10,000 MMBtu per contract, with a minimum tick size of 0.00025 — equivalent to $2.50 per tick.
Micro Natural Gas Futures (MNG) are one-tenth the size at 1,000 MMBtu per contract, with the same 0.00025 tick size equaling $0.25 per tick.
Margin requirements vary with volatility and exchange adjustments, but at the time of writing, the CME lists initial margin for NG in the range of $3,500 per contract, while MNG margins are proportionally lower at $350 per contract. This creates flexibility for traders to scale positions or manage risk without altering the technical logic of the trade. Both contracts trade nearly 24 hours per day, Sunday through Friday, offering the ability to react to global energy market shifts in real time.
Risk Management as the Safety Valve
Defining risk is the cornerstone of any trade plan. The stop loss at 2.858 is not arbitrary — it sits below both the wedge’s lower boundary and a nearby technical support level. If price were to close below this level, it would undermine the bullish thesis and call for an exit.
Using smaller MNG contracts can help align risk with account size, allowing for partial position scaling and better drawdown control. Equally important is avoiding undefined risk scenarios, particularly in a commodity as volatile as natural gas. Precision in both entries and exits reduces exposure to intraday whipsaws while maintaining the trade’s structural integrity.
Closing the Loop
The natural gas market has aligned a rare set of conditions — a -DMI yearly extreme and a falling wedge breakout — each of which has historically preceded significant upside moves on their own. Together, they offer a compelling technical case for a defined, risk-managed long position targeting the 3.90 zone.
While no setup guarantees success, this one seems to offer clarity: a well-defined entry, stop, and target, supported by historical probability and pattern structure. In volatile markets, those moments of clarity are worth paying attention to — and acting on with discipline, and always depending on the trader’s trading plan.
When charting futures, the data provided could be delayed. Traders working with the ticker symbols discussed in this idea may prefer to use CME Group real-time data plan on TradingView: tradingview.sweetlogin.com - This consideration is particularly important for shorter-term traders, whereas it may be less critical for those focused on longer-term trading strategies.
General Disclaimer:
The trade ideas presented herein are solely for illustrative purposes forming a part of a case study intended to demonstrate key principles in risk management within the context of the specific market scenarios discussed. These ideas are not to be interpreted as investment recommendations or financial advice. They do not endorse or promote any specific trading strategies, financial products, or services. The information provided is based on data believed to be reliable; however, its accuracy or completeness cannot be guaranteed. Trading in financial markets involves risks, including the potential loss of principal. Each individual should conduct their own research and consult with professional financial advisors before making any investment decisions. The author or publisher of this content bears no responsibility for any actions taken based on the information provided or for any resultant financial or other losses.
Extreme
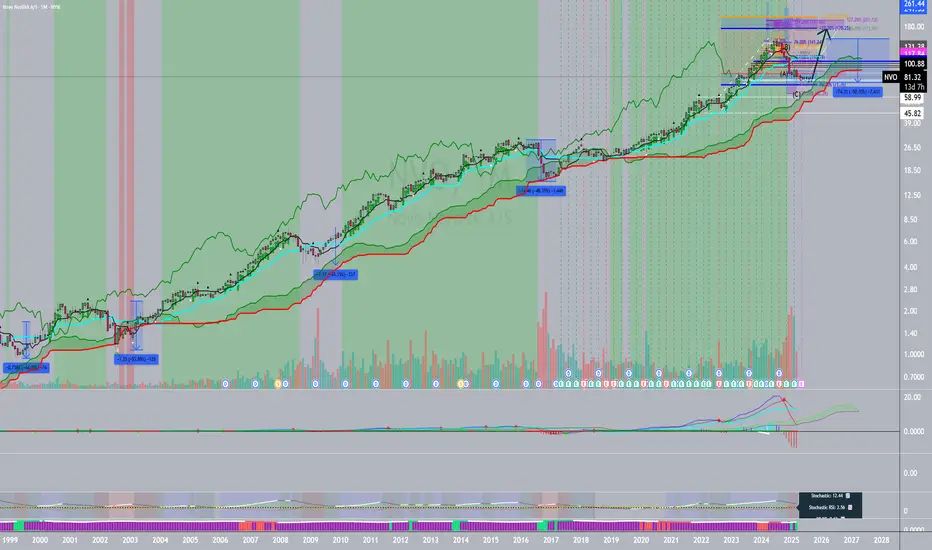
Novo Nordisk: 50% Drops Lead to Amazing GrowthFundamentals :
Take a look at NVO in 1999-2000, 2003, 2008, 2016 and June 20024-2025. Every time it dropped about 50%, that lead to a huge rally for years! NVO has secured contracts with Medicaid for their diabetes and other drugs. It is not going anywhere. It has fallen 50%. We either hold or buy more.
Technicals :
uHd + extreme indicator +u3 volume last month +horizontal support + a-b-c + key fib pb
Projection: 200 to 250 within two years, tentatively.
RSI Trends and Extremes with Color-Fill
What is the RSI Color Extremes Script?
The RSI Color Extremes Script is a different take on the traditional RSI. With a shorter period setting, short-term trends and extremes can be detected.
How is RSI Color Extremes different from the traditional RSI and Connors RSI (CRSI)?
While the traditional RSI is 14 periods, the default setting for this script is 2 periods. The 2-period setting was borrowed from Connors RSI (CRSI) where 2 and 3 periods are used, however, the interpretation here is different. Credit goes to user fikira as this is a different take on his/her original script. The period setting is adjustable.
How to use the RSI Color Extremes Script
When the RSI(2) crosses above the 70 line, this is a buy signal, when it crosses below the 30 line, this is a sell signal. As the intensity of the green color increases this indicates a strengthening of an up-trend. As the intensity of the red increases, this indicates the a strengthening down-trend. Extremes of above 95, (the red dotted line), or below 5, (the green dotted line) are rarely reached and can be viewed as potential reversal points or proactive profit taking.
This script can be used with other indicators (Stochastic, moving averages, or MACD for examples) for confirmation or confluence of indicators.
Settings:
* The default setting is 2 periods
* color intensity increases as the indicator rises or falls
* The period setting is adjustable.
Observations:
* Not all signals lead to major moves. However, all major moves give this signal. it is important to use other indicators for confirmation.
* setting alerts on the indicator (crossing above 70 or crossing below 30) can be a good way to identify early potential trends.
* The script works on any security and in any timeframe.
The period setting is adjustable.

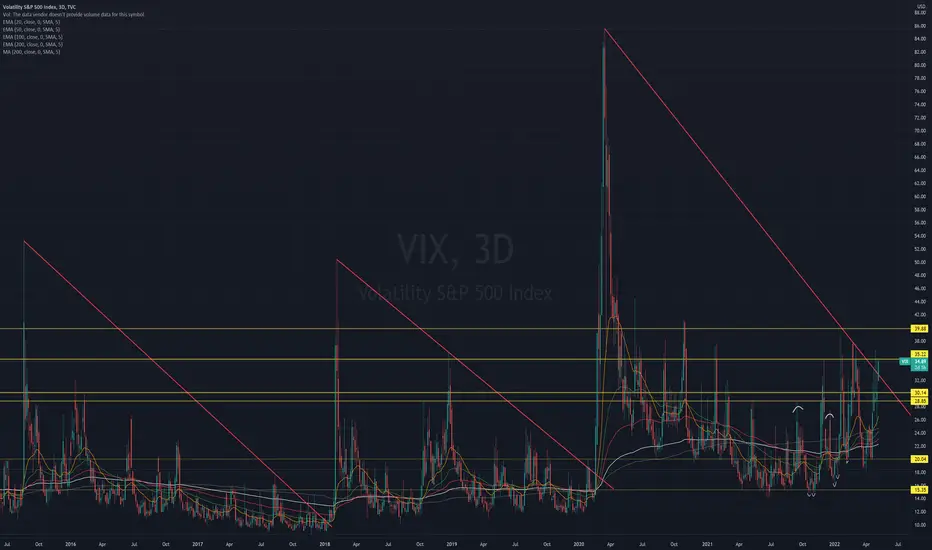
THE VIX IS BREAKING OUT (way too early)The VIX broke out of that major downtrend structure on a daily basis today for the first time in this whole correction. This is a pretty sign for now, Volatility could rallye exremely hard from here... Watch out, things could get somewhat bumpy from here on..
Apple Testing Support Ahead Of EarningsBack to the basics & a reminder that I am a swing trader and I have bought my puts for this dip
Trend Analysis:
Candlestick analysis shows a sideways trend.
Will the impulsive high continue or will we see a decline to a higher low?
I free handed some trend lines and as you can see, X^2's high gave me X^1's level of support which is shockingly the level of support shown by the Kurotoga cloud.
X^2's level of support is possible but highly unlikely
However we should expect to see X^1's level of support tested as the Kurotoga Cloud backs it up.
I am shocked by this because I put the cloud script in after I free handed and am pleased with the accuracy

Extreme Networks - 20% upside (EXTR)After years of M&As, company is finally making a comeback. 20% gap to be filled soon.. get in get out
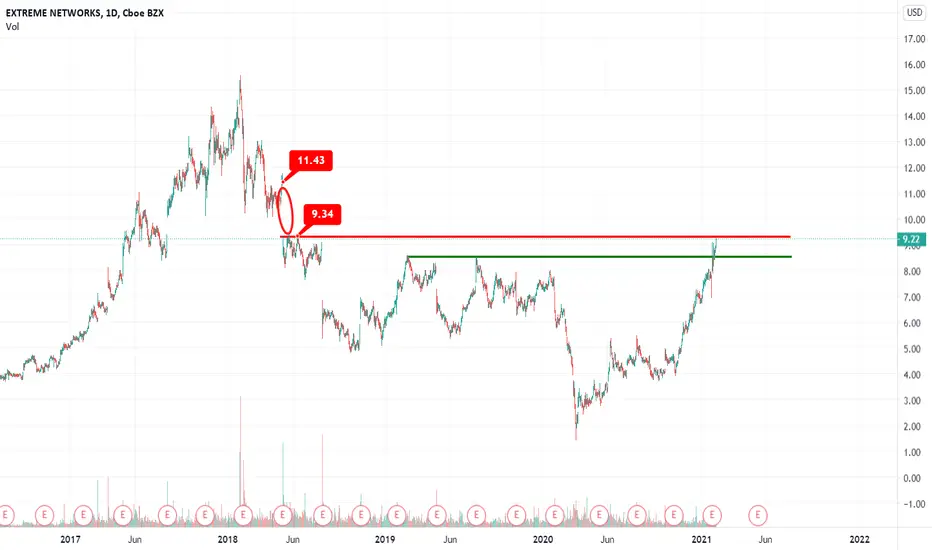
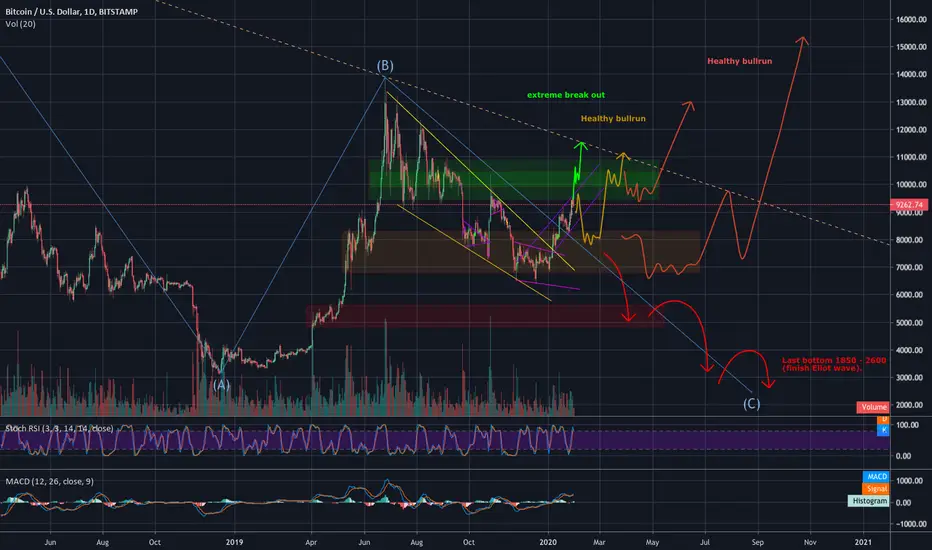
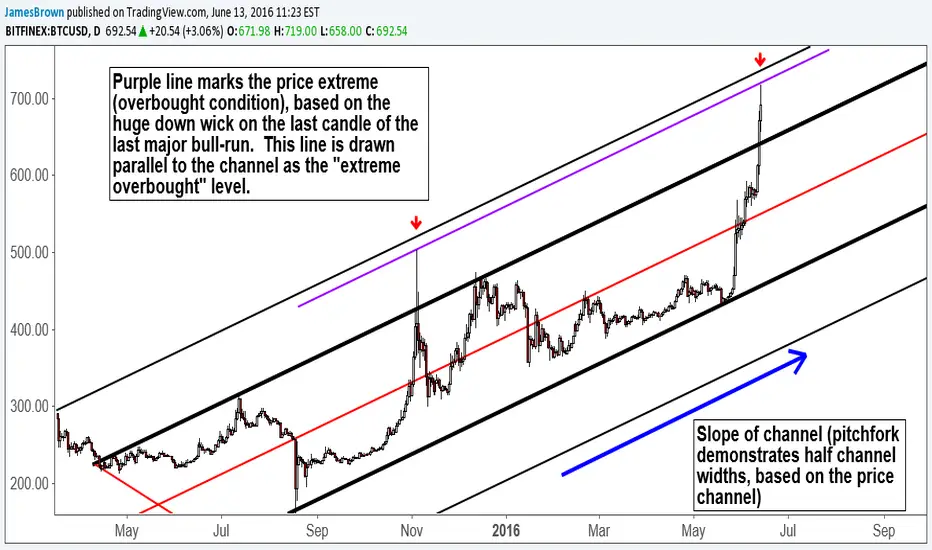
Exciting and interesting moments. Some mid term scenario's: from extreme bullish to finding the last bottom:
Small triggers can be enough to create a fast break out, followed by an early FOMO reaction. We are really close. The other extremely scenario is a pull back to the down trend again. Not a very likely, but there is even a small change we need to finish the Eliot wave and find the very last bottom.
I really hope to something in between, so we can build up a strong fundamental base for a healthy bullrun in the next 1.5 year. A longer period for the bullrun is even better to give bitcoin and alts the change to improve their technology and acceptation by institutions and governments.
Lets see what comes folks!
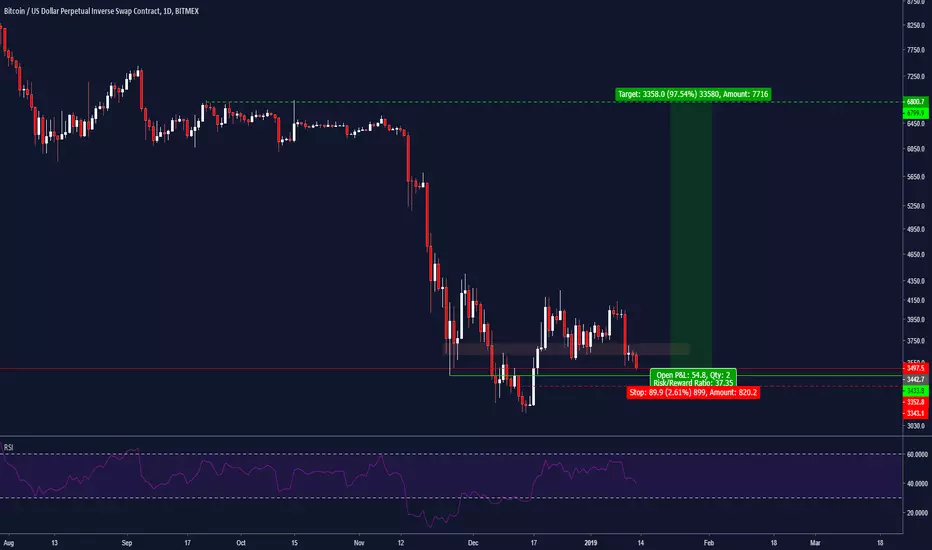
Ultimate Chad style 60R scalp on btc [Gone Sexual]The ultimate FOMO inducing HL is forming.
Eventually it will lead the way out of disgustingly oversold 3k pricing and back to the just levels of 6k. where we will spend rest of the Q2.
Bears will cry the tears of thousand soys and their girlfriends will leave them for the chad bulls in new miatas - that'sa fact!
Bottom shorters won't be able to afford rope and CNBC will be seen posting 1k calls shortly before the first glorious impulse upwards, you better bet on it, nerds.
I have deployed debt and overleveraged all my assets in order to x50 this trade and make more money than man previously thought is possible, If you have a good offshore package to sell me dm!
Hold on to your tendies, boys!
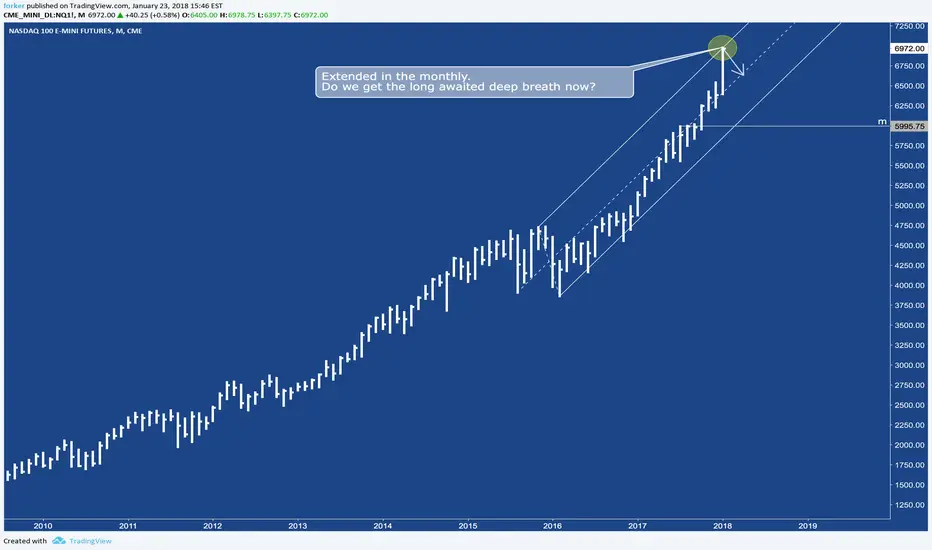
Nasdaq - NQ at the upper extreme.The monthly shows us that the NQ is stretched.
Let's see what's going on from here...
P!
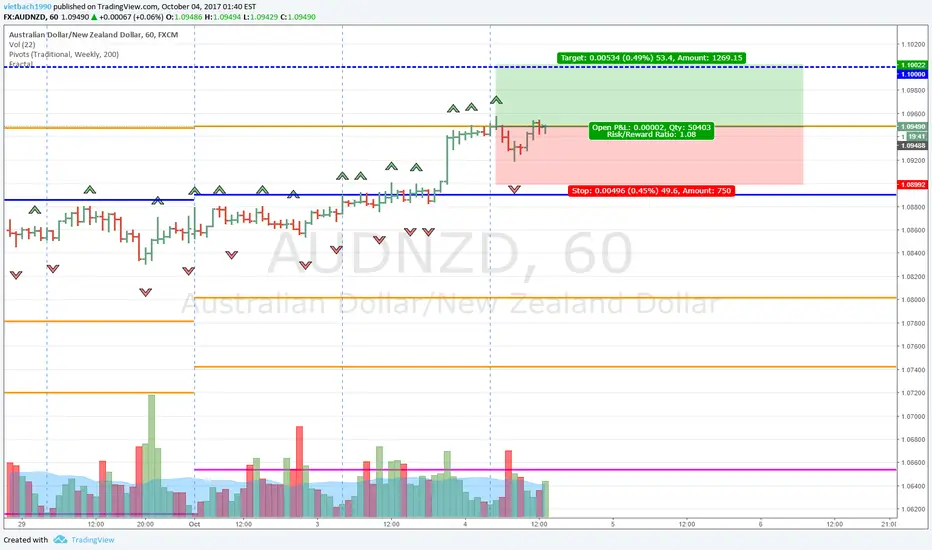
Short AUDNZD - Contrarian Bet vs RetailThis is a small experiment trade where I isolated the Retail Positioning factor:
Retail is extremely net Long AUDNZD and today is a non-event day for this pair so I'd like to bet against this.
This is an experiment trade that I put on with 1/5 the usual risk.
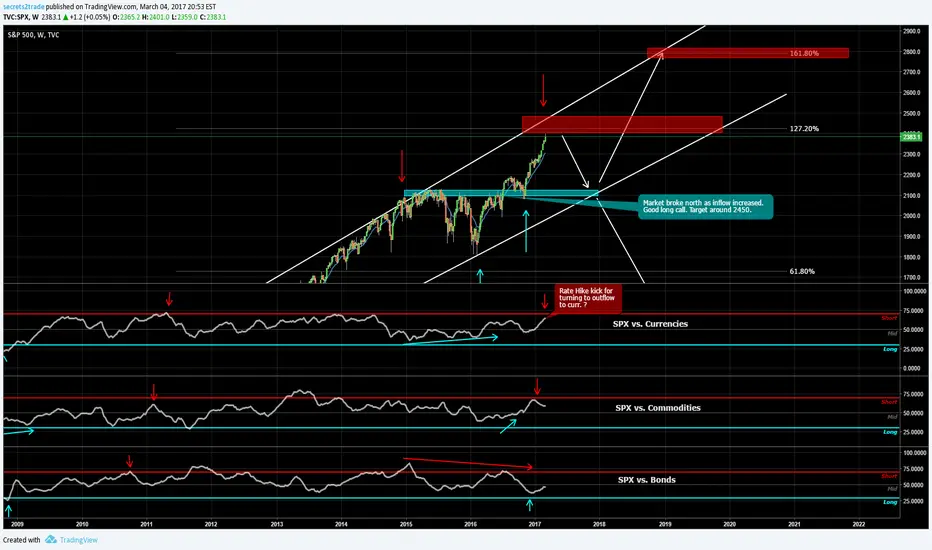
SPX turning point soon?Hello traders,
Today we want to share with you our TVC:SPX perspective as it starts to flirt with a very decisive zone at around 2400-2450.
Currently market seems to be a very decisive level for the market weather bearish sentiment will kick in soon or not.
Current fundamental important facts to consider:
FED rate hike (rate odds jumped in previous days significant higher as they currently are in 79.7% ( CME FED watch) for a march rate hike of 25 basis points. As Yellen spoke on Friday she mentioned to watch very closely at next Fridays NFP. They might be significant for a March rate hike.
Of course another factor to mention is the huge influence of President Trumps policy as it may effect further gain within the stock market in several sectors. However, keep in mind that investors sentiment sometimes act before certain policies are taking place.
As we look at our intermarket indications we need to be careful, as they currently still warn for a potential downside moves.
We always mention the importance of intermarket flows, as we believe that investors only repark their money due to sentiment and global macro-economic conditions. Therefore, we always keep in mind the in-and outflows with the help of our intermarket indications that lead us towards better timing when making a trading decision. As you might know that timing is one of the most important things when it comes to trading together of course with risk/money management.
As seen in the chart, two of our three intermarket indications already moving in extreme areas territory which might indicate a soon outflow of capital to other asset classes. We always take into account the BIG 4: Currencies , Bonds, Stocks and Commodities. Only the SPX/Bonds ratio shows still more potential to the upside. Investor may still move their capital to indices from Bonds. This action has still not reversed to reach its extreme on the flip-side!
Looking at the technical perspective and current trading range, we have seen an extreme up-rally in the TVC:SPX throughout the whole year so far. It currently trades at 2383 with its all-time at 2401. If Yellen gets supported by +VE US NFP figures on Friday, we might see some volatile movements around that current trading range. Additionally, very important key factors to consider is the current policy of Trump. His tax plan, infrastructure plan and his borderline tax ideas could influence the TVC:SPX significantly. We will keep you updated with that!
So, summarizing everything together, we believe that TVC:SPX is currently at a very decisive zone and we need to take care. We will closely watch the actions of investors in terms of capital movements and the fundamental perspective within the FED rate probability. All these factors together we are currently at mid-term turning points where a move to the downside is also possible!
Either way we will keep you updated with possible trading setups!
As always, trading is a probability game nobody is 100% right and always use a stop-loss when trading. Trade with care.
We wish you much success,
The Secrets2Trade Team
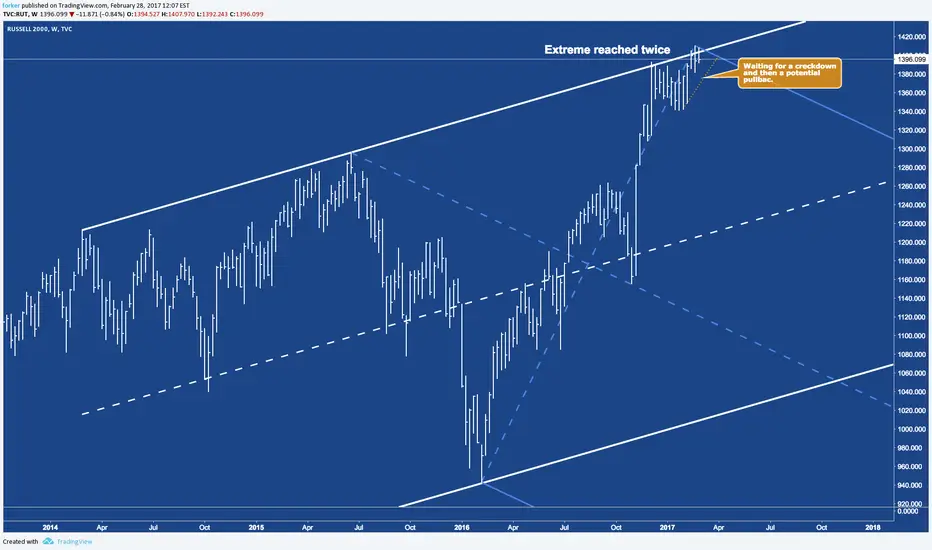
RUT - Russel nerve wreckingIt's a tiny little bit nerve wrecking with the RUT and others too.
So far nothing to do, just observing.
I wait for a potential break of the small trendline, then observe further, waiting for a potential pullback.
standby...
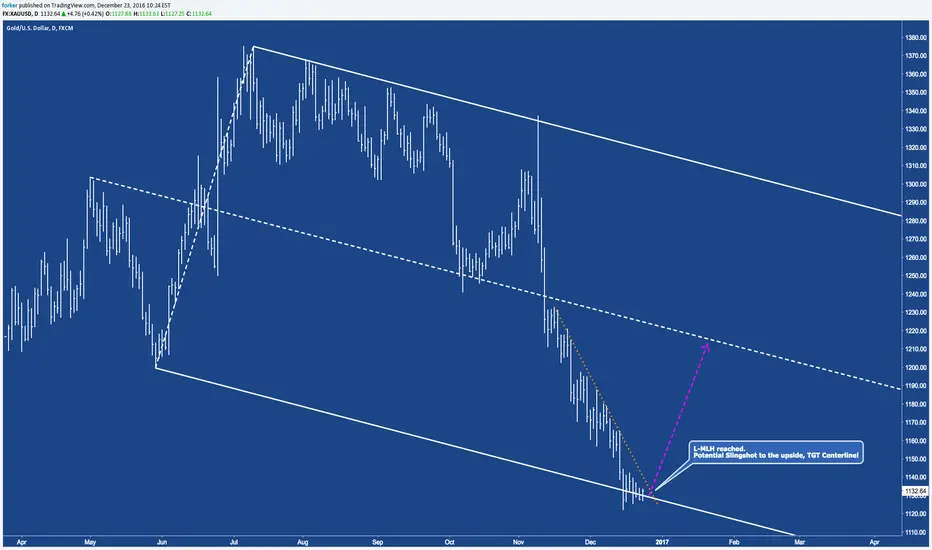
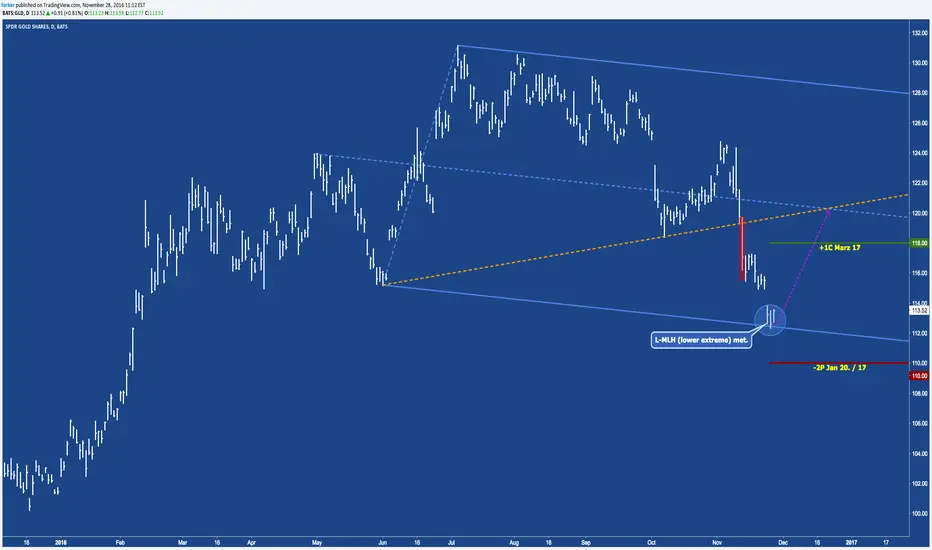
XAUUSD - Lower Exteme Creates A SlingshotSo here we are at the lower ML-H.
Tis is the extreme according to the movement of this product.
I highly expect a potential slingshot up to the Centerline.
Happy Christmas & Peace!
GLD - The lower extreme is reached...turn ahead.The lower extreme is met.
Now we have a high potential to turn and go north.
Sold 2 puts and bought 1 call with 109 DTE.
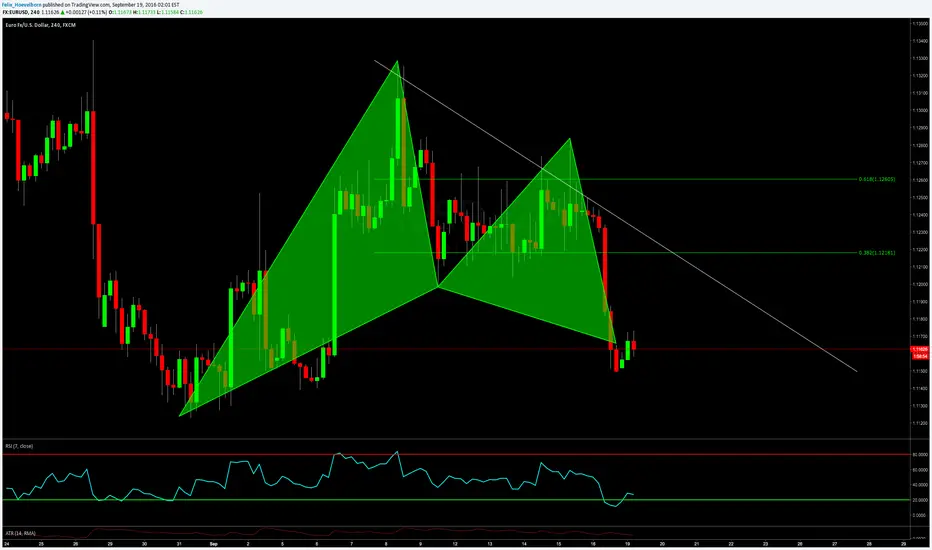
Bullish GARTLEY on EURUSD @ MARKETNot too much to say. Advanced Gartley Formation on 4h chart. Looking for 38,2% and 61,8% retracements as potential targets. Stops have to go below X.
Good trading
Website: www.ogtpartners.com
Twitter: goo.gl
Facebook: goo.gl
High - Low Bollinger Bands These work better than the standard Bollinger Bands for setting extreme ranges.
What I use these for is to use an oscillator to find an buy / sell signal then take that to the H L Bollinger bands and mark the spot. Most of the time, you will find that the price does not exceed this spot for the duration (length) of the H L Bollinger bands.
This makes them good for doing Credit Spreads such as Put Vertical Spreads and Call Vertical Spreads. Since the price will normally not exceed the bands at the extreme point, the trader can profit from the time decay and other factors.

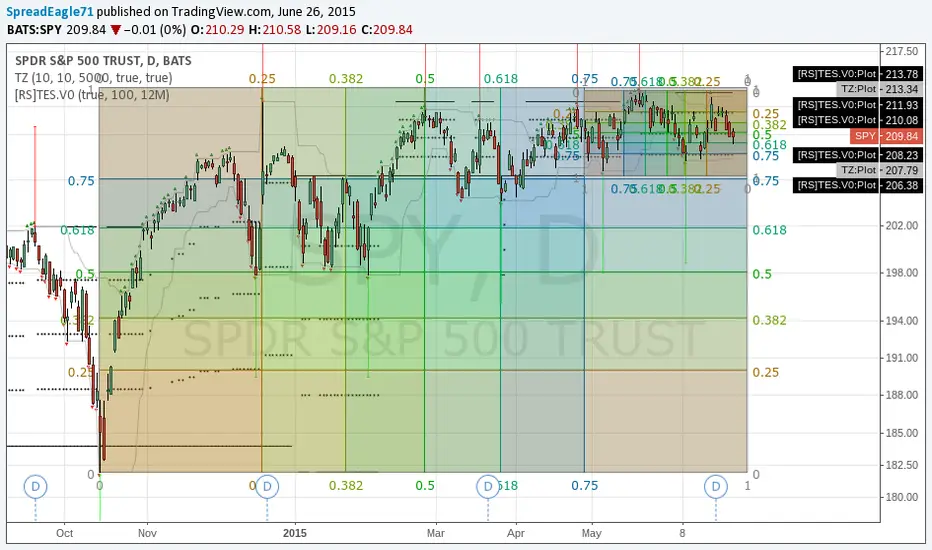
Great Way to draw Fibonacci levels using Gann,TZ, and TES Fibonacci levels can become powerful ways to find almost EXACT support and resistance levels and also time your trades. I have used them to predict turning points in markets on short time periods but they also are predictive in larger time frames.
How to Align Fibonacci Levels:
A very good and objective way to draw your Fibonacci levels is to use Gann Boxes, Transient Zones and the Temporal Extreme Spitter. All of these indicators are in the Public Library.
First start with the Temporal Extreme Splitter (TES) by Richard Santos. The extreme splitter will give you exact high and low places to place your gann boxes.
The Gann Boxes provide fibonacci in two dimensions- price and time. You can align the box ends with the TES. However, I have found one of the best ways is to align the Gann boxes is to set the 50% level on a long/strong TES line.
Next when you align the extremes up with either the center or one or both of the ends of TES lines; then you are ready to start aligning the Fib levels for time.
There is no exact science for doing this but a good way to do it is to try to match the highs and lows using Transient Zones. Transient Zones themselves give highs and lows and are also great places to align the boxes.
However, since TZ's can occur more often than the TES lines (if you use default settings), its good to align them with the Fibonacci time levels of the Gann box.
When watching your entry and exit points, it is also useful to include the concept of Divergence into them for even higher probability trades.
One of the best ways to see divergence is to use a stochastics oscillator. The 14,3,1 default setting is fine. There are also some other ones in the Public Library. I am really into fibonacci, so I will sometimes use a stochastic 55 or 21.
To see divergence, look at the highs and lows on the price chart and compare them to the highs and lows of the stochastic oscillator. If you do this correctly, you can sometimes see where the market is slowing down and turning.
The key word here is slowing down .
Divergence can be used as a confirmatory signal or a way to get out of a trade when it starts to go the other direction.
Good Luck in Your Trading
- Spread Eagle 71