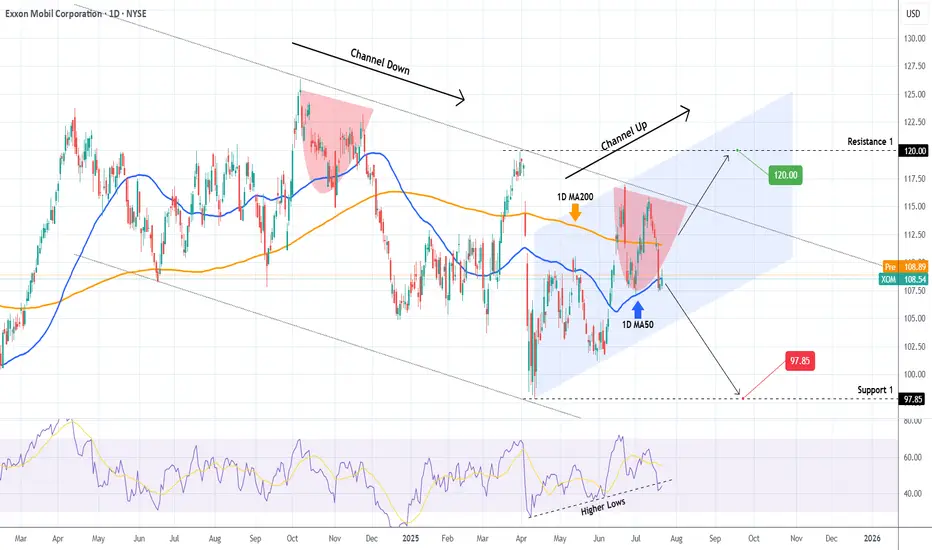
EXXON MOBIL Critical crossroads.Exxon Mobil (XOM) has been trading within a Channel Down since the June 17 2024 Low and just recently on the July 11 2025 High, it made a Lower High pattern similar to November 22 2024.
As long as the price trades below the 1D MA200 (orange trend-line), we expect to start the new Bearish Leg and test at least Support 1 (97.85).
If however it breaks above the 1D MA200 it will invalidate all prior Lower High patterns, and will most likely follow the (blue) Channel Up to break above the Channel Down. In that case, we will be targeting Resistance 1 (120.00).
-------------------------------------------------------------------------------
** Please LIKE 👍, FOLLOW ✅, SHARE 🙌 and COMMENT ✍ if you enjoy this idea! Also share your ideas and charts in the comments section below! This is best way to keep it relevant, support us, keep the content here free and allow the idea to reach as many people as possible. **
-------------------------------------------------------------------------------
💸💸💸💸💸💸
👇 👇 👇 👇 👇 👇
Exxonmobilsignals
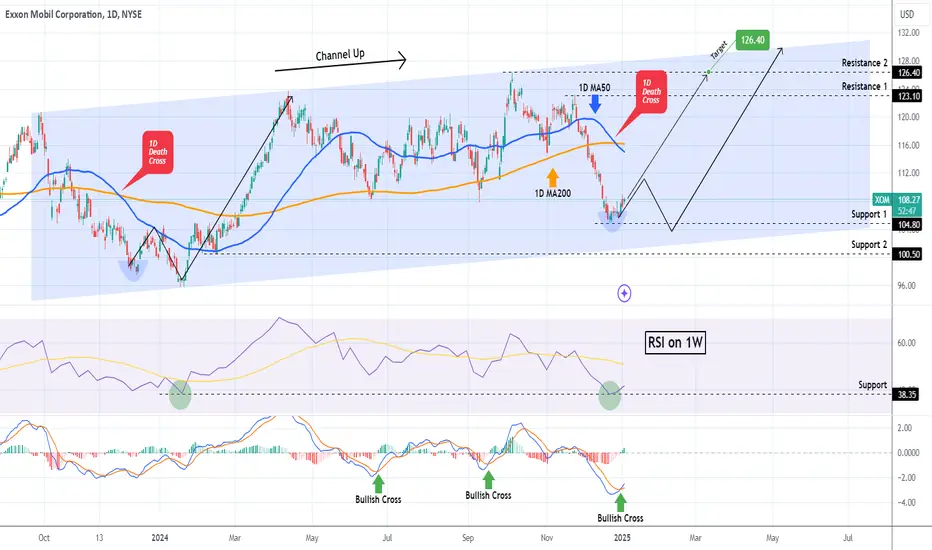
EXXON MOBIL Will it recover the devastating December?Exxon Mobil (XOM) gave us an excellent buy signal on our last idea (September 27 2024, see chart below) as it quickly hit our $120 Target:
Since the November 22 2024 (Lower) High though, it had an aggressive sell-of that stopped on the December 20 2024 Low. The price has stabilized for now but hasn't yet gained the necessary momentum to stage a rebound.
On the other hand, there are some very encouraging signals that justify going long as the Risk/ Reward Ratio has turned very favorable for buying. The price might not be exactly at the bottom (Higher Lows trend-line) of the Channel Up but the 1W RSI is on the 38.35 Support, which is the exact level where the it bottomed on January 19 2024, on the previous Higher Low.
At the same time, the 1D MACD has completed a Bullish Cross, which has always been a solid buy entry below the 0.0 level. As a result, even though the stock may deliver one last pull-back to test the bottom of the 14-month Channel Up, it is worth buying now as the upside is significantly higher. Our Target is the Resistance 2 level at $126.40.
-------------------------------------------------------------------------------
** Please LIKE 👍, FOLLOW ✅, SHARE 🙌 and COMMENT ✍ if you enjoy this idea! Also share your ideas and charts in the comments section below! This is best way to keep it relevant, support us, keep the content here free and allow the idea to reach as many people as possible. **
-------------------------------------------------------------------------------
💸💸💸💸💸💸
👇 👇 👇 👇 👇 👇
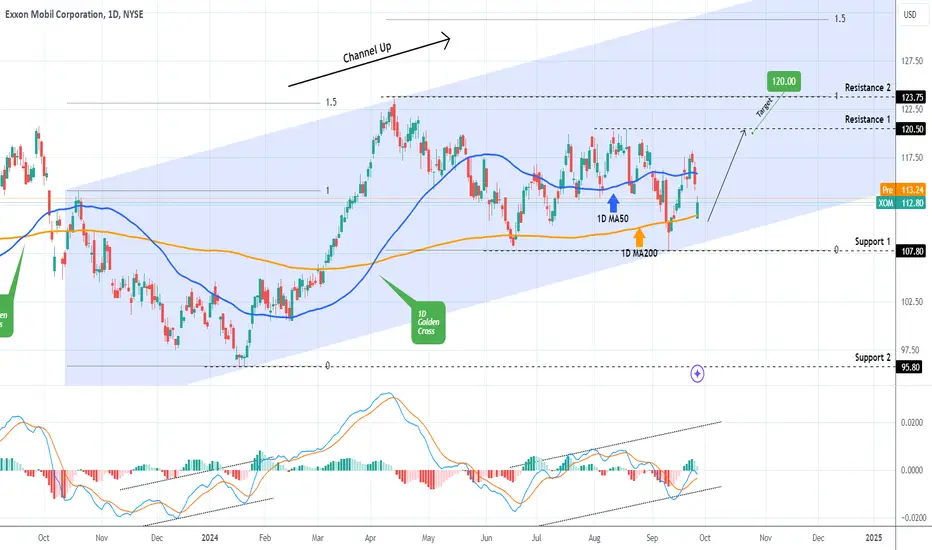
EXXON MOBIL Buy signal on the 1D MA200.Exxon Mobil (XOM) has turned sideways since the June 17 Low and yesterday hit and held and 1D MA200 (orange trend-line). Technically this calls for at least a Resistance 1 test on the short-term so we turn bullish, targeting 120.00 (marginally below that level).
If however it turns out that the dominant pattern is indeed now a Channel Up, on the long-term we can see prices as high as the 1.5 Fibonacci extension (131.50), which is where the previous Higher High was priced on April 12 2014.
-------------------------------------------------------------------------------
** Please LIKE 👍, FOLLOW ✅, SHARE 🙌 and COMMENT ✍ if you enjoy this idea! Also share your ideas and charts in the comments section below! This is best way to keep it relevant, support us, keep the content here free and allow the idea to reach as many people as possible. **
-------------------------------------------------------------------------------
💸💸💸💸💸💸
👇 👇 👇 👇 👇 👇
EXXON MOBIL This sell signal will take it to $105.00 minimum.Exxon Mobil (XOM) has been on a tremendous since the January 18 bottom and even more so since the start of this month (March). We are about to form a Golden Cross on the 1D time-frame and last time this pattern emerged (September 20 2023), the market top was formed a week after.
In fact all Tops since November 2022 where formed on a Higher High sequence, confirmed by a 1D MACD Bearish Cross. As a result, we are waiting for the ideal sell opportunity on Exxon's next High and we will enter it after the MACD forms a Bearish Cross. All previous 3 corrective waves have hit at least the 0.618 Fibonacci retracement level. That gives us a medium-term Target of $105.00.
-------------------------------------------------------------------------------
** Please LIKE 👍, FOLLOW ✅, SHARE 🙌 and COMMENT ✍ if you enjoy this idea! Also share your ideas and charts in the comments section below! This is best way to keep it relevant, support us, keep the content here free and allow the idea to reach as many people as possible. **
-------------------------------------------------------------------------------
💸💸💸💸💸💸
👇 👇 👇 👇 👇 👇

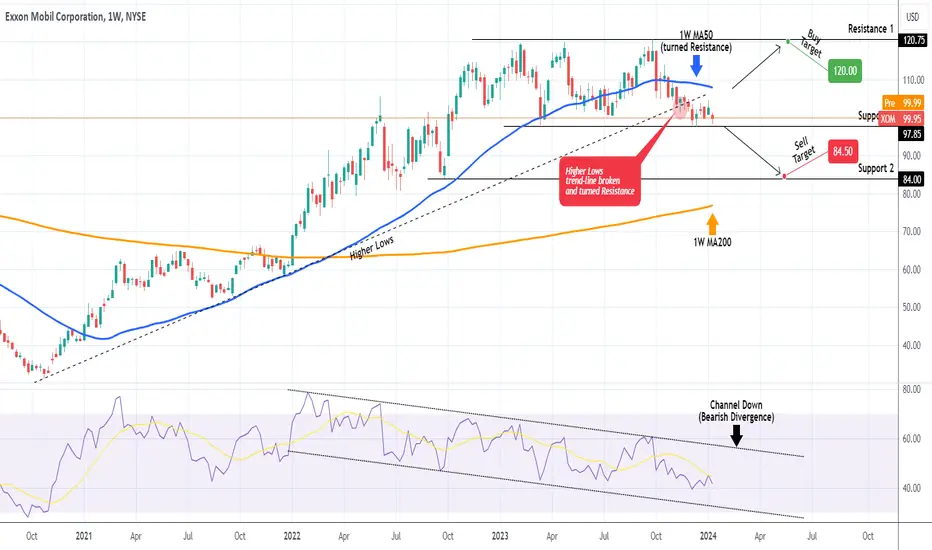
EXXON MOBIL on the 1 year Support but on bearish bias.The Exxon Mobil Corporation (XOM) is again testing Support 1 (97.85), which is holding since the March 13 2023 Low but on a bearish note as it recently broke below the October 2020 Higher Lows trend-line (was the long-term Support) and remains below the 1W MA50 (blue trend-line) for the 12th week in a row.
This is obviously a long-term analysis on the 1W time-frame, but the chart can provide a clear view of the trend depending on the break-out. If the stock closes a 1W candle above the 1W MA50, we will turn bullish targeting $120.00 (just below Resistance 1). If it closes below Support 1, we will turn bearish targeting 84.50, just above Support 2 and the 1W MA200 (orange trend-line).
Note that the 1W RSI has been on a huge Bearish Divergence (Channel Down) since January 2022.
-------------------------------------------------------------------------------
** Please LIKE 👍, FOLLOW ✅, SHARE 🙌 and COMMENT ✍ if you enjoy this idea! Also share your ideas and charts in the comments section below! This is best way to keep it relevant, support us, keep the content here free and allow the idea to reach as many people as possible. **
-------------------------------------------------------------------------------
💸💸💸💸💸💸
👇 👇 👇 👇 👇 👇