Heading into overlap resistance?EUR/CAD is rising towards the pivot and could reverse to the 1st support level which acts as a pullback support.
Pivot: 1.4922
1st Support: 1.4796
1st Resistance: 1.5011
Risk Warning:
Trading Forex and CFDs carries a high level of risk to your capital and you should only trade with money you can afford to lose. Trading Forex and CFDs may not be suitable for all investors, so please ensure that you fully understand the risks involved and seek independent advice if necessary.
Disclaimer:
The above opinions given constitute general market commentary, and do not constitute the opinion or advice of IC Markets or any form of personal or investment advice.
Any opinions, news, research, analyses, prices, other information, or links to third-party sites contained on this website are provided on an "as-is" basis, are intended only to be informative, is not an advice nor a recommendation, nor research, or a record of our trading prices, or an offer of, or solicitation for a transaction in any financial instrument and thus should not be treated as such. The information provided does not involve any specific investment objectives, financial situation and needs of any specific person who may receive it. Please be aware, that past performance is not a reliable indicator of future performance and/or results. Past Performance or Forward-looking scenarios based upon the reasonable beliefs of the third-party provider are not a guarantee of future performance. Actual results may differ materially from those anticipated in forward-looking or past performance statements. IC Markets makes no representation or warranty and assumes no liability as to the accuracy or completeness of the information provided, nor any loss arising from any investment based on a recommendation, forecast or any information supplied by any third-party.
F-EUR

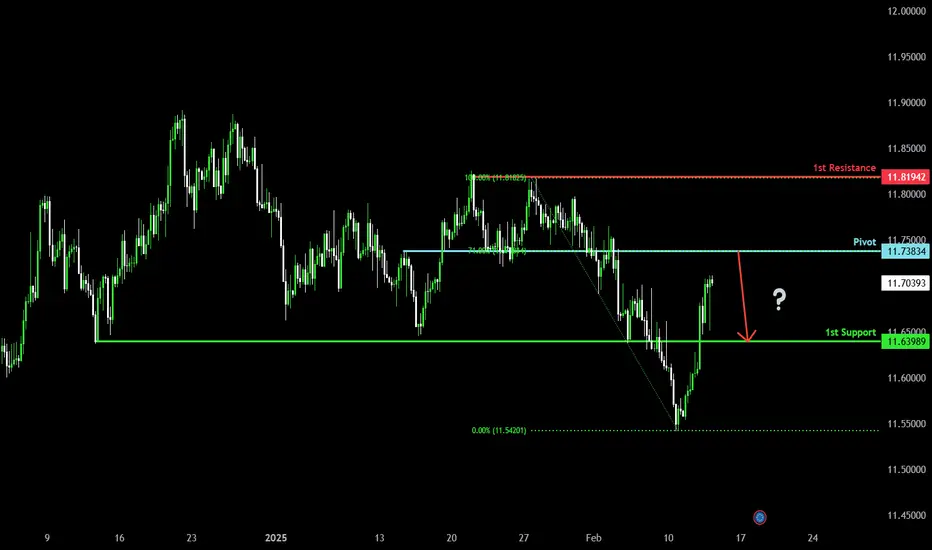
Bearish reversal?EUR/NOK is rising towards the pivot which acts as a pullback resistance and could reverse to the 1st support which has been identified as a pullback support.
Pivot: 11.7383
1st Support: 11.6398
1st Resistance: 11.8194
Risk Warning:
Trading Forex and CFDs carries a high level of risk to your capital and you should only trade with money you can afford to lose. Trading Forex and CFDs may not be suitable for all investors, so please ensure that you fully understand the risks involved and seek independent advice if necessary.
Disclaimer:
The above opinions given constitute general market commentary, and do not constitute the opinion or advice of IC Markets or any form of personal or investment advice.
Any opinions, news, research, analyses, prices, other information, or links to third-party sites contained on this website are provided on an "as-is" basis, are intended only to be informative, is not an advice nor a recommendation, nor research, or a record of our trading prices, or an offer of, or solicitation for a transaction in any financial instrument and thus should not be treated as such. The information provided does not involve any specific investment objectives, financial situation and needs of any specific person who may receive it. Please be aware, that past performance is not a reliable indicator of future performance and/or results. Past Performance or Forward-looking scenarios based upon the reasonable beliefs of the third-party provider are not a guarantee of future performance. Actual results may differ materially from those anticipated in forward-looking or past performance statements. IC Markets makes no representation or warranty and assumes no liability as to the accuracy or completeness of the information provided, nor any loss arising from any investment based on a recommendation, forecast or any information supplied by any third-party.
EURUSD (2H) - High Volatility and Bearish MomentumOANDA:EURUSD
📶 Technical Analysis:
Weekly Chart
🟢 The overall trend has been consistently bearish since October 2024, indicating a longer-term downtrend
🟢 A strong level of support has been broken and tested at 1.0500, indicating potential for further bearish movement.
🟠 In the past three weeks, volatility has significantly increased, due to a combination of fundamental factors.
Daily Chart
🟢 The overall trend has been bearish since October 2024, reinforcing a larger downside momentum.
4-Hour Chart
🟡 There was a bullish trend early in 2025, but it was broken, and bearish momentum took over by the end of January.
🔴 The February opening gap, influenced by Trump tariffs, caused a strong bullish volatility before a reversal took place.
2-Hour Chart
🟢 A reversal pattern in the form of a double top is visible, suggesting that the bullish momentum has ended. This pattern has been confirmed by two lower highs and two lower lows.
🟡 Watch for a retest of the 1.035 resistance level and confirmation of the double top pattern.
🟢 A break below the recent low at 1.030 would suggest continued bearish movement.
🟠 The next strong support level on the daily chart is around 1.022, where the price could potentially stall or reverse if it moves lower.
🆕 Fundamental Analysis:
🟢 The EUR/USD dropped to near 1.0360 after the release of US Nonfarm Payrolls (NFP) data for January.
🟡 US Labor Market: The economy added 143K jobs, fewer than expected (170K), but the Unemployment Rate dropped to 4% (better than the expected 4.1%).
🟡 The Fed is expected to cut interest rates in its June meeting, but this is uncertain due to mixed signals from the labor market. Chair Powell indicated that any rate adjustments will depend on real progress in inflation or weakness in the labor market.
🟢 President Trump warned of potential tariffs on European goods, which could hurt the Eurozone economy. The Eurozone is facing increased uncertainty, with concerns about higher US tariffs negatively affecting growth.
🟢 EUR/USD faces continued selling pressure, as the Eurozone's economic outlook remains weak, especially with the risk of US tariffs and a dovish ECB.
🔤 Summary:
🟡 Neutral Position Above Red Trend Line: If the price breaks above the red trend line, it could signal a shift to a neutral position, requiring fresh analysis for clearer direction.
🟢 Bearish Continuation Confirmation: As long as the price remains below resistance and the double top formation holds, a bearish continuation is likely.
🟡 Watch for Key Breaks: Pay attention to the break below 1.030 and how price reacts to the 1.022 support level for further confirmation of the bearish trend.
Trump-Putin call sparks euro rallyThe euro surged to session highs after former U.S. President Donald Trump announced a 90-minute call with Russian President Vladimir Putin, during which they agreed to visit each other and initiate negotiations to end the war in Ukraine. Trump stated that peace talks would begin “immediately.”
Technically, the euro rebounded from downtrend support, keeping attention on a potential breakout at the January range of 1.02–1.05. Bears potentially remain vulnerable as long as the pair holds above the 1.02 level.
Shortly after his conversation with Putin, Trump spoke with Ukrainian President Volodymyr Zelensky. Zelensky later confirmed the discussion, describing it as “meaningful” and mentioning plans for a new agreement on security, economic cooperation, and resource partnerships.

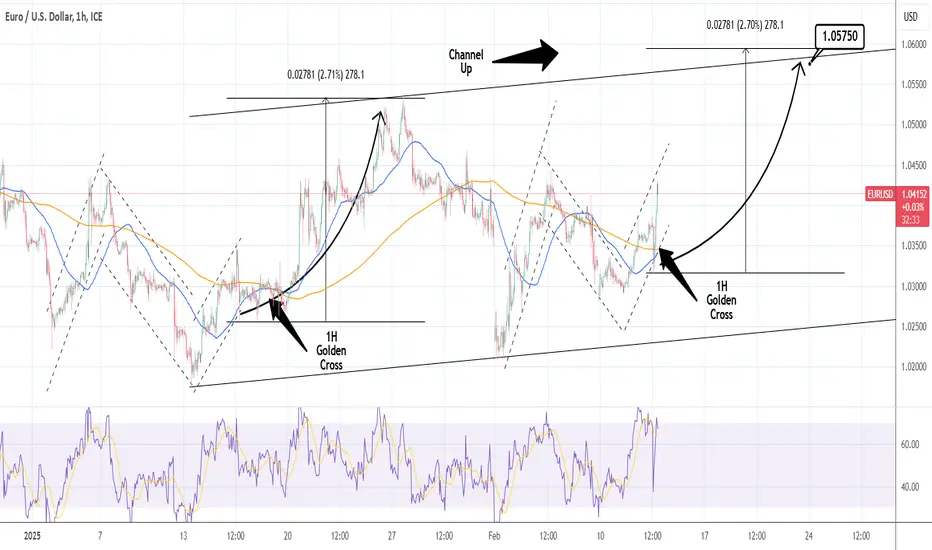
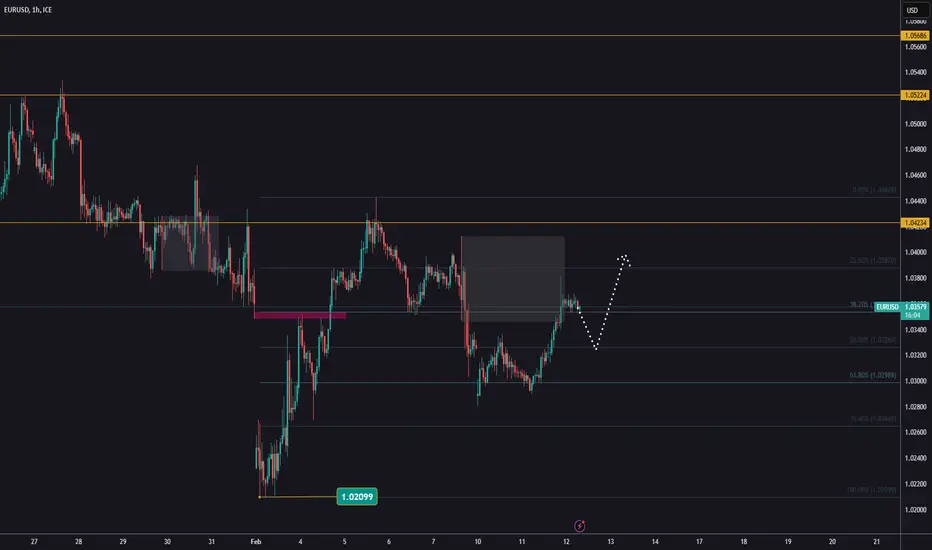
EURUSD: Channel Up aiming at 1.05750EURUSD is neutral on its 1D technical outlook (RSI = 53.912, MACD = -0.001, ADX = 23.143) as it has been ranging inside a Channel Up for the past month. The pair is now forming a Golden Cross on the 1H timeframe and based on the last one formed on the previous bullish wave (Jan 17th), it should now rise to a new HH. We expect a symmetric +2.70% rise on that move (TP = 1.05750).
## If you like our free content follow our profile to get more daily ideas. ##
## Comments and likes are greatly appreciated. ##
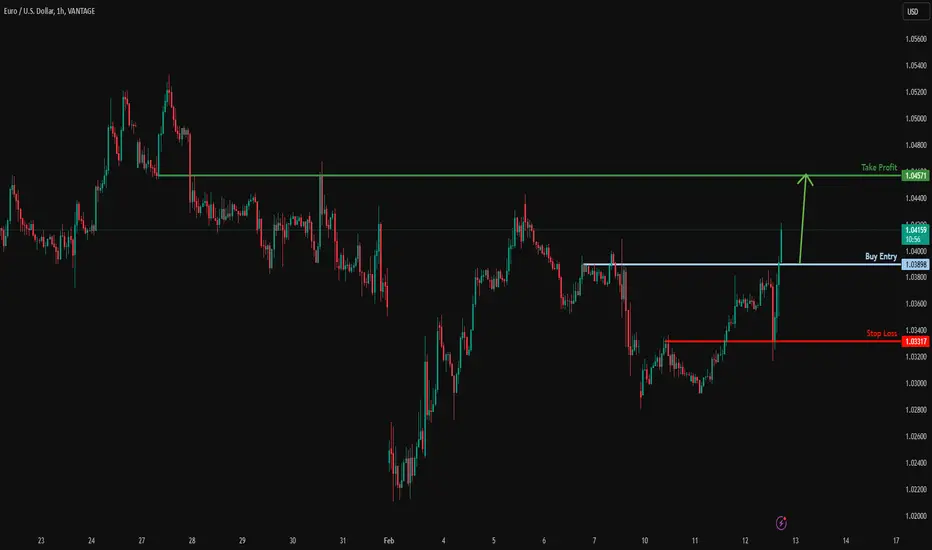
Potential bullish rise?EUR/USD has broken out of the resistance level which is a pullback resistance and could rise from this level to our take profit.
Entry: 1.0389
Why we like it:
There is a pullback resistance level.
Stop loss: 1.0331
Why we like it:
There is an overlap support level.
Take profit: 1.0457
Why we like it:
There is an overlap resistance level.
Enjoying your TradingView experience? Review us!
Please be advised that the information presented on TradingView is provided to Vantage (‘Vantage Global Limited’, ‘we’) by a third-party provider (‘Everest Fortune Group’). Please be reminded that you are solely responsible for the trading decisions on your account. There is a very high degree of risk involved in trading. Any information and/or content is intended entirely for research, educational and informational purposes only and does not constitute investment or consultation advice or investment strategy. The information is not tailored to the investment needs of any specific person and therefore does not involve a consideration of any of the investment objectives, financial situation or needs of any viewer that may receive it. Kindly also note that past performance is not a reliable indicator of future results. Actual results may differ materially from those anticipated in forward-looking or past performance statements. We assume no liability as to the accuracy or completeness of any of the information and/or content provided herein and the Company cannot be held responsible for any omission, mistake nor for any loss or damage including without limitation to any loss of profit which may arise from reliance on any information supplied by Everest Fortune Group.
EURUSD Ahead of Inflation DataYesterday, EURUSD continued its upward movement, reaching 1,0381.
Later today, U.S. inflation data will be released.
This news has a significant impact and will determine the next move for the USD.
If the pair continues to rise, the target will be to break previous highs and reach 1,0568.
Be cautious of misleading price movements and avoid emotional trading!
EURUSD 12 Feb 2025 W7 - Intraday Analysis - CPI, Powell & TariffThis is my Intraday analysis on EURUSD for 12 Feb 2025 W7 based on Smart Money Concept (SMC) which includes the following:
Market Sentiment
4H Chart Analysis
15m Chart Analysis
Market Sentiment
In my Weekly Analysis, tariffs continue to dominate the narrative, yet market reactions have become the primary focus. The critical question is whether investors have grown accustomed to tariff-related news—leading to muted responses—or if the persistent tariff war rhetoric will trigger renewed market anxiety.
Notably, Powell’s testimony yesterday failed to offer any fresh insights; however, there is hope that today’s session might shed some light on future policy directions. Additionally, the USD’s weakness observed at the close of trading yesterday appears to have been driven more by reports of a territorial swap in Ukraine’s peace deal—and possibly an initial leak of the CPI data—rather than by Powell’s remarks.
Today’s CPI report is expected to be a significant driver of market volatility. Investors are eagerly anticipating softer CPI numbers, which could encourage the Fed to consider not only an earlier rate cut but potentially two cuts this year, contrasting with the current market consensus of just one. While tariffs are clearly contributing to upward inflationary pressures and prompting a cautious stance from the Fed, the immediate volatility is likely to stem from the CPI data. The market will be closely watching whether the tariffs are being employed as a negotiating tactic—or if they signal an intentional escalation towards a trade war.
Markets face a tug-of-war between CPI-driven rate hopes and tariff-induced risks. While CPI may spark a tactical rally if soft, tariffs remain the swing factor – any escalation (e.g., new retaliatory measures) would overshadow short-term data. Position for choppy trading until Trump’s tariff strategy crystallizes.
4H Chart Analysis
1️⃣
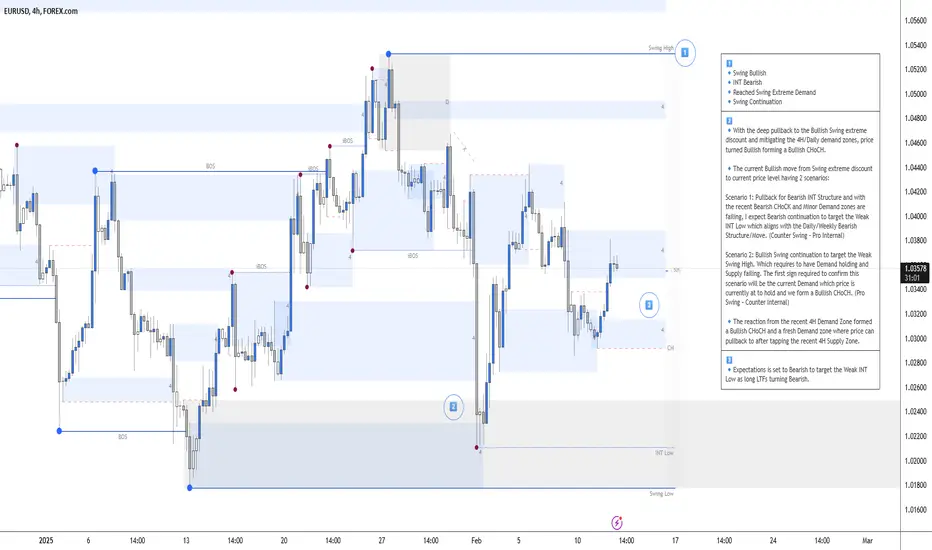
🔹Swing Bullish
🔹INT Bearish
🔹Reached Swing Extreme Demand
🔹Swing Continuation
2️⃣
🔹With the deep pullback to the Bullish Swing extreme discount and mitigating the 4H/Daily demand zones, price turned Bullish forming a Bullish CHoCH.
🔹The current Bullish move from Swing extreme discount to current price level having 2 scenarios:
Scenario 1: Pullback for Bearish INT Structure and with the recent Bearish CHoCK and Minor Demand zones are failing, I expect Bearish continuation to target the Weak INT Low which aligns with the Daily/Weekly Bearish Structure/Move. (Counter Swing – Pro Internal)
Scenario 2: Bullish Swing continuation to target the Weak Swing High. Which requires to have Demand holding and Supply failing. The first sign required to confirm this scenario will be the current Demand which price is currently at to hold and we form a Bullish CHoCH. (Pro Swing – Counter Internal)
🔹The reaction from the recent 4H Demand Zone formed a Bullish CHoCH and a fresh Demand zone where price can pullback to after tapping the recent 4H Supply Zone.
3️⃣
🔹Expectations is set to Bearish to target the Weak INT Low as long LTFs turning Bearish.
15m Chart Analysis
1️⃣
🔹Swing Bearish
🔹INT Bullish
🔹At Swing Premium
2️⃣
🔹With yesterday PA, price failed to continue Bearish and created a Bullish i-BOS.
🔹Price reached the 4H supply as anticipated and mitigated the 15m Supply within the 4H to maybe initiate the Bullish INT Structure pullback phase and if the swing is going to continue Bearish there is a high probability to target the Strong INT Low.
🔹The current Bullish i-BOS aligns with the 4H Swing where we have also a high probability that we can target the 15m Strong Swing High.
🔹With the inconsistency of Time frames alignments, a clear direction is difficult to identify which requires a sit back and watch till we have a clear direction.
3️⃣
🔹From an intraday perspective, expectations are set to Bearish to facilitate the Bullish INT Structure pullback.
🔹Today’s CPI, Powell and Tariffs talks will have high volatility that could direct me tomorrow or next week for a clearer direction move.
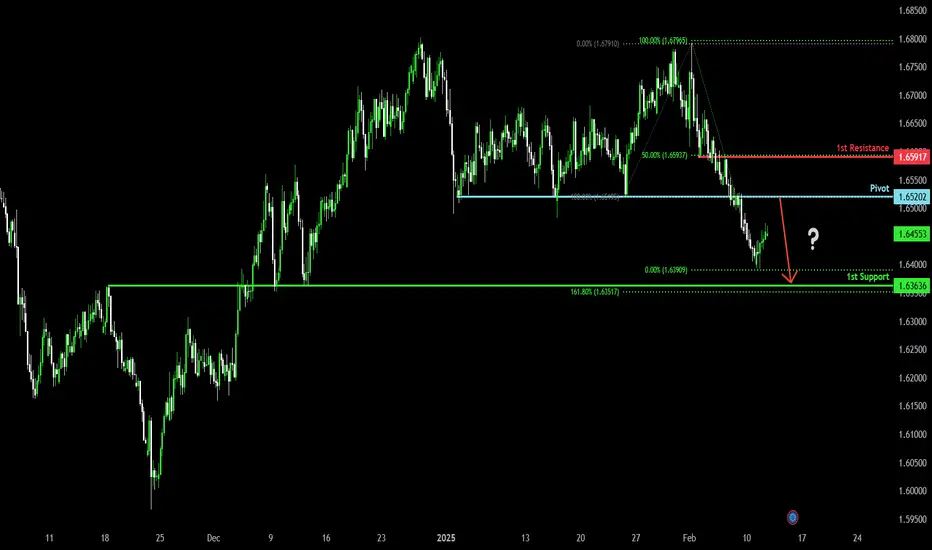
Pullback resistance ahead?EUR/AUD is rising towards the pivot which has been identified as a pullback resistance and could drop to the overlap support.
Pivot: 1.6520
1st Support: 1.6363
1st Resistance: 1.6591
Risk Warning:
Trading Forex and CFDs carries a high level of risk to your capital and you should only trade with money you can afford to lose. Trading Forex and CFDs may not be suitable for all investors, so please ensure that you fully understand the risks involved and seek independent advice if necessary.
Disclaimer:
The above opinions given constitute general market commentary, and do not constitute the opinion or advice of IC Markets or any form of personal or investment advice.
Any opinions, news, research, analyses, prices, other information, or links to third-party sites contained on this website are provided on an "as-is" basis, are intended only to be informative, is not an advice nor a recommendation, nor research, or a record of our trading prices, or an offer of, or solicitation for a transaction in any financial instrument and thus should not be treated as such. The information provided does not involve any specific investment objectives, financial situation and needs of any specific person who may receive it. Please be aware, that past performance is not a reliable indicator of future performance and/or results. Past Performance or Forward-looking scenarios based upon the reasonable beliefs of the third-party provider are not a guarantee of future performance. Actual results may differ materially from those anticipated in forward-looking or past performance statements. IC Markets makes no representation or warranty and assumes no liability as to the accuracy or completeness of the information provided, nor any loss arising from any investment based on a recommendation, forecast or any information supplied by any third-party.
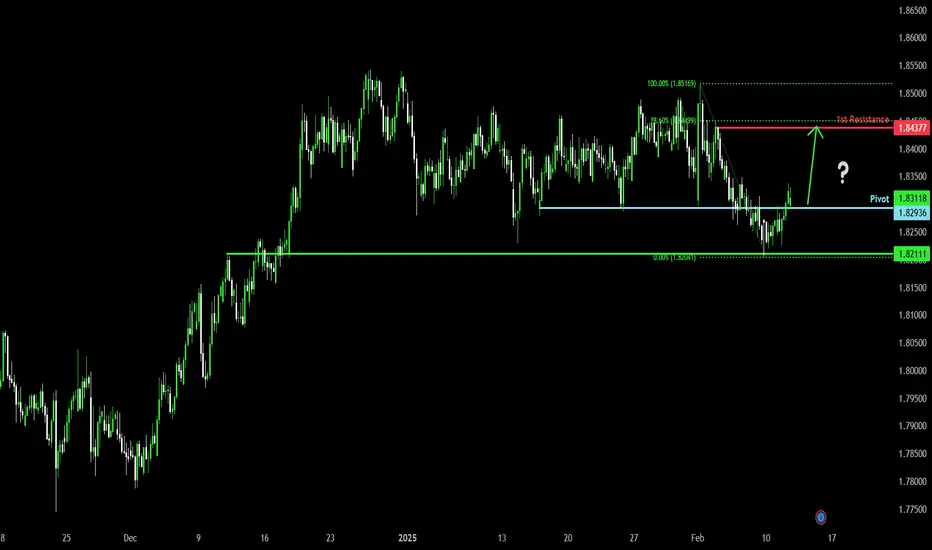
Potential bullish rise?EUR/NZD is reacting off the pivot which acts as a pullback resistance and could rise to the 1st resistance which has been identified as a pullback resistance.
Pivot: 1.8293
1st Support: 1.8211
1st Resistance: 1.8437
Risk Warning:
Trading Forex and CFDs carries a high level of risk to your capital and you should only trade with money you can afford to lose. Trading Forex and CFDs may not be suitable for all investors, so please ensure that you fully understand the risks involved and seek independent advice if necessary.
Disclaimer:
The above opinions given constitute general market commentary, and do not constitute the opinion or advice of IC Markets or any form of personal or investment advice.
Any opinions, news, research, analyses, prices, other information, or links to third-party sites contained on this website are provided on an "as-is" basis, are intended only to be informative, is not an advice nor a recommendation, nor research, or a record of our trading prices, or an offer of, or solicitation for a transaction in any financial instrument and thus should not be treated as such. The information provided does not involve any specific investment objectives, financial situation and needs of any specific person who may receive it. Please be aware, that past performance is not a reliable indicator of future performance and/or results. Past Performance or Forward-looking scenarios based upon the reasonable beliefs of the third-party provider are not a guarantee of future performance. Actual results may differ materially from those anticipated in forward-looking or past performance statements. IC Markets makes no representation or warranty and assumes no liability as to the accuracy or completeness of the information provided, nor any loss arising from any investment based on a recommendation, forecast or any information supplied by any third-party.
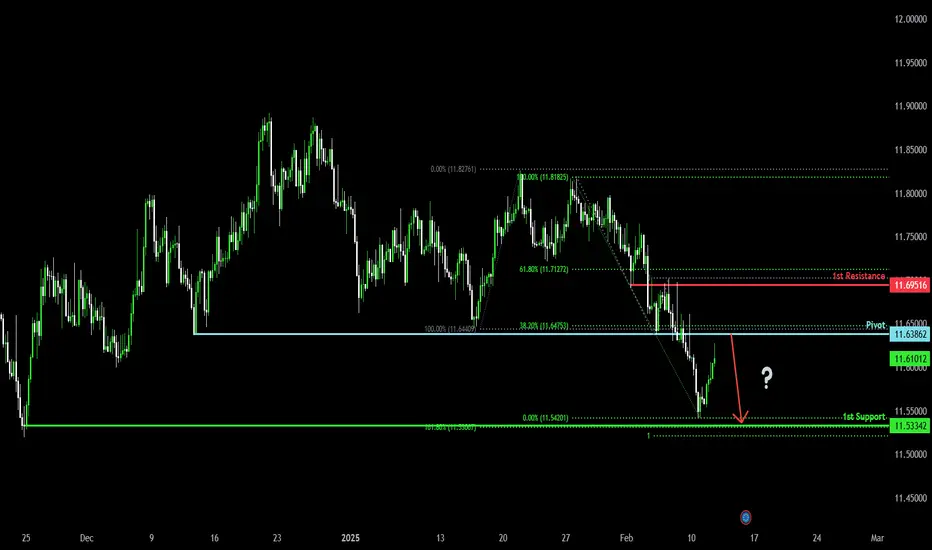
Bearish reversal off pullback resistance?EUR/NOK is rising towards the pivot which is a pullback resistance and could reverse to the 1st support level.
Pivot: 11.6386
1st Support: 11.5334
1st Resistance: 11.6951
Risk Warning:
Trading Forex and CFDs carries a high level of risk to your capital and you should only trade with money you can afford to lose. Trading Forex and CFDs may not be suitable for all investors, so please ensure that you fully understand the risks involved and seek independent advice if necessary.
Disclaimer:
The above opinions given constitute general market commentary, and do not constitute the opinion or advice of IC Markets or any form of personal or investment advice.
Any opinions, news, research, analyses, prices, other information, or links to third-party sites contained on this website are provided on an "as-is" basis, are intended only to be informative, is not an advice nor a recommendation, nor research, or a record of our trading prices, or an offer of, or solicitation for a transaction in any financial instrument and thus should not be treated as such. The information provided does not involve any specific investment objectives, financial situation and needs of any specific person who may receive it. Please be aware, that past performance is not a reliable indicator of future performance and/or results. Past Performance or Forward-looking scenarios based upon the reasonable beliefs of the third-party provider are not a guarantee of future performance. Actual results may differ materially from those anticipated in forward-looking or past performance statements. IC Markets makes no representation or warranty and assumes no liability as to the accuracy or completeness of the information provided, nor any loss arising from any investment based on a recommendation, forecast or any information supplied by any third-party.
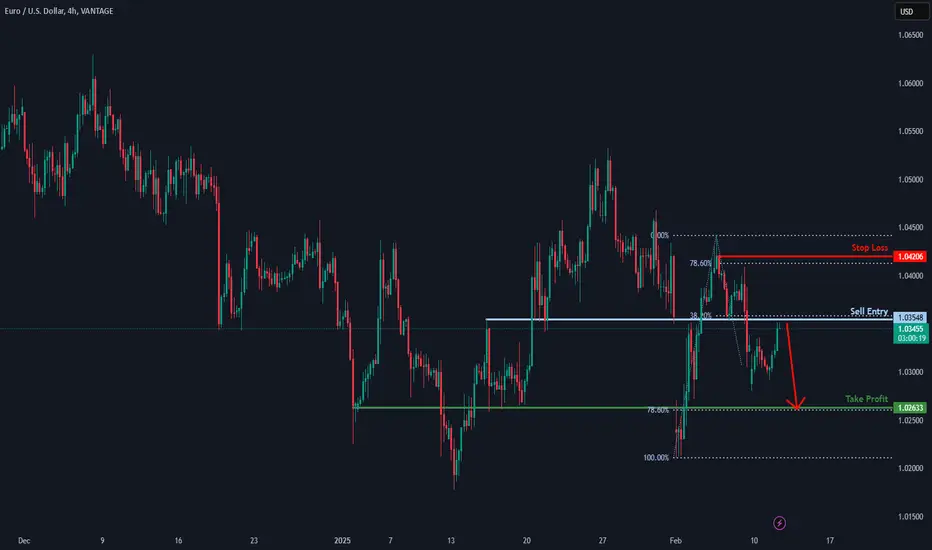
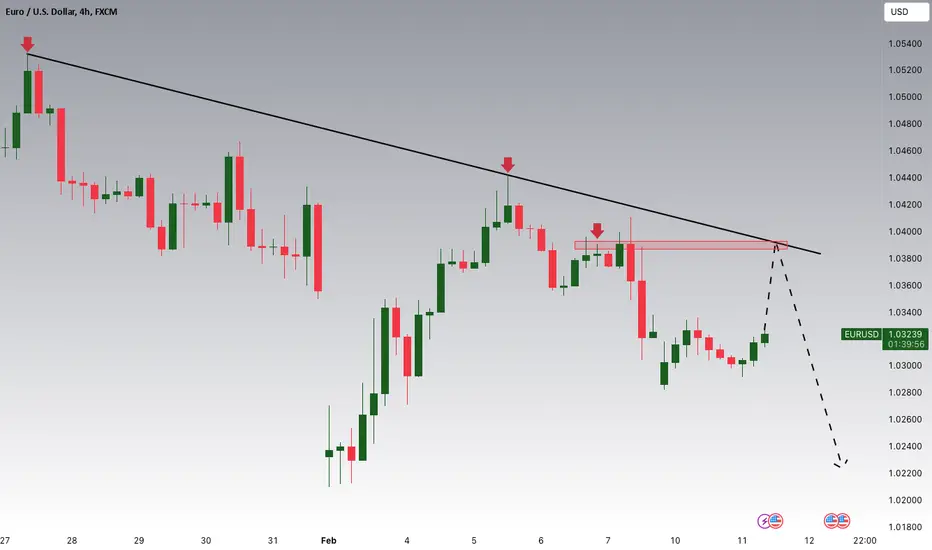
Could the Fiber reverse from here?The price is reacting off the resistance level which is an overlap resistance that aligns with the 38.2% Fibonacci retracement and could drop from this level to our take profit.
Entry: 1.0354
Why we like it:
There is an overlap resistance level that aligns with the 38.2% Fibonacci retracement.
Stop loss: 1.0420
Why we like it:
There is a pullback resistance level that is slightly above the 778.6% Fibonacci retracement.
Take profit: 1.0263
Why we like it:
There is a pullback support level that line sup with the 78.6% Fibonacci retracement.
Enjoying your TradingView experience? Review us!
Please be advised that the information presented on TradingView is provided to Vantage (‘Vantage Global Limited’, ‘we’) by a third-party provider (‘Everest Fortune Group’). Please be reminded that you are solely responsible for the trading decisions on your account. There is a very high degree of risk involved in trading. Any information and/or content is intended entirely for research, educational and informational purposes only and does not constitute investment or consultation advice or investment strategy. The information is not tailored to the investment needs of any specific person and therefore does not involve a consideration of any of the investment objectives, financial situation or needs of any viewer that may receive it. Kindly also note that past performance is not a reliable indicator of future results. Actual results may differ materially from those anticipated in forward-looking or past performance statements. We assume no liability as to the accuracy or completeness of any of the information and/or content provided herein and the Company cannot be held responsible for any omission, mistake nor for any loss or damage including without limitation to any loss of profit which may arise from reliance on any information supplied by Everest Fortune Group.
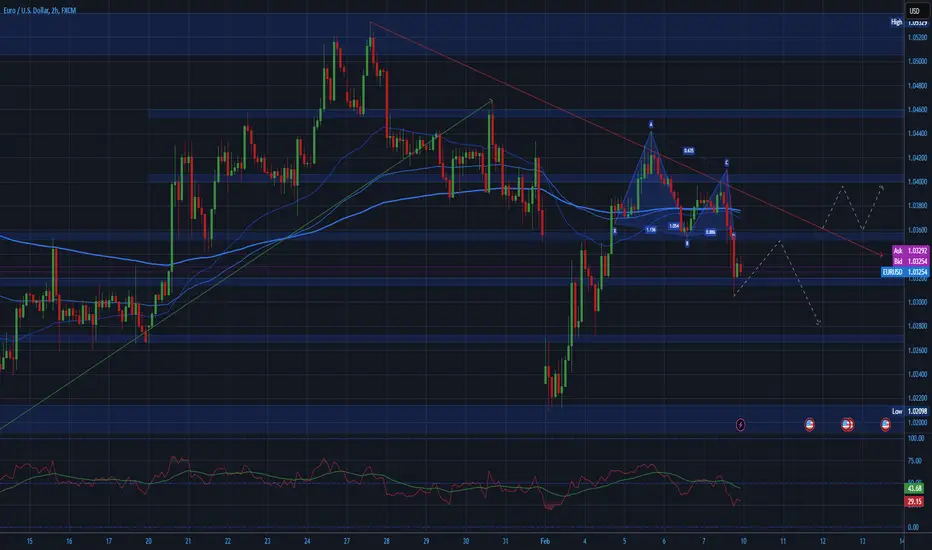
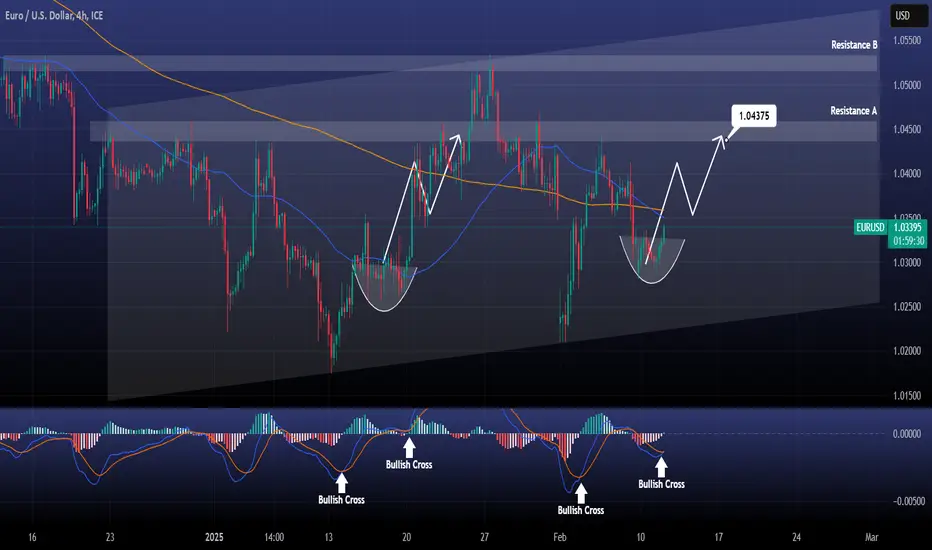
EURUSD Short term rebound possible.EURUSD is testing its 4hour MA50 after consolidating all day yesterday around the 1.0300 level.
Based on the 4hour MACD, we have a consolidation similar to January 16th-17th, which ended up forming Resistance B.
As we just formed the 2nd Bullish Cross on the 4hour MACD, we expect a similar rise to take place.
Buy and target 1.04375, which is the bottom of Resistance A.
Follow us, like the idea and leave a comment below!!
EURUSD Potential DownsidesHey Traders, in today's trading session we are monitoring EURUSD for a selling opportunity around 1.03800 zone, EURUSD is trading in a downtrend and currently is in a correction phase in which it is approaching the trend at 1.03800 support and resistance area.
Trade safe, Joe.
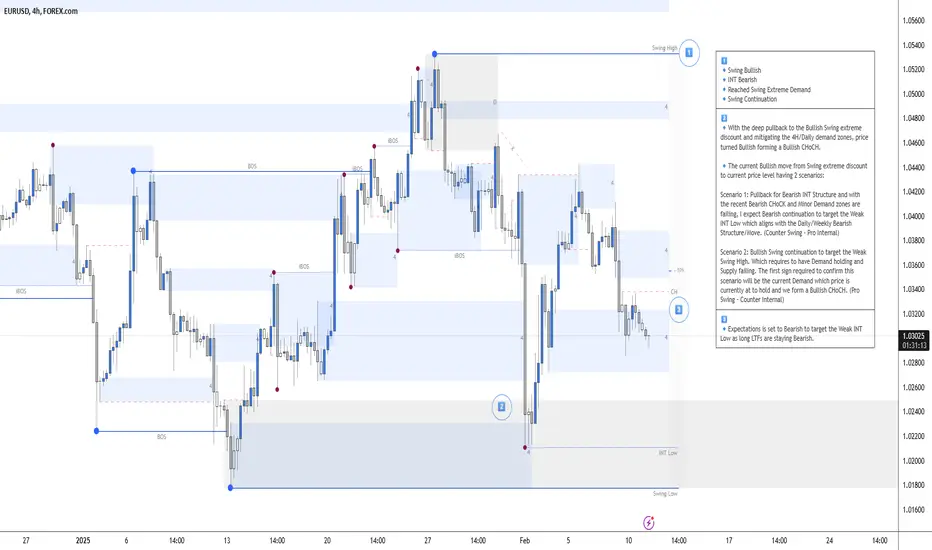
EURUSD 11 Feb 2025 W7 - Intraday Analysis - Powell & Tariffs!This is my Intraday analysis on EURUSD for 11 Feb 2025 W7 based on Smart Money Concept (SMC) which includes the following:
Market Sentiment
4H Chart Analysis
15m Chart Analysis
Market Sentiment
My Weekly Analysis HERE still the same as Tariffs is the main theme but market reaction is the key.
Is the market got used to the Tariffs news so reactions will be soft and fade or we are going to see more fear in the market with Tariff War narrative?
Today Powell will be the market mover as investors are waiting for a clue for direction.
4H Chart Analysis
1️⃣
🔹Swing Bullish
🔹INT Bearish
🔹Reached Swing Extreme Demand
🔹Swing Continuation
2️⃣
🔹With the deep pullback to the Bullish Swing extreme discount and mitigating the 4H/Daily demand zones, price turned Bullish forming a Bullish CHoCH.
🔹The current Bullish move from Swing extreme discount to current price level having 2 scenarios:
Scenario 1: Pullback for Bearish INT Structure and with the recent Bearish CHoCK and Minor Demand zones are failing, I expect Bearish continuation to target the Weak INT Low which aligns with the Daily/Weekly Bearish Structure/Move. (Counter Swing – Pro Internal)
Scenario 2: Bullish Swing continuation to target the Weak Swing High. Which requires to have Demand holding and Supply failing. The first sign required to confirm this scenario will be the current Demand which price is currently at to hold and we form a Bullish CHoCH. (Pro Swing – Counter Internal)
3️⃣
🔹Expectations is set to Bearish to target the Weak INT Low as long LTFs are staying Bearish.
15m Chart Analysis
1️⃣
🔹Swing Bearish
🔹INT Bearish
🔹Swing Continuation
2️⃣
🔹Price reached the Strong Swing High (4H CHoCH) sweeping the liquidity and turning INT structure to bearish with iBOS.
🔹INT Structure continuing Bearish following the 4H Bearish INT structure Continuation.
🔹Since yesterday market open, price is ranging within the Bearish INT structure.
🔹Current INT High is the 4H CHoCH which could be taken out as liquidity for continuation down.
🔹After reaching the Bearish INT structure extreme price is moving down in a corrective PA and currently in the extreme discount of the INT Structure.
🔹For me, I’d prefer to short from the 4H Supply after sweeping the 15m INT High (4H CHoCH). No Long setups/confirmations are clear for me.
3️⃣
🔹Expectation is for price to continue Bearish targeting the 15m Weak Swing Low.
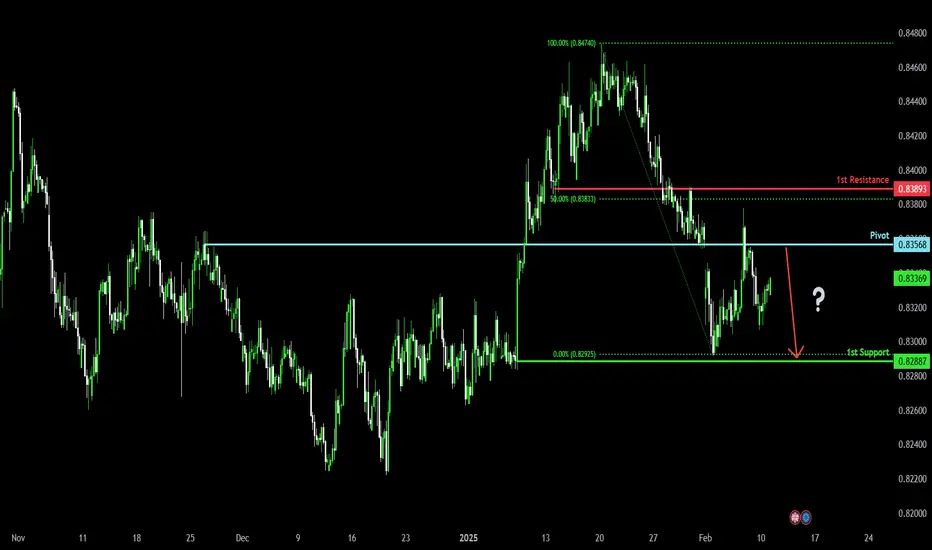
Could the price reverse from here?EUR/GBP is rising towards the pivot and could reverse to the 1st support level which is a pullback support.
Pivot: 0.8356
1st Support: 0.8288
1st Resistance: 0.8389
Risk Warning:
Trading Forex and CFDs carries a high level of risk to your capital and you should only trade with money you can afford to lose. Trading Forex and CFDs may not be suitable for all investors, so please ensure that you fully understand the risks involved and seek independent advice if necessary.
Disclaimer:
The above opinions given constitute general market commentary, and do not constitute the opinion or advice of IC Markets or any form of personal or investment advice.
Any opinions, news, research, analyses, prices, other information, or links to third-party sites contained on this website are provided on an "as-is" basis, are intended only to be informative, is not an advice nor a recommendation, nor research, or a record of our trading prices, or an offer of, or solicitation for a transaction in any financial instrument and thus should not be treated as such. The information provided does not involve any specific investment objectives, financial situation and needs of any specific person who may receive it. Please be aware, that past performance is not a reliable indicator of future performance and/or results. Past Performance or Forward-looking scenarios based upon the reasonable beliefs of the third-party provider are not a guarantee of future performance. Actual results may differ materially from those anticipated in forward-looking or past performance statements. IC Markets makes no representation or warranty and assumes no liability as to the accuracy or completeness of the information provided, nor any loss arising from any investment based on a recommendation, forecast or any information supplied by any third-party.
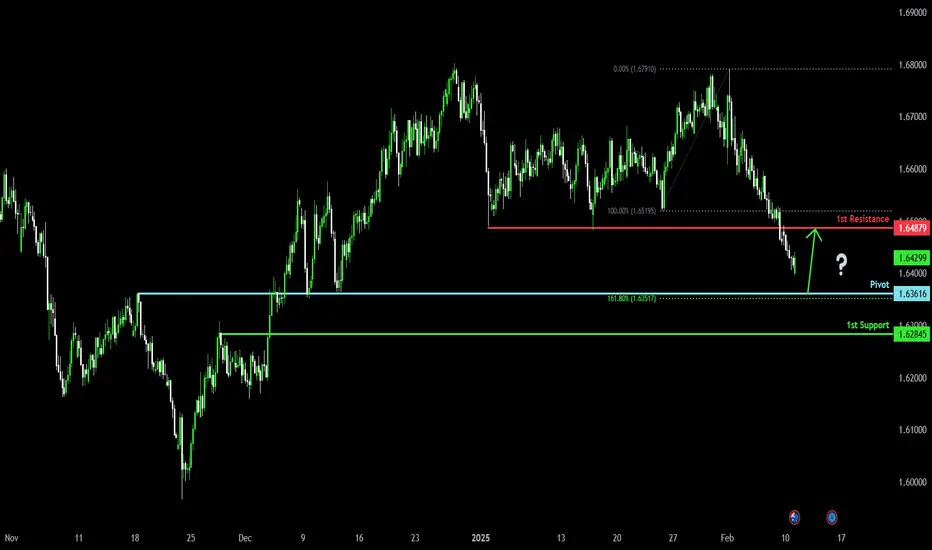
Bullish reversal off overlap support?EUR/AUD is falling towards the pivot which has been identified as an overlap support and could bounce to the 1st resistance which acts as a pullback resistance.
Pivot: 1.6361
1st Support: 1.6284
1st Resistance: 1.6487
Risk Warning:
Trading Forex and CFDs carries a high level of risk to your capital and you should only trade with money you can afford to lose. Trading Forex and CFDs may not be suitable for all investors, so please ensure that you fully understand the risks involved and seek independent advice if necessary.
Disclaimer:
The above opinions given constitute general market commentary, and do not constitute the opinion or advice of IC Markets or any form of personal or investment advice.
Any opinions, news, research, analyses, prices, other information, or links to third-party sites contained on this website are provided on an "as-is" basis, are intended only to be informative, is not an advice nor a recommendation, nor research, or a record of our trading prices, or an offer of, or solicitation for a transaction in any financial instrument and thus should not be treated as such. The information provided does not involve any specific investment objectives, financial situation and needs of any specific person who may receive it. Please be aware, that past performance is not a reliable indicator of future performance and/or results. Past Performance or Forward-looking scenarios based upon the reasonable beliefs of the third-party provider are not a guarantee of future performance. Actual results may differ materially from those anticipated in forward-looking or past performance statements. IC Markets makes no representation or warranty and assumes no liability as to the accuracy or completeness of the information provided, nor any loss arising from any investment based on a recommendation, forecast or any information supplied by any third-party.
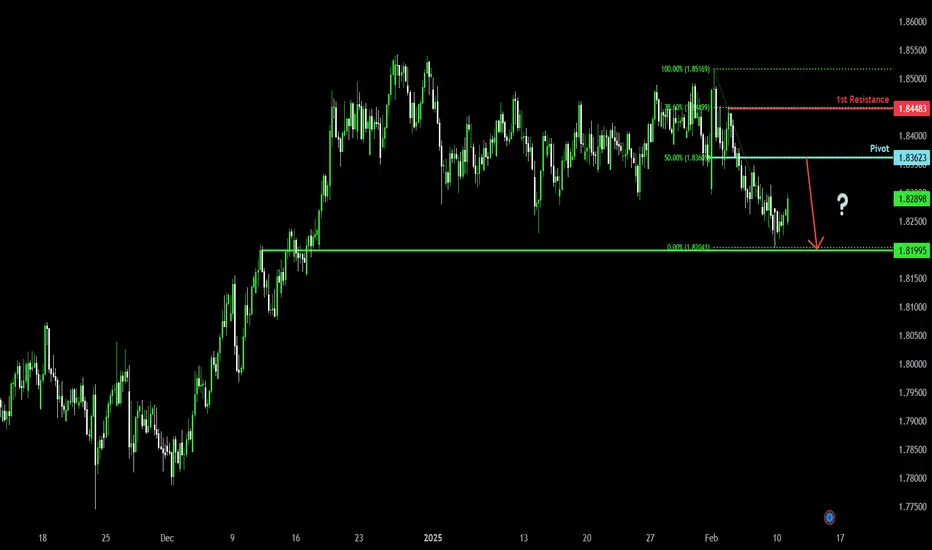
Bearish drop?EUR/NZD is rising towards the pivot which is a pullback resistance and could drop to the 1st support which acts as a pullback support.
Pivot: 1.8362
1st Support: 1.8199
1st Resistance: 1.8448
Risk Warning:
Trading Forex and CFDs carries a high level of risk to your capital and you should only trade with money you can afford to lose. Trading Forex and CFDs may not be suitable for all investors, so please ensure that you fully understand the risks involved and seek independent advice if necessary.
Disclaimer:
The above opinions given constitute general market commentary, and do not constitute the opinion or advice of IC Markets or any form of personal or investment advice.
Any opinions, news, research, analyses, prices, other information, or links to third-party sites contained on this website are provided on an "as-is" basis, are intended only to be informative, is not an advice nor a recommendation, nor research, or a record of our trading prices, or an offer of, or solicitation for a transaction in any financial instrument and thus should not be treated as such. The information provided does not involve any specific investment objectives, financial situation and needs of any specific person who may receive it. Please be aware, that past performance is not a reliable indicator of future performance and/or results. Past Performance or Forward-looking scenarios based upon the reasonable beliefs of the third-party provider are not a guarantee of future performance. Actual results may differ materially from those anticipated in forward-looking or past performance statements. IC Markets makes no representation or warranty and assumes no liability as to the accuracy or completeness of the information provided, nor any loss arising from any investment based on a recommendation, forecast or any information supplied by any third-party.
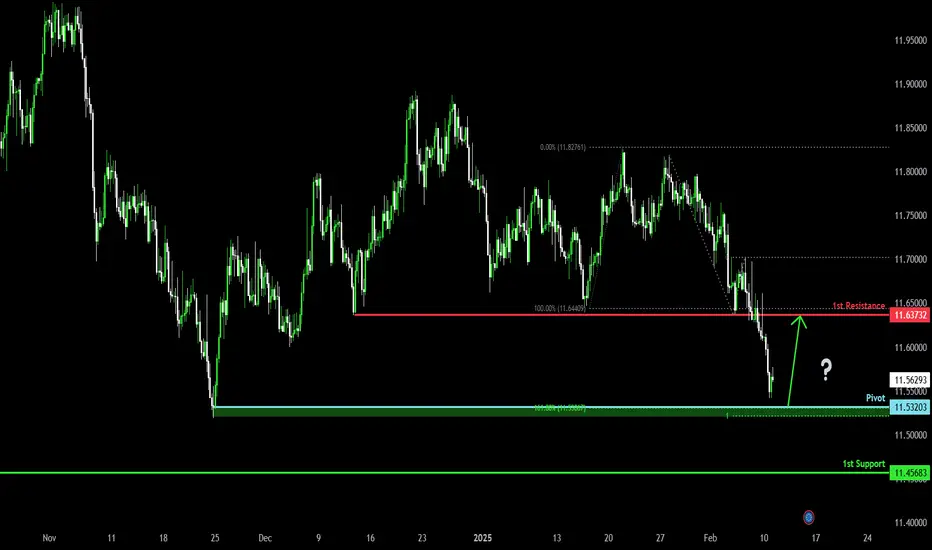
Bullish reversal?EUR/NOK is falling towards the pivot and could bounce to the 1st resistance.
Pivot: 11.5320
1st Support: 11.4568
1st Resistance: 11.6373
Risk Warning:
Trading Forex and CFDs carries a high level of risk to your capital and you should only trade with money you can afford to lose. Trading Forex and CFDs may not be suitable for all investors, so please ensure that you fully understand the risks involved and seek independent advice if necessary.
Disclaimer:
The above opinions given constitute general market commentary, and do not constitute the opinion or advice of IC Markets or any form of personal or investment advice.
Any opinions, news, research, analyses, prices, other information, or links to third-party sites contained on this website are provided on an "as-is" basis, are intended only to be informative, is not an advice nor a recommendation, nor research, or a record of our trading prices, or an offer of, or solicitation for a transaction in any financial instrument and thus should not be treated as such. The information provided does not involve any specific investment objectives, financial situation and needs of any specific person who may receive it. Please be aware, that past performance is not a reliable indicator of future performance and/or results. Past Performance or Forward-looking scenarios based upon the reasonable beliefs of the third-party provider are not a guarantee of future performance. Actual results may differ materially from those anticipated in forward-looking or past performance statements. IC Markets makes no representation or warranty and assumes no liability as to the accuracy or completeness of the information provided, nor any loss arising from any investment based on a recommendation, forecast or any information supplied by any third-party.
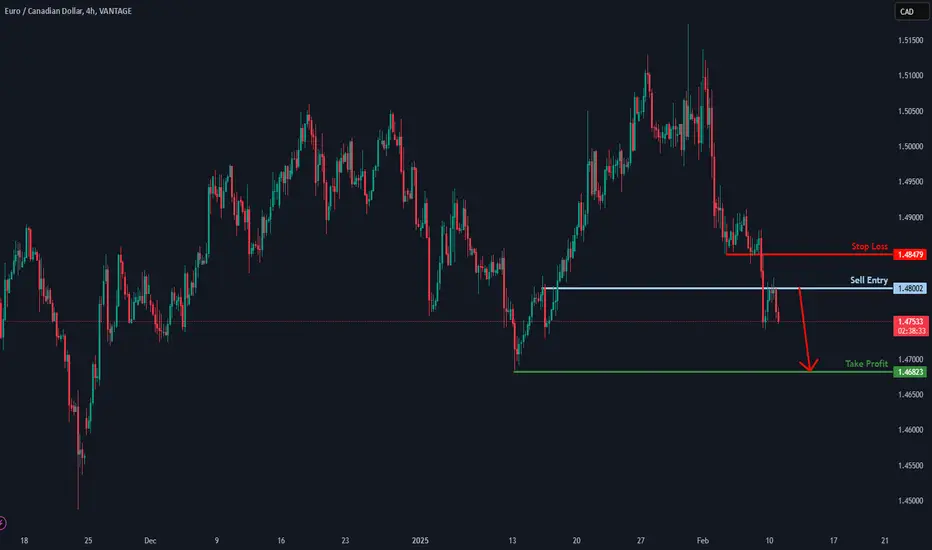
Bearish drop?EUR/CAD has reacted off the resistance level which is a pullback resistance and could drop from this level to our take profit.
Entry: 1.4800
Why we like it:
There is a pullback resistance level.
Stop loss: 1.4847
Why we like it:
There is a pullback resistance level.
Take profit: 1.4682
Why we like it:
There is a pullback support level.
Enjoying your TradingView experience? Review us!
Please be advised that the information presented on TradingView is provided to Vantage (‘Vantage Global Limited’, ‘we’) by a third-party provider (‘Everest Fortune Group’). Please be reminded that you are solely responsible for the trading decisions on your account. There is a very high degree of risk involved in trading. Any information and/or content is intended entirely for research, educational and informational purposes only and does not constitute investment or consultation advice or investment strategy. The information is not tailored to the investment needs of any specific person and therefore does not involve a consideration of any of the investment objectives, financial situation or needs of any viewer that may receive it. Kindly also note that past performance is not a reliable indicator of future results. Actual results may differ materially from those anticipated in forward-looking or past performance statements. We assume no liability as to the accuracy or completeness of any of the information and/or content provided herein and the Company cannot be held responsible for any omission, mistake nor for any loss or damage including without limitation to any loss of profit which may arise from reliance on any information supplied by Everest Fortune Group.
Potential bullish rise?EUR/NZD has bounced off the support level which is a pullback support and could rise from this level to our take profit.
Entry: 1.8233
Why we like it:
There is a pullback support level.
Stop loss: 1.8143
Why we like it:
There is a pullback support level.
Take profit: 1.8356
Why we like it:
There is a pullback resistance that lines up with the 50% Fibonacci retracement.
Enjoying your TradingView experience? Review us!
Please be advised that the information presented on TradingView is provided to Vantage (‘Vantage Global Limited’, ‘we’) by a third-party provider (‘Everest Fortune Group’). Please be reminded that you are solely responsible for the trading decisions on your account. There is a very high degree of risk involved in trading. Any information and/or content is intended entirely for research, educational and informational purposes only and does not constitute investment or consultation advice or investment strategy. The information is not tailored to the investment needs of any specific person and therefore does not involve a consideration of any of the investment objectives, financial situation or needs of any viewer that may receive it. Kindly also note that past performance is not a reliable indicator of future results. Actual results may differ materially from those anticipated in forward-looking or past performance statements. We assume no liability as to the accuracy or completeness of any of the information and/or content provided herein and the Company cannot be held responsible for any omission, mistake nor for any loss or damage including without limitation to any loss of profit which may arise from reliance on any information supplied by Everest Fortune Group.

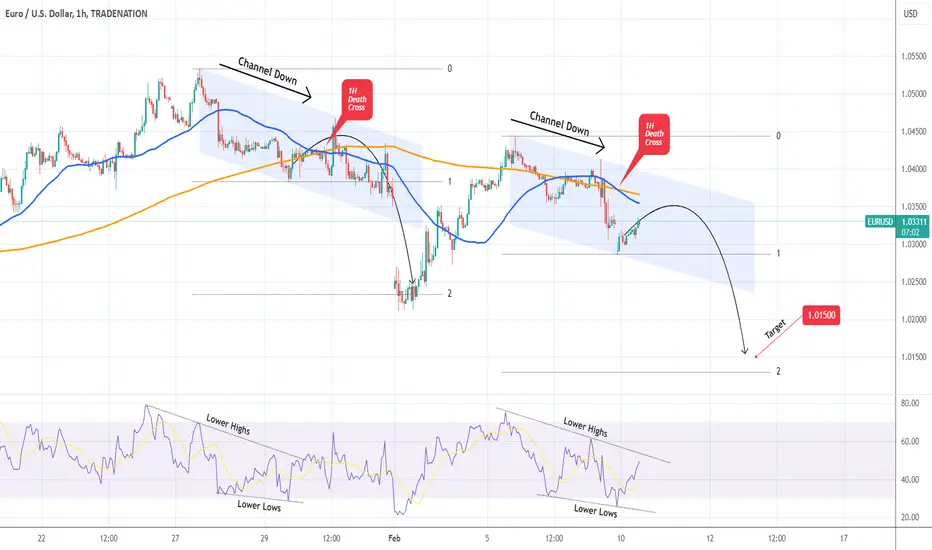
EURUSD 1H Death Cross waiting for the perfect Sell.The EURUSD pair completed a 1H Death Cross on today's opening, the first such formation since January 30. Given that we are currently within a Channel Down pattern similar to January's Death Cross, we expect the current formation to follow the trend of the former.
After a short-term rebound above the 1H MA200 (orange trend-line), the previous Channel Down declined aggressively to the 2.0 Fibonacci extension. This gives us a new bearish target at 1.01500.
-------------------------------------------------------------------------------
** Please LIKE 👍, FOLLOW ✅, SHARE 🙌 and COMMENT ✍ if you enjoy this idea! Also share your ideas and charts in the comments section below! This is best way to keep it relevant, support us, keep the content here free and allow the idea to reach as many people as possible. **
-------------------------------------------------------------------------------
Disclosure: I am part of Trade Nation's Influencer program and receive a monthly fee for using their TradingView charts in my analysis.
💸💸💸💸💸💸
👇 👇 👇 👇 👇 👇
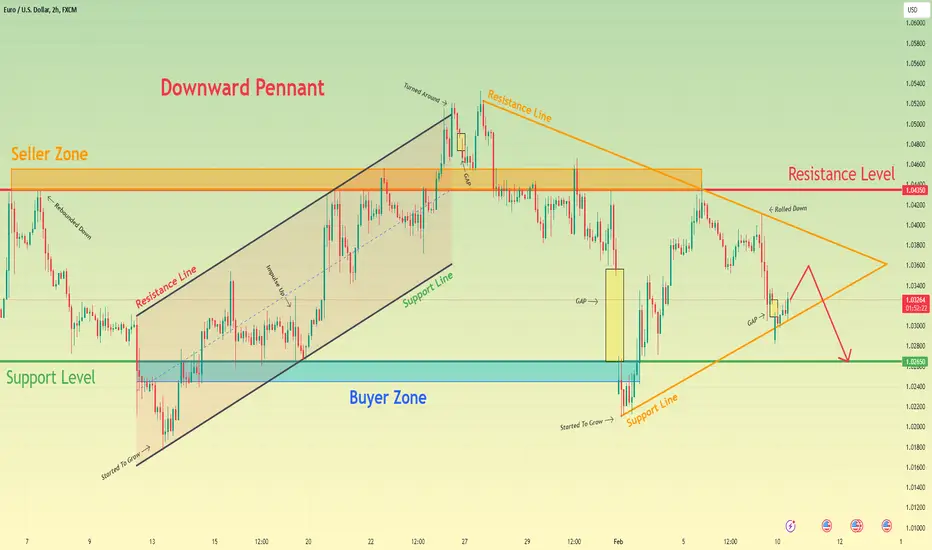
Euro can drop to support level, exiting from pennantHello traders, I want share with you my opinion about Euro. When analyzing the chart, it’s clear that the price initially climbed to the resistance level, which overlapped with the seller zone, but immediately bounced back and dropped to the support level. Shortly after, the Euro broke through the support level, falling below the buyer zone. However, it quickly reversed and began rising within an upward channel. Within this channel, the Euro broke the 1.0265 support level and performed a retest, consolidating near that level for a while before continuing its upward momentum. Eventually, the Euro reached the resistance level, broke through it, and moved up to the resistance line of the channel, ultimately exiting the channel. Afterward, the price formed its first gap and started declining within a pennant pattern, where it soon broke the 1.0435 resistance level. Later, the price created a strong second gap, dropped below the support level, and hit the pennant's support line. From there, the Euro began rising again, breaking the support level once more and climbing back to the resistance level. However, not long ago, the price fell back to the pennant’s support line, creating a third gap. In my view, the Euro can attempt to rise to 1.0360 before dropping back to the support level and exiting the pennant pattern. For this reason, I’ve set my take-profit target at the 1.0265 support level. Please share this idea with your friends and click Boost 🚀