The big picture on FacebookToday, we will show you a full analysis of FACEBOOK
Let's start on the Daily chart:
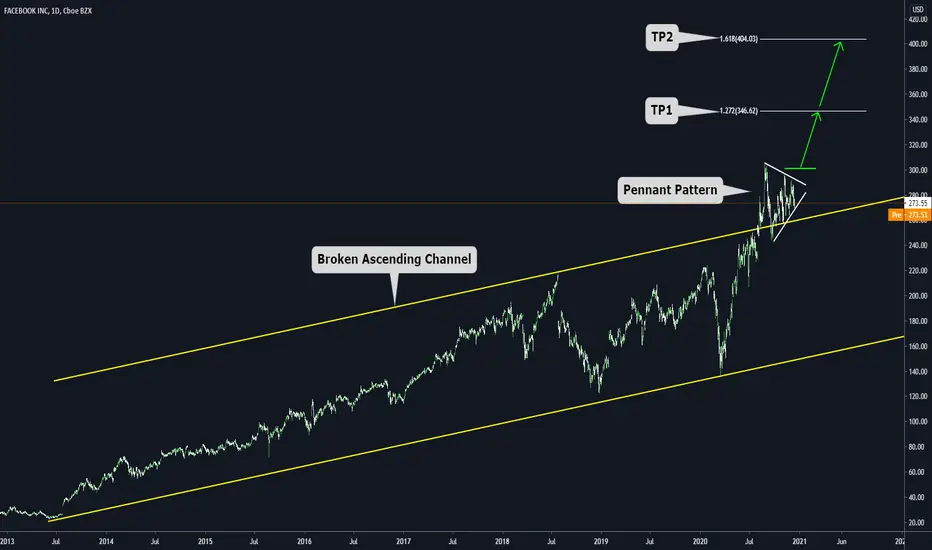
a) We can see an ascending channel that was formed from the early IPO of Facebook
b) Currently, the price is above the channel, showing a clear strength of the bullish trend
c) Above the channel, we have a pennant pattern (This type of patterns are known as continuation structures)
d) IF we have a breakout above 300. We will take it as a confirmation of the bullish movement towards the next target (TP1) and a final target on (TP2)
e) IF the price goes in the expected direction. We think the whole movement can take between 100 and 150 days.
4HS chart: Here its a zoomed view of the current pennant pattern