META Meta Platforms Options Ahead Of EarningsIf you haven`t bought META before the rally:
Now analyzing the options chain and the chart patterns of META Platforms prior to the earnings report this week,
I would consider purchasing the 710usd strike price in the money Calls with
an expiration date of 2026-6-18,
for a premium of approximately $89.30.
If these options prove to be profitable prior to the earnings release, I would sell at least half of them.
Disclosure: I am part of Trade Nation's Influencer program and receive a monthly fee for using their TradingView charts in my analysis.
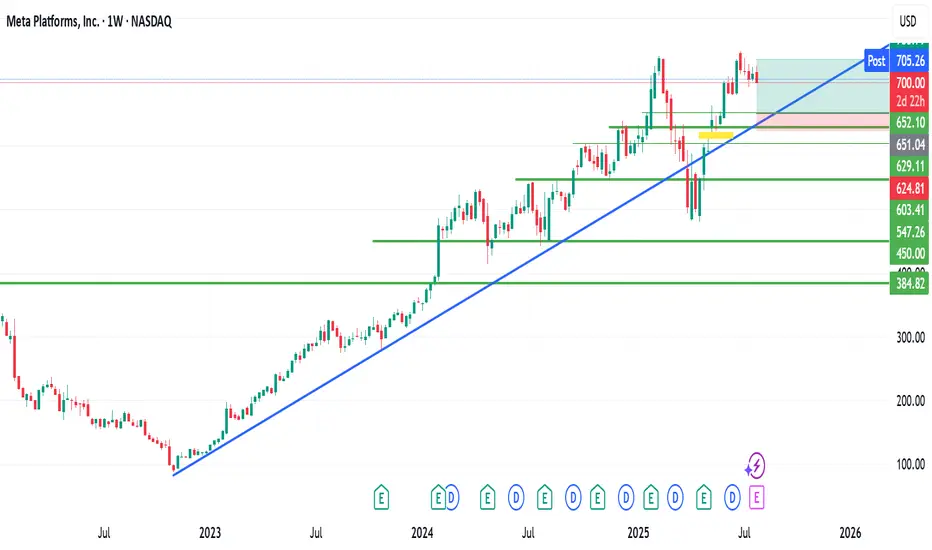
Is this possible with METAIs this possible with META?
META stock is currently trading at $700.
My technical view as shown on the chart, is looking at a possible retracement to around $650.
The question is ''Is this possible?
If it ever gets to this forecasted zone, I will accumulate massively.
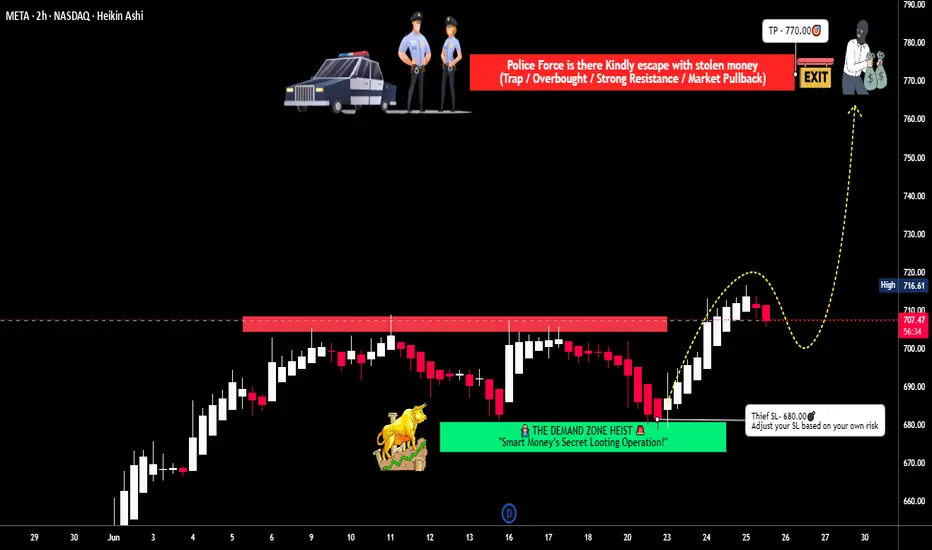
META Platforms Long Setup – Ready for the Next Move?💣 META Masterplan: Bullish Break-In Activated! 💼📈
🌟Hi! Hola! Ola! Bonjour! Hallo!🌟
Dear Money Makers & Silent Strategists, 🤑💰💸✈️
We’ve locked in on our next high-value digital vault: META Platforms Inc.
Built on our signature Thief Trading Style™ — where fundamentals meet stealth technical precision — this is your map to the bullish jackpot.
📍 ENTRY PLAN – Door’s Unlocked!
✅ Enter at any level — this heist is already in motion.
OR
🎯 Set your Buy Limit on a 15m/30m swing low or high — classic pullback infiltration.
🛑 STOP LOSS – Your Exit Route
Before breakout? Hold the line.
After breakout? Drop your SL at the recent 4H swing low – and size it to your risk appetite.
This isn’t luck — it’s calculated theft. 🔐
🎯 TARGET ZONE – Grab & Vanish
🎯 Aim: 770.00
But if the cops (aka sellers) show up early, get out with your loot — no shame in a clean getaway.
“Profit is the win. Perfection is fantasy.”
⚡ SCALPERS' TIPS – Quick In & Out
💵 Big wallet? Enter now.
💳 Tight budget? Follow the swing team.
Either way — longs only, and trailing SL is your safety rope.
📊 WHY META? – Intel Behind the Mission
🔍 This plan is reinforced by:
🔥 Strong Fundamentals
📈 Sentiment Signals
🧠 Quantitative + Macro Flow
💼 COT Data
🌐 Intermarket Correlations
It’s all aligning — the pressure’s building, and the breakout door is creaking open...
🚨 TRADING ALERT – Stay Outta Trouble
💥 Avoid placing new trades during major news drops.
🎯 Use trailing SL to protect and lock profits — your getaway vehicle must be ready.
💖 Support the Heist? Smash Boost!
Fuel the mission — every Boost empowers the crew.
This is Thief Trading Style — we don’t chase, we plan, strike, and vanish with the win. 🏆💪🐱👤
📡 Another breakout mission incoming. Stay hidden. Stay profitable. 🤑🚀
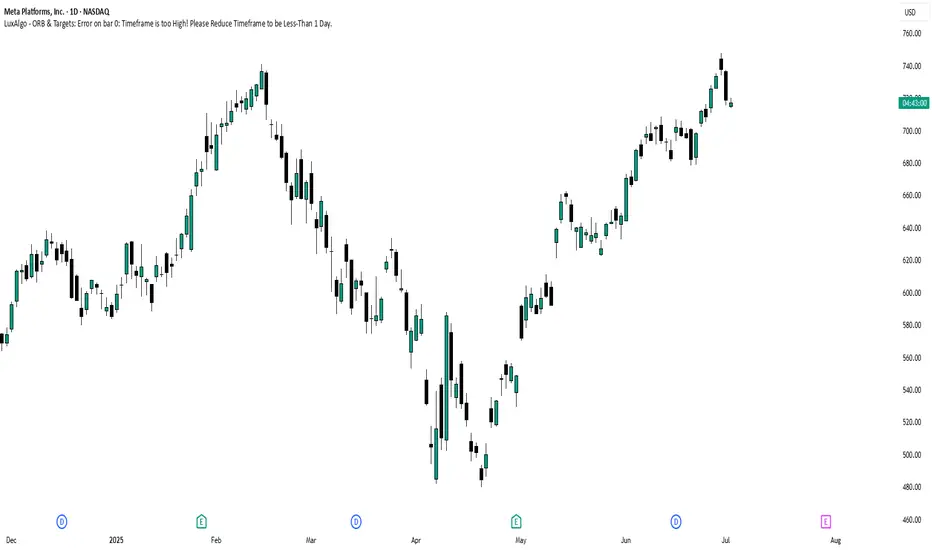
META Shares Signal Major Reversal Risk Amid Potential 2B Top PatThe shares of META, the NASDAQ-listed owner of Facebook, recently reached overbought levels as the stock price rose above its upper Bollinger Band and its Relative Strength Index climbed above 70. This suggests that META is likely to enter a period of sideways consolidation or perhaps experience a sharp decline.
However, traders should also pay close attention to a potentially larger reversal pattern known as a 2B top, which may currently be forming.
A 2B top is similar to a double top pattern, but typically the second high slightly exceeds the prior high before reversing. In this case, the high on 30 June 2025 exceeded the previous high set on 14 February 2025. The stock then fell sharply on 1 July, and if it continues to decline below support at $700, this would confirm the 2B topping reversal pattern.
Additionally, a break below support at $700 would signal the end of the uptrend that began on 1 May and also push the price below the 10-day exponential moving average, further confirming a trend reversal.
A decline below $700 could see the shares fall significantly, potentially erasing much of the gains recorded following the US-China trade negotiations held in Switzerland on May 12.
Notably, a price gap exists at $593, created by the announcement following those talks.
Alternatively, if the stock holds support at $700 and continues the uptrend, the 2b top is invalidated, and traders should look for even higher prices from this AI giant. The nice thing about the 2b topping pattern is that it provides an easy-to-identify invalidation price, which in this case would be above $748.
Written by Michael J. Kramer, founder of Mott Capital Management.
Disclaimer: CMC Markets is an execution-only service provider. The material (whether or not it states any opinions) is for general information purposes only and does not take into account your personal circumstances or objectives. Nothing in this material is (or should be considered to be) financial, investment or other advice on which reliance should be placed.
No opinion given in the material constitutes a recommendation by CMC Markets or the author that any particular investment, security, transaction, or investment strategy is suitable for any specific person. The material has not been prepared in accordance with legal requirements designed to promote the independence of investment research. Although we are not specifically prevented from dealing before providing this material, we do not seek to take advantage of the material prior to its dissemination.
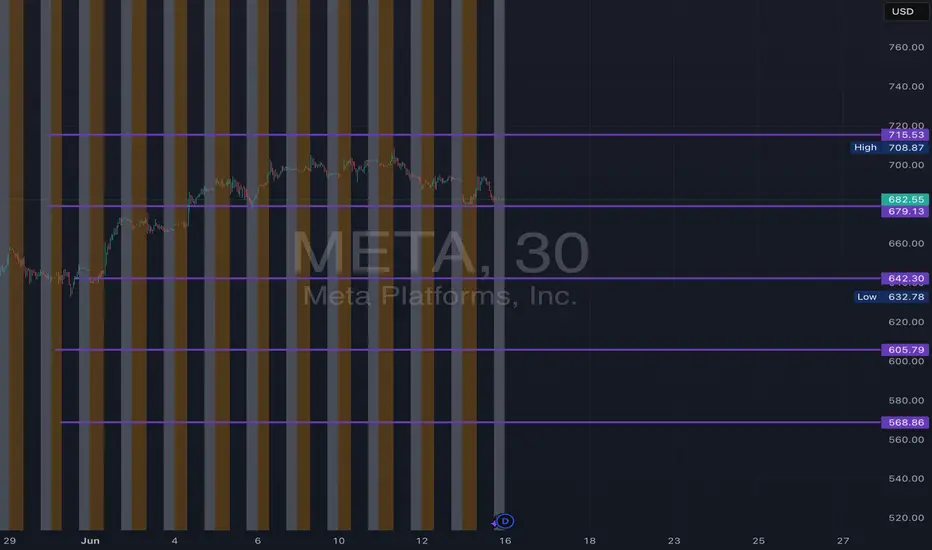
META June 2025 Monthly Support & Resistance Lines Valid till EOMOverview:
The purple lines serve as support and resistance levels for META stock throughout the month of June. When the price approaches these lines from either the bottom or the top, I will consider taking long or short positions in META stock, depending on the direction of the price movement.
Trading Timeframes
I usually use 30-minute candlesticks to swing trade options by holding 2-3 days max. Some can also use 3hr or 4hrs to do 2 weeks max swing trades for massive up or down movements.
I post these 1st week of every month and they are valid till the end of the month.
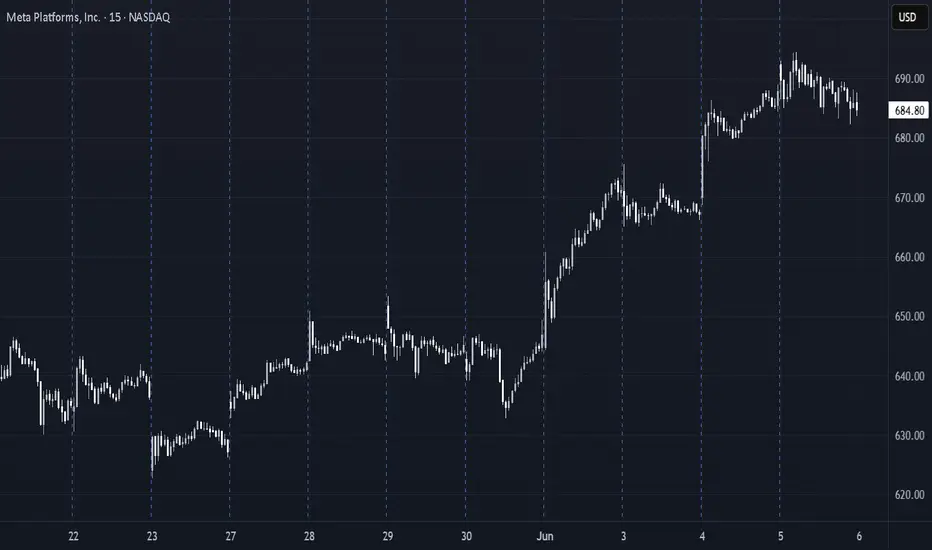
META Swing Setup – Long Call Into Overbought Strength📱 META Swing Setup – Long Call Into Overbought Strength
📆 Date: June 6, 2025
📈 Outlook: Moderately Bullish (10–14 day swing)
📊 Strategy: Buy naked call aiming for breakout above resistance near $700
🔍 Model Consensus Overview
Model Bias Strike Premium Target(s) Stop Confidence
Grok Contrarian 680P 13.25 +50% / -25% 75%
Claude Bullish 700C 10.38 $13.49 / $16.61 $7.79 75%
Llama Bullish 760C 0.97 ~100% Gain Below $680 80%
Gemini Bullish 745C 1.71 $3.42 / $5.13 $0.85 70%
DeepSeek Bullish 700C 10.50 $15.75 / $21.00 $7.00 75%
✅ Consensus Direction: Moderately Bullish
🎯 Key Technical Level: Resistance at $699–700
📊 Max Pain: $600 (ignored due to strong trend)
💡 Best Risk-Reward Strike: $700C – high OI & liquidity
⚙️ Technical Snapshot
Trend: Strong daily/weekly uptrend intact
Short-Term: Overbought RSI (77), 15-min consolidation
Support: $680–685
Resistance: $699–700
Volatility: VIX falling = stable setup
News: Sector strength and tech leadership intact
✅ Trade Setup
Metric Value
Instrument META
Direction CALL (Long)
Strike $700
Expiry 2025-06-20
Entry Price $10.38 (midpoint)
Profit Target $15.57 (50% gain)
Stop-Loss $7.78 (25% loss)
Size 1 contract
Confidence 75%
Entry Timing Market Open
🧠 Trade Management Plan
🎯 Targets
Take profit at $15.57
Optional second target: $16.61–$21.00 range if momentum is strong
🛑 Stop Triggers
Premium falls to $7.78
Underlying drops back below $680 (watch for trend break)
📆 Hold Duration
7–10 trading days max
Exit sooner if trend weakens or resistance rejection confirmed
⚠️ Risk Considerations
Overbought RSI: Pullback from $699 possible
Bid/ask spreads: Can widen in low volume
Max pain at $600: Could magnetize near expiration
Market volatility: Sudden macro shocks can derail momentum
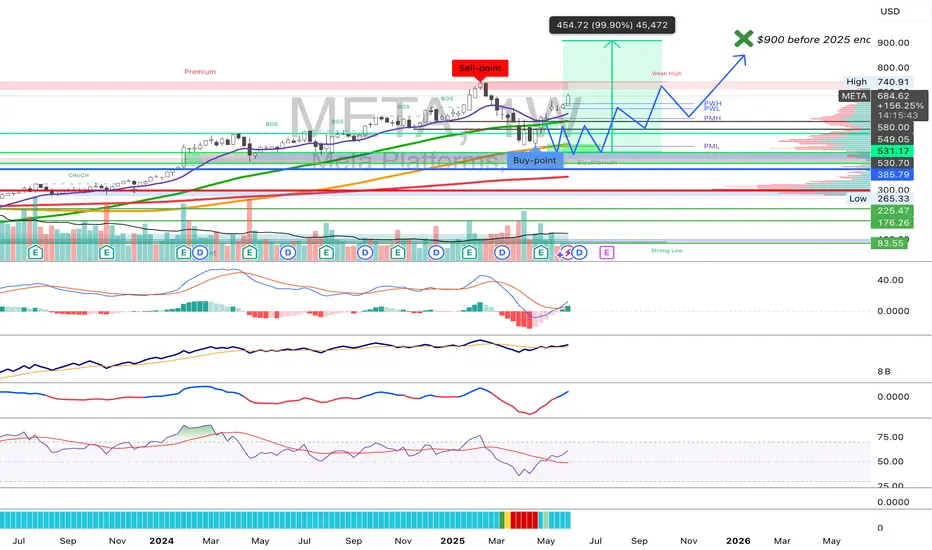
META long, I still think it can hit close to $900 usd in 2025-I've been bullish on NASDAQ:META , the stock (facebook's parent company) for awhile now. it still looks healthy having rebound off the 100 weekly SMA and is up already 38% from the bottom of the dip.
-Even though it performed lovely in 2024 I still believe it can go further before 2025 ends.
-I'm targetting $900 before the end of the year, it should be able to reach that price level.
-I don't see any reasons on the horizon to stop this uptrend from continuing.
Give me your arguments bears in the comment section ;)
"MASTER OF SOCIAL REALMS, META" How Does Meta Make Money?The long-term outlook for META stock looks pretty promising. Thanks to heavy investments in AI and the metaverse, along with steady growth in its advertising business, analysts predict the stock price could climb from its current level (around $640) to anywhere between $700 and even $2,000 by 2030. AI-driven improvements in ad efficiency and growing user engagement on platforms like Facebook and Instagram are major drivers. Plus, the company’s solid financials give it plenty of room to keep investing in the future.
That said, there are risks to watch out for, like tougher regulations in Europe, increasing competition, and uncertainty around the metaverse’s success. Overall, though, META’s strong position in tech and the market makes it a solid pick for long-term investors. Just make sure to weigh those risks before jumping in.

META Weekly Options Trade Plan 2025-04-16META Weekly Analysis Summary (2025-04-16)
Below is a synthesis of the analyses from all the models and a corresponding actionable trade idea:
──────────────────────────────
Comprehensive Summary of Each Model’s Key Points
• Grok/xAI Report – Noted that META’s price is well below its moving averages with a bearish MACD and near oversold RSI on the M5 chart. – Emphasized downside pressure with heavy put volume and a max pain at $540. – Recommended a bearish weekly trade with an emphasis on buying a put option—in their case, the $485 strike.
• Claude/Anthropic Report – Highlighted sustained downtrend (–13% over 5 days, –22% over 30 days) and all key EMAs trending lower. – Confirmed technical weakness with bearish MACD crossovers and RSI readings on both 5‐min and daily charts, despite a hint of potential short-term bounces. – Suggested buying a put option (their primary suggestion centered around a $480 put, though they mention liquidity and risk using nearby strikes).
• Gemini/Google Report – Noted that although META’s price touched lower Bollinger Bands and the RSI is near oversold territory, the dominant trend is bearish. – Confirmed heavy put open interest and significant recent declines. – Proposed a weekly trade buying put options near the $482.50 strike (ask ~$0.55) as the best balance between cost and risk/reward.
• Llama/Meta Report – Reiterated that technical indicators (price, EMAs, MACD, and Bollinger Bands) show a moderately bearish environment. – Favored the $482.50 put option with an ask around $0.55 because it fits within the ideal premium range and provides sound liquidity. • DeepSeek Report – Pointed to a sustained downtrend with consistent bearish signals on both the technical and sentiment fronts. – Recommended a weekly bearish put trade—selecting closely between a $485 or $482.50 strike—with defined risk targets.
────────────────────────────── 2. Areas of Agreement and Disagreement Between Models
• Points of Agreement – Every model sees META trading in a moderately bearish environment, with price action well below key moving averages and bearish MACD/Rsi signals. – All reports confirm that the short-term sentiment (supported by high volatility measured in VIX and heavy put open interest) leans toward further downside. – All agree that a weekly options trade is appropriate—and each favors a put option trade with strikes in the low-to-mid 480s range. – Liquidity and risk/reward are key, with the models collectively favoring strikes whose premiums fall in or near the ideal $0.30–$0.60 range.
• Points of Disagreement – There is a slight difference in strike selection: recommendations ranged between the $480, $482.50, and $485 puts. – Some emphasis was placed on avoiding a near-term bounce (with stop‐losses set at different levels); however, the differing exit strategies are minor and stem mostly from risk tolerance variations rather than a fundamental disagreement on the bearish bias.
────────────────────────────── 3. Clear Conclusion & Trade Recommendation
Overall Market Direction Consensus: All models converge on the view that META’s short‐term outlook is moderately bearish with technical indicators (price below major EMAs, bearish MACD, and relatively low RSI levels) coupled with the high-volatility environment pointing toward further decline.
Recommended Trade: • Instrument: META weekly options • Strategy: Buy single-leg, naked put options • Expiration: Weekly options expiring on 2025‑04‑17 • Selected Option: The $482.50 put (with an ask of ~$0.55) is favored. It offers a premium within the ideal range, and its “distance” of about 5.3% below current price fits a downward scenario. • Entry Timing: At market open • Risk/Reward Guidance: We target roughly a 100% gain (profit target around $1.10) on the premium while protecting with a stop-loss around $0.30 if the premium erodes significantly. • Confidence Level: 70% • Key Risks and Considerations: – A near-term bounce or oversold reversal (as indicated by the RSI and Bollinger Bands) could force a premature exit. – The max pain level of $540, while distant, is noted but considered less significant given the strong technical weakness. – Market volatility remains high; hence, strict adherence to the stop-loss is recommended to limit adverse moves.
────────────────────────────── 4. TRADE_DETAILS (JSON Format)
{ "instrument": "META", "direction": "put", "strike": 482.5, "expiry": "2025-04-17", "confidence": 0.70, "profit_target": 1.10, "stop_loss": 0.30, "size": 1, "entry_price": 0.55, "entry_timing": "open" }
Disclaimer: This newsletter is not trading or investment advice but for general informational purposes only. This newsletter represents my personal opinions based on proprietary research which I am sharing publicly as my personal blog. Futures, stocks, and options trading of any kind involves a lot of risk. No guarantee of any profit whatsoever is made. In fact, you may lose everything you have. So be very careful. I guarantee no profit whatsoever, You assume the entire cost and risk of any trading or investing activities you choose to undertake. You are solely responsible for making your own investment decisions. Owners/authors of this newsletter, its representatives, its principals, its moderators, and its members, are NOT registered as securities broker-dealers or investment advisors either with the U.S. Securities and Exchange Commission, CFTC, or with any other securities/regulatory authority. Consult with a registered investment advisor, broker-dealer, and/or financial advisor. By reading and using this newsletter or any of my publications, you are agreeing to these terms. Any screenshots used here are courtesy of TradingView. I am just an end user with no affiliations with them. Information and quotes shared in this blog can be 100% wrong. Markets are risky and can go to 0 at any time. Furthermore, you will not share or copy any content in this blog as it is the authors' IP. By reading this blog, you accept these terms of conditions and acknowledge I am sharing this blog as my personal trading journal, nothing more.

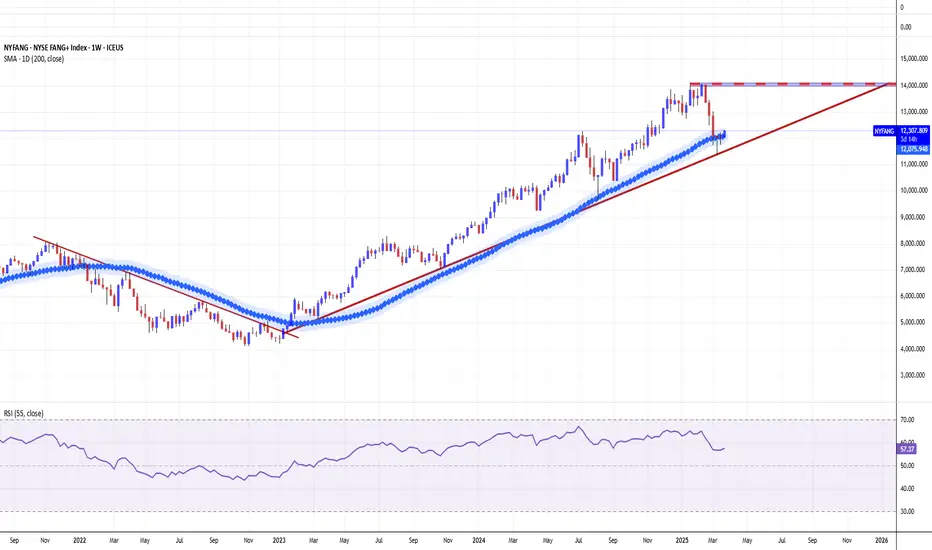
U.S. Big Tech 10 (NYSE FANG+) Index. Another Day. Another DollarThe remarkable performance of U.S. large cap equities in the past two years was closely tied to the dominance of tech-related sectors, exemplified by companies akin to those in the high-performing NYSE FANG+ Index ICEUS:NYFANG .
The NYSE FANG+ Index (“Index”), also known as the NYSE U.S. Big Tech 10 Index, is a rules-based, equal-weighted equity benchmark designed to track the performance of 10 highly-traded growth stocks of technology and tech-enabled companies in the technology, media & communications and consumer discretionary sectors.
The Index undergoes a reconstitution quarterly after the close of the third Friday in March, June, September and December (the “Effective Date”).
The NYSE FANG+ Index provides exposure to 10 of today’s highly-traded tech giants
Access the index through a futures and options contract designed to help you increase or reduce exposure to this key group of growth stocks in a capital-efficient manner.
Ten constituents of The U.S. Big Tech 10 (NYSE FANG+) Index as of Friday, December 9,
2022 (10% equal weighting):
Meta NASDAQ:META
Apple NASDAQ:AAPL
Amazon NASDAQ:AMZN
Netflix NASDAQ:NFLX
Microsoft NASDAQ:MSFT
Google NASDAQ:GOOGL
Tesla NASDAQ:TSLA
NVIDIA NASDAQ:NVDA
Snowflake NYSE:SNOW
Advanced Micro Devices NASDAQ:AMD
The main technical weekly graph indicates The U.S. Big Tech 10 (NYSE FANG+) Index remains aboму 200-day SMA (so far), following the upside path that has been taken in early 2023 after 50 percent decline in 2022.
--
Best wishes,
@PandorraResearch Team
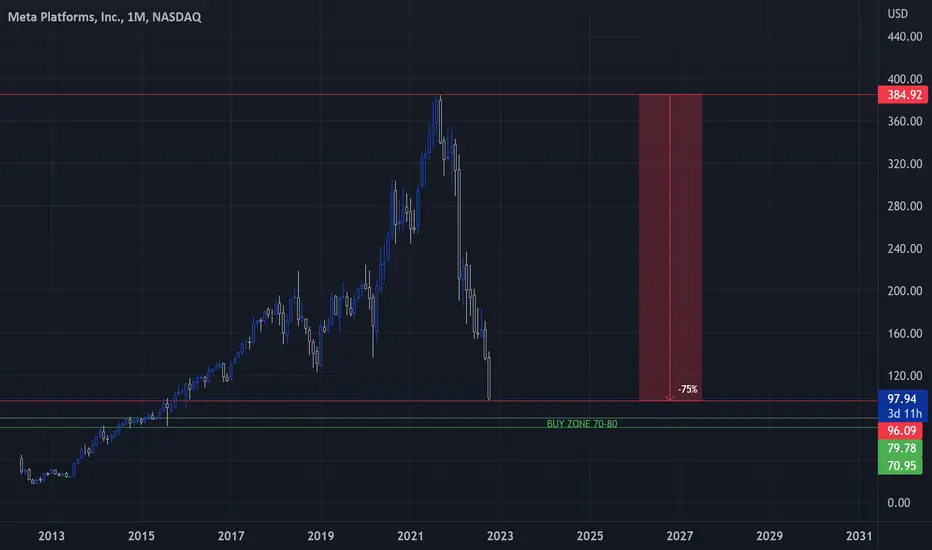
MetaRekt- They said " Cryptos are volatile and Dangerous ".
- was meaning like, buy Stocks they are more stable, like Facebook 😂.
- Everything is in graph
- Meta went down -75%, Elon Musk bought Twitter, what a coincidence.
- i wouldn't take the risk to touch it before it goes to 70-80$.
- Well in fact, i won't touch it at all, Facebook Golden Age is already behind them.
- Decentralization will be the major key to upgrade our future social medias in Web3.0.
- Without us, they are nothing.
Happy Tr4Ding !
Meta Driving Towards $542Meta still has potentially further to fall before it finds support.
Good luck!

Meta’s Wild Ride: Skyrocketing to $866 or Crashing to $374 Get ready, traders—Meta’s at a crossroads! If we smash past $64.70, buckle up for a thrilling climb to $866 as AI hype and Metaverse dreams fuel the fire. But if the bears take over, we could tumble hard to $442—or even skid down to $374. This isn’t just numbers; it’s a rollercoaster of hope, greed, and nail-biting suspense. Which way will it break?
Kris/Mindbloome Exchange
Trade Smarter Live Better

META - Top of Up ChannelMETA is at the top of a dominant channel
A kind of angled head and shoulder pattern can form if we assume a downward move on the right side
Downward move to the middle of the channel which I have labelled with the price label
Weekly timeframe

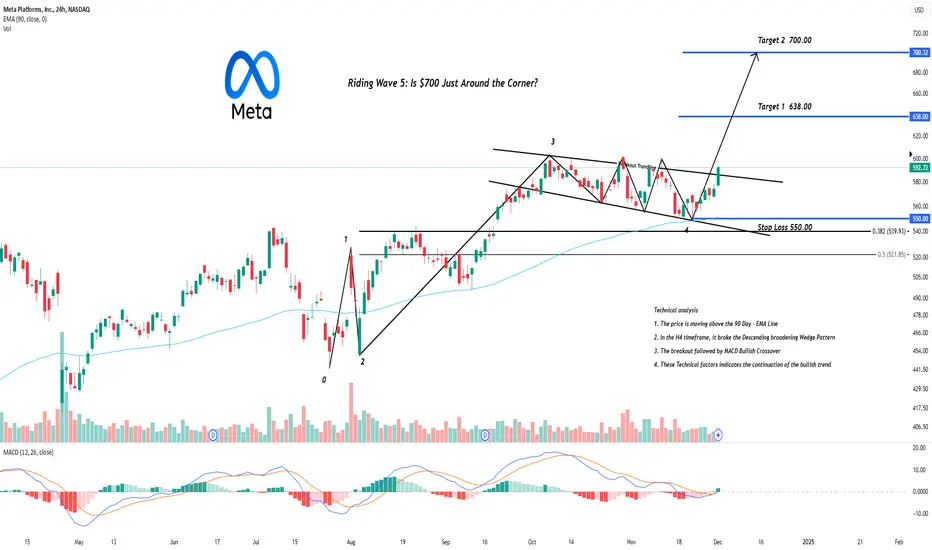
Riding Wave 5: Is $700 Just Around the Corner?Hey Realistic Traders, Will META Bullish Bias Continue ? Let’s Dive In....
In the Daily timeframe, META rebounded above the 38.2% Fibonacci level, marking the completion of wave 4. Within this wave, a Descending broadening wedge pattern was formed. Recently the price has broken out of the pattern. This breakout was further confirmed by a bullish MACD crossover, signaling increasing momentum and strengthening the case for a continued upward move.
Based on these technical signals, I foresee a potential upward movement toward the first target at $638. After reaching this level, a minor pullback is likely before the rally continues toward a new high at $700.
This outlook remains valid as long as the price holds above the stop-loss level at 550.00.
Support the channel by engaging with the content, using the rocket button, and sharing your opinions in the comments below.
Disclaimer: "Please note that this analysis is solely for educational purposes and should not be considered a recommendation to take a long or short position on META.
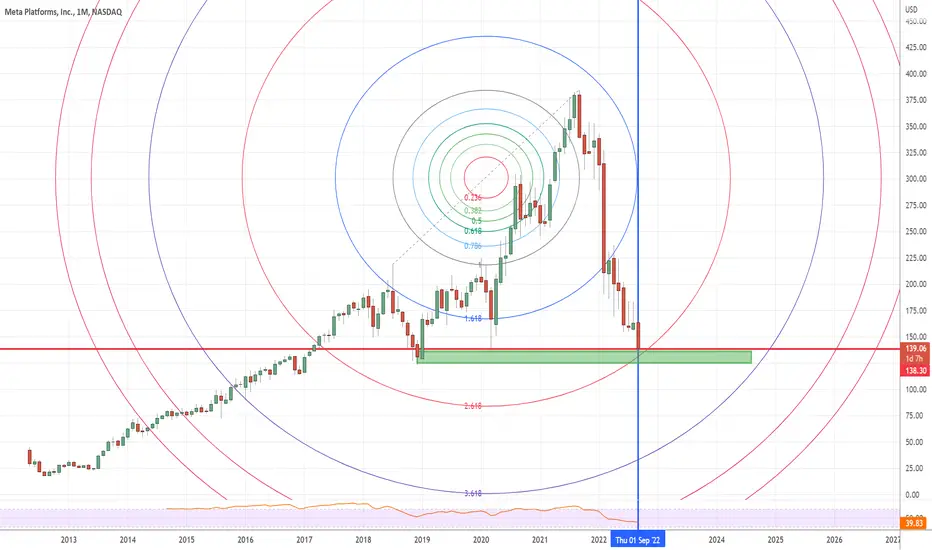
Facebook,Can we call at least a MINOR Bottom by the End of Sep.?Meta corporation shows some sort of balance both price and time
I think we can call a Bottom , at least a minor one by the end of this month
look like the Q4 shows some optimism
IMO, look for good entries according to your plan in lower time frames.
we are @ previous supportive area .
Trade Safe
Dr.Sherif Aborehab
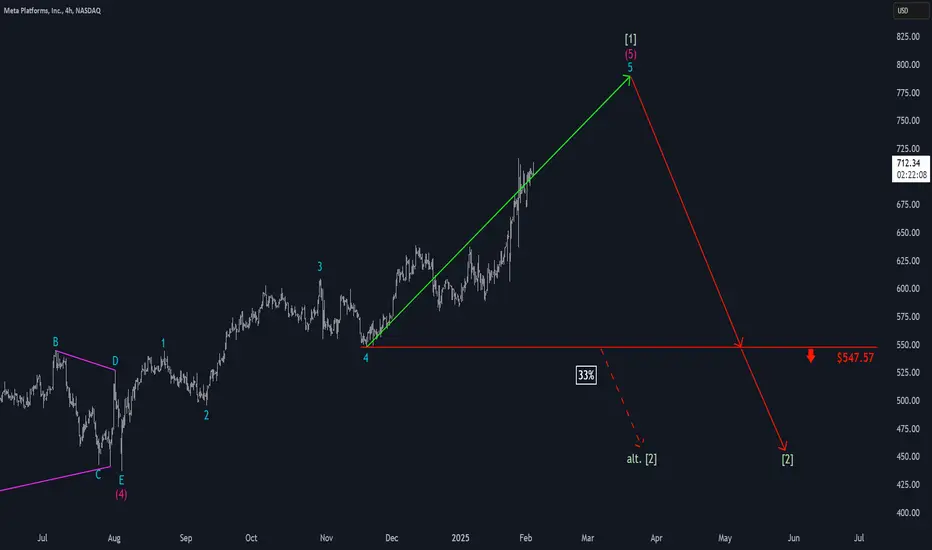
Meta: Breakout!META has successfully broken out of its previous consolidation, extending a powerful uptrend. This nearly “correction-free” rally has once again pushed the stock to new record highs, which aligns perfectly with our primary expectation of further gains during the larger green wave . However, given the extent of this advance, META remains vulnerable to pullbacks. Thus, we assign a 33% probability to an immediate transition into a wave alt. correction, which would be triggered by a drop below the $547.57 support.
Meta Platforms - The Breakout Rally To $1.000!Meta Platforms ( NASDAQ:META ) is about to break out:
Click chart above to see the detailed analysis👆🏻
Ever since Meta Platforms - formerly known as Facebook - was listed on the Nasdaq, this stock has been creating new all time highs over and over again. Also over the past couple of months, momentum was pretty strong and a triangle breakout seems inevitable.
Levels to watch: $650, $1.000
Keep your long term vision,
Philip (BasicTrading)

Meta, time to enter?Hi everyone!
Pattern: Meta formed an ascending triangle from Jan 2024 up to Sep 2024 where it broke out of the pattern. Currently retesting the breakout level and has potential for long entry.
Price target: The price target for ascending triangle breakout pattern is the measure of the height of the triangle from its base to the resistance line. Add this to the breakout point and we get the target price of 670$
Caution: If the price fall back to the triangle, this analysis is not valid anymore.

Just In: $META Up 3% Premarket Trading Today After Q4 Beat.In a surprising turn of event, shares of Microsoft fell in Europe on Thursday after it issued a downbeat forecast for its cloud business, while Facebook parent Meta shares ( NASDAQ:META ) rose after beating expectations, as investors scrutinised the companies' spending on artificial intelligence.
Microsoft shares traded down 4.5% on the Frankfurt market, having fallen a similar amount in after-hours trading on Wednesday and finishing the regular session down 1.1%.
Meta shares however, opened up 2.5% in Germany, having risen 2.1% after the closing bell and ending the regular session up 0.3%.
Days after Chinese upstart DeepSeek revealed a breakthrough in cheap AI computing that shook the U.S. technology industry, the chief executives of Microsoft and Meta defended massive spending that they said was key to staying competitive in the new field.
Meta CEO Mark Zuckerberg said Wednesday’s that the rapid rise of competitors from China has only strengthened the tech giant’s commitment to its AI ambitions.
The CEO said it’s too early to know how growing competition from China could impact its future investments. Meta reiterated its forecast of $60 billion to $65 billion in capital expenditures this year.
Technical Outlook
as of the time of writing, NASDAQ:META shares is up 2.81% in Thursday's premarket session. NASDAQ:META closed Wednesday's session with the overbought Relative Strength Index (RSI) of 71.87. however, NASDAQ:META doesnt seem to be cooling off any moment with the shares moving above key MA this only solidifies the fact that NASDAQ:META could bridged the $700 pivot point. However, in the case of a drawback, NASDAQ:META 's should find support in the 38.2% Fibonacci retracement point a level that aligns with the $640 price action.
META at ATHMETA stock at ATH
Our technical analysis was highly respected by META stock.
The $674 zone is now the latest resistance zone.

Meta and Bitcoin BINANCE:BTCUSDT
If we compare just yearly timeframes Meta and Btc
Meta drop and absorb previews 6 years move. 77% from top.
Btc 77% from top.
When everyone called Meta is dead now its 59% move.
59% on BTC its around 26300$.
Yearly Timeframe.
I’m not waiting BTC over 36K this year. All global analysis for BTC 2023 posted.
Crypto correlate with Stocks almost in every single move but with lag of time.

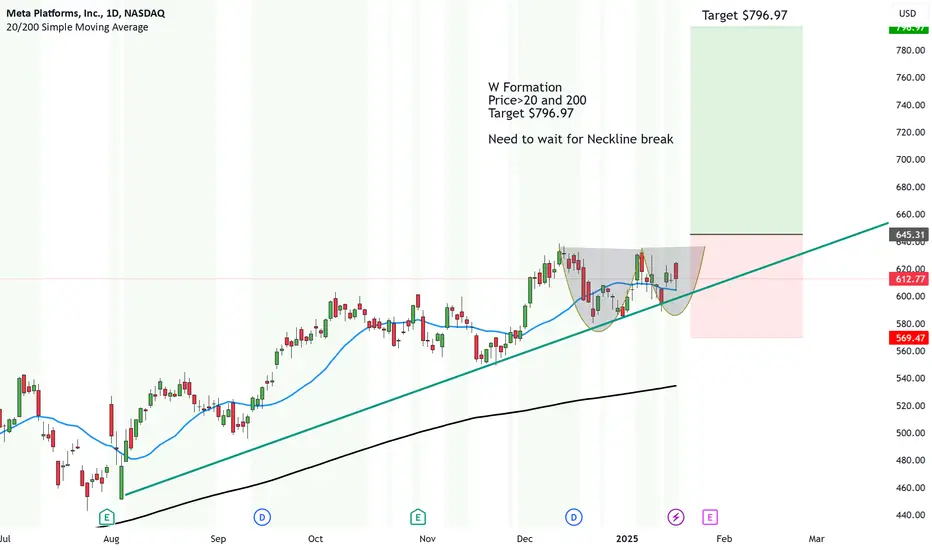
Meta is lining up for MAJOR upside thanks to possibly TikTok!TECHNICAL:
We have a strong W Formation forming on Meta.
We just need the price to break above the Neckline. Other indicators show Price is above the 20MA and the 200MA and things fundamentally are looking very strong for META going into 2025.
So first target will be at $796.97.
As Zuck is making major changes to make them more in line with X's policies and cutting some red tape.
FUNDAMENTAL RANT:
The whole TikTok ban and its quick comeback seem like a setup. On the same day TikTok got banned, Facebook conveniently made a TikTok account and told people to link their accounts. Oh, and guess what? Some senators just happened to buy Meta shares right before the ban.
Trump, who originally banned TikTok back in 2020, made a big deal about bringing it back, acting like a hero and making it all about himself.
I wouldn't be surprised if Meta announces a partnership with TikTok’s CEO, Mr. Chou, and possibly grab a 50% stake in TikTok to ease concerns about cybersecurity in the U.S. Meanwhile, Americans are jumping to Red Note— voluntarily giving their information away and because they are tired of the Oligarchy.