$BTC Macro OutlookWeekly Chart
BTC is still trading inside the macro range at $111,959.5–$119,655.0. Last week closed green but as an inside bar, which signals indecision. We also printed a failed auction above the prior higher-high vLevel—hinting at trend fatigue and the risk of a deeper pullback.
As long as price holds $111,959.5, the broader bullish structure is intact. A weekly close below $111,959.5 would likely open room toward the next vLevel near $98,115.4. Until this range resolves, expect two-sided trade and respect the extremes.
Daily Chart
Today’s candle closed as a shooting star (bearish pin bar) with elevated Relative Volume (RVOL), a classic reversal signal at resistance. On the Footprint, delta finished negative and, more importantly, VAH, VAL, and the POC all sit inside the upper wick, which tells us most of the trading occurred near the highs. That’s typical of late longs getting trapped.
With the daily trend pointing lower, the base case is a rotation toward the $111,910 vLevel. Until conditions change, treat bounces as opportunities to stay aligned with the bearish daily momentum.
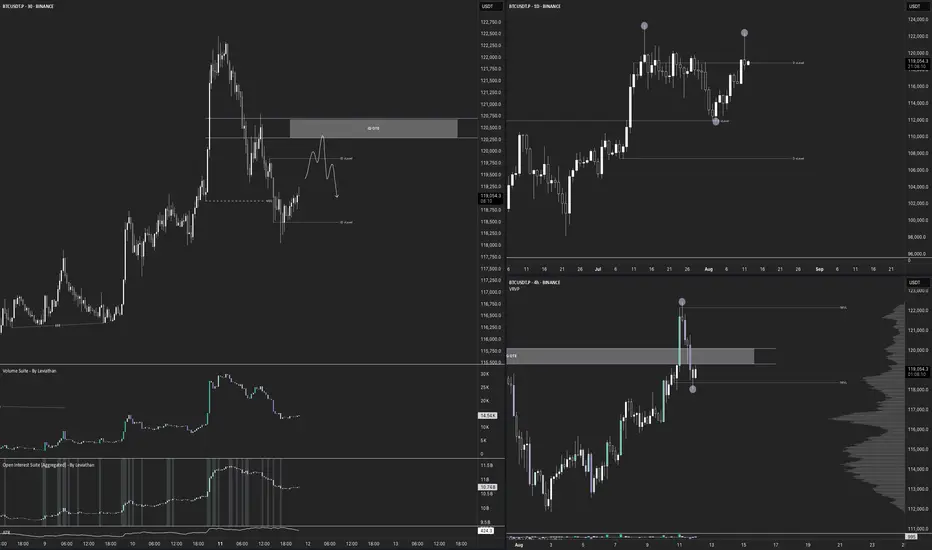
12-Hour Chart
Structure is still bullish, but this push looks more like a liquidity sweep above the prior range highs, right where most short stops sit; than true initiative buying. If we fail to gain acceptance above the breakout and rotate back inside the range with sell-delta/absorption at the highs, I’ll treat it as a failed auction and look for rotation back toward the range low.
4-Hour Chart
After a clean macro Over/Under, the 4-hour has rotated back into the SWING OTE zone, exactly where I want to be stalking shorts. Despite the 4H still reading structurally bullish, price is boxed inside $118 395.8–$122 165.4 and keeps showing responsive selling into the upper range. For a swing short, the key now is the 30-minute: Invalidation is acceptance above $122 165.4; below that, the short idea stays in play. We’ll break down the 30-min setup next.
30-Minute Chart
The 30-minute is flashing a clean spike in both CVD and Open Interest, fresh longs chased the intraday pump. Best case from here is a full fade of that impulse, turning late buyers into exit fuel. Leverage looks elevated, so a liquidity flush is very much on the table if price can’t hold acceptance above the spike. I’m placing limit shorts inside the intraday OTE zone with my stop just above 122 165.4.
Failedauction
$BTC Daily OutlookBINANCE:BTCUSDT.P
Weekly Chart:
Bitcoin has now printed three consecutive weekly closes above the former higher-high threshold at $111 960. That series is enough to confirm a clean breakout of the prior HH-HL range and keeps the long-term bias pointed firmly higher.
That said, a near-term pullback is still on the table:
• First support — the breakout shelf at $111 960 (re-test of structure).
• Deeper support — the next V-level around $98 115.
Why the caution?
Last week’s candle left a small Failed Auction just above the new high, and Footprint data shows a cluster of aggressive buy-delta trapped in that wick. Those buyers may need to get washed out before the trend resumes.
Big picture: weekly structure is bullish; any dip into the levels above is a potential reload zone while the breakout holds.
Daily Chart:
Price action remains firmly bullish: multiple Failed-Auction rejections at the $116 860 higher-low vLevel keeps supply thin and reinforce the up-trend toward the prior ATH.
That said, remember Auction Market Theory rule #5: “When time or volume builds at the edge of balance, price often pushes through.”
• Each failed auction is absorbing resting bids.
• If sellers lean in again with size, the level can flip from support to resistance very quickly.
In practice that means:
•Base case – continuation to the highs while the Daily structure holds.
•Risk scenario – a clean break of $116 860 would open room for a deeper weekly pullback toward $107456.0
For now we treat the current weekly pullback as a fresh opportunity: scouting intraday longs as price reacts to the 1-Hourly zone.
From the footprint read-out, today’s bar finished with a neutral delta, but note where the profile is stacked: both the Value Area Low and the POC sit right at the bottom of the candle. That tells us the bulk of volume printed down at the session lows and it skewed negative, sellers were leaning hard, trying to extend the move lower.

Got filled at the bugattiMy hedge short is filled
continuation of my other chart
IF this is good the target it the!!....
key levels will be longed if data aligns.
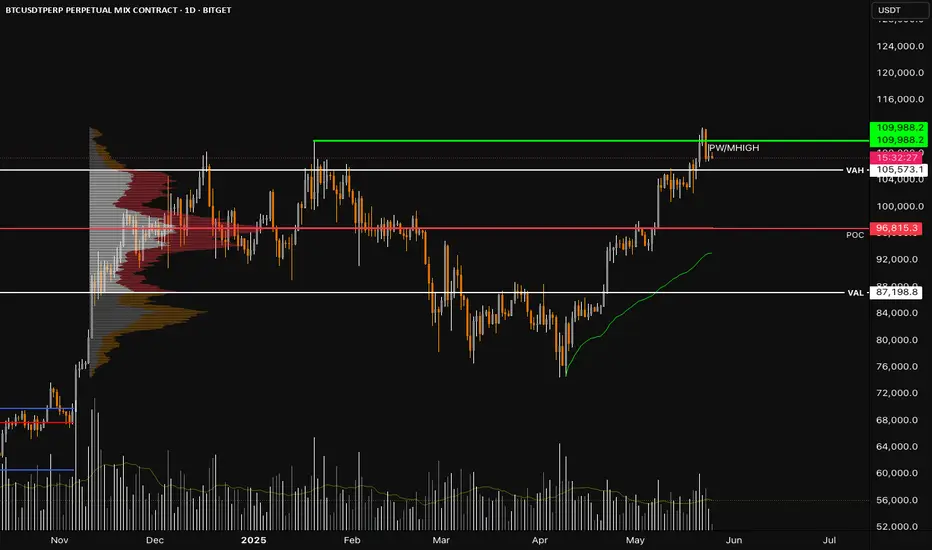
Deeper Retrace if previous monthly high and VAH are lostBTC has made a strong move up recently, but we’re now trading just above key contextual levels that could act as a tipping point if lost. Do we look for a failed auction?
🧭 Key Levels on Watch:
• PW/MHIGH (Previous Week and Month High): ~109,988
• VAH (Value Area High): ~105,573
• POC (Point of Control): ~96,815
• VAL (Value Area Low): ~87,198
• Anchored VWAP from the April low is rising steadily and currently converging with the POC.
🔍 What to Watch For:
We’ve wicked above the monthly high and are now showing signs of stalling. If BTC fails to hold above the VAH (~105.5k), it would suggest acceptance back inside the prior value area. This could open the door for a rotation lower toward the POC (~96.8k) — the area with the highest historical volume and strong structural support.
🟢 Anchored VWAP Support
The anchored VWAP from the April low continues to rise and is on a collision course with the POC. This area could become a magnet for price, offering confluence for a potential bounce or reaccumulation zone.
⚠️ Scenario Outlook:
• Lose PW/MHIGH → Caution
• Lose VAH and hold below → Expect rotation to POC
• VWAP + POC convergence could be a key buy zone if tested
This is a classic example of auction market theory in action: acceptance back into value often leads to a revisit of the point of control.
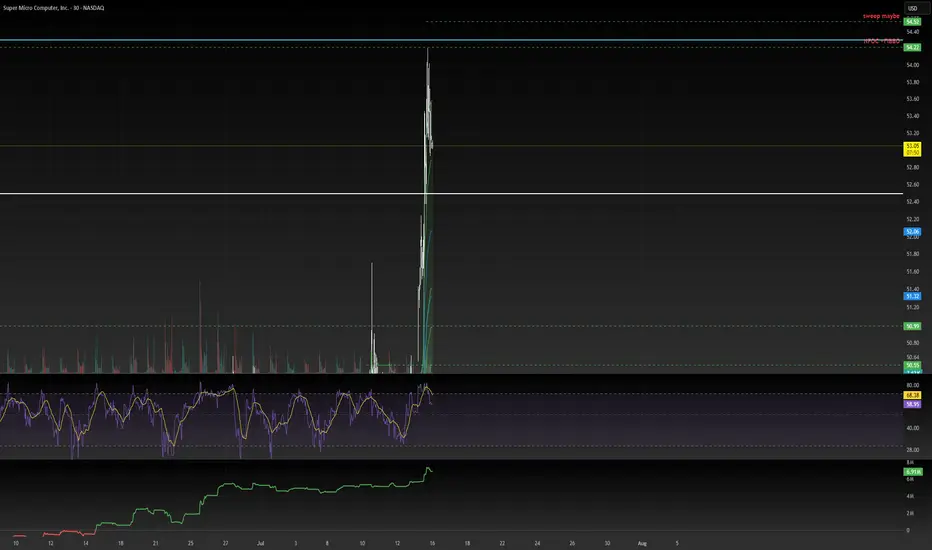
BTC Short Trade Setup - Head and Shoulders Pattern!BINANCE:BTCUSDT INDEX:BTCUSD BYBIT:BTCUSD
This is my short trade setup that I have just taken.
If you missed the trade, wait for a retrace to get in.
Head and Shoulders pattern on the 30m chart with TPO and CVD confirming the trade. CVD looks to be leading price bearish and we have had a failed auction on the TPO chart
Open interest also indicating this is a high probability trade.
All the details in the video
Not Financial Advice. DYOR. Papertrade before trading with real money.
If you liked this idea, please give it a thumbs up and follow. Comment on how you are trading BTC right now.
Safe trading!
Shawn
