Bitcoin's Roadmap: Price Structure, Fair Value & Market RhythmSince bottoming on November 21, 2022, Bitcoin has embarked on a remarkable bull run, rising +623.5% over 927 days and reaching a new all-time high (ATH) of ~112K.
When compared to the previous bull cycle, spanning 1061 days and producing a +2086% gain, this current rally shows signs of diminishing returns, a typical behaviour of maturing markets. Traders now face a critical question: has Bitcoin peaked for this cycle, or is another surge toward ~120K+ possible?
Historical Echoes: Elliott Wave Comparison
The 2018–2021 bull market formed a five-wave Elliott structure. That cycle ended with a -77.5% correction. The current cycle similarly traces out a completed five-wave advance from the $15.5K low, suggesting we may now be in a corrective phase.
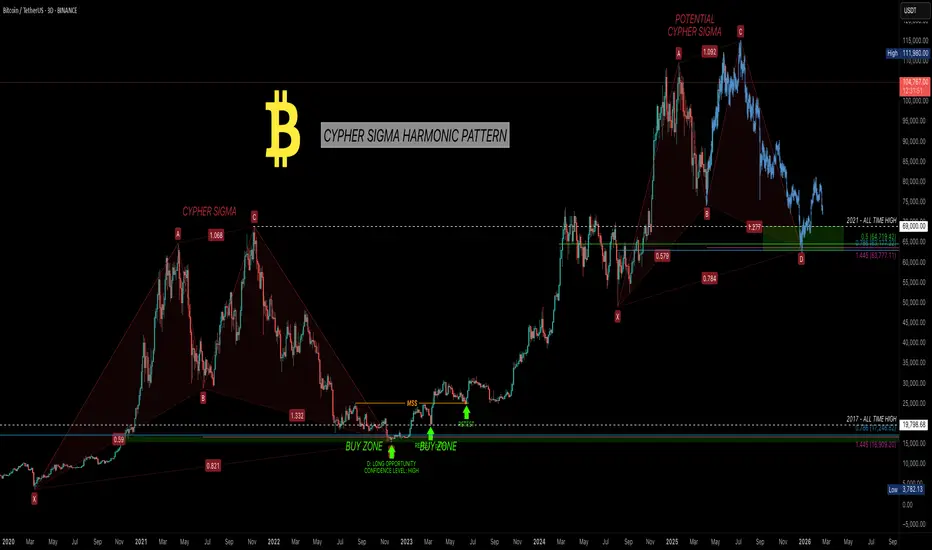
Current hypothesis: Bitcoin is in Wave B of an ABC correction, with Wave C potentially targeting $64K–$70K.
Harmonic Confirmation: Cypher Sigma Pattern
A refined harmonic formation, I call it the Cypher Sigma Harmonic Pattern (CSHP) and it has proven highly effective in volatile assets like Bitcoin. It differs from the classic Cypher by:
BC projection: 1.07–1.136 of XA (vs. 1.272–1.414)
CD retracement: 0.786–0.886 of XC
BD extension: 1.272–1.618 of BC (not present in traditional Cypher but often targets 1.272-2.0)
In 2022, this pattern predicted the bottom near $16K. Currently, another Cypher Sigma is potentially forming, pointing to a possible correction to ~$64K. This target aligns with historical level (the 2021 ATH zone) and represents a possible -40% pullback.
Multi-Layered Technical Confluence
Pitchfork Resistance: Bitcoin rejected the upper resistance (Fib 1.0–1.136 zone)
Pitchfork Golden Pocket Support: ~$64K matches the golden pocket and high-liquidity area
Fibonacci Circles: Rejection precisely at the 1.618–1.65 circle arc (~$112K)
Speed Fan 0.618: Key structural support intersects projected retracement zone
Previous 2021 ATH
Together, these tools strongly support the hypothesis of a macro top forming.
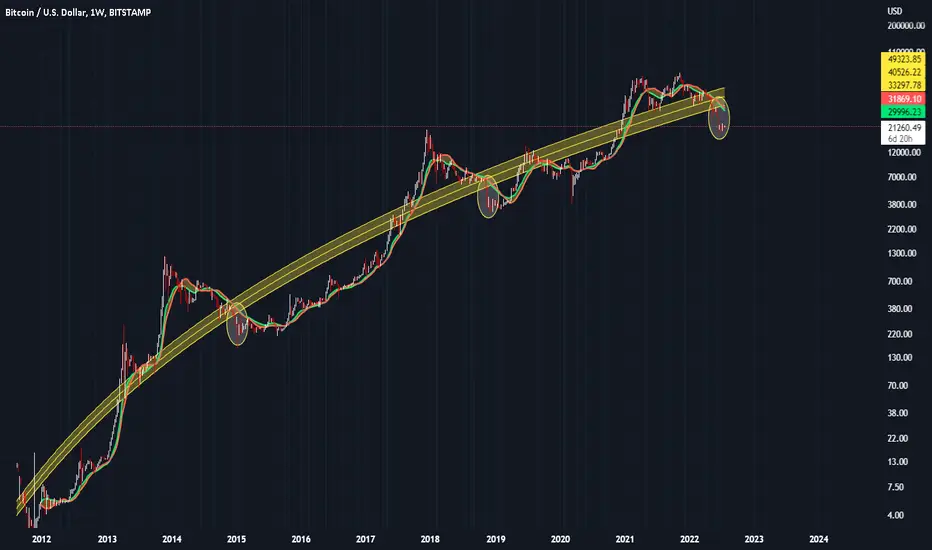
Fair Value Trend Model (FVTM) – New Indicator
As part of ongoing research into Bitcoin’s long-term valuation, I developed the Fair Value Trend Model—a logarithmic regression-based indicator tailored for Bitcoin. Here is an example on the monthly timeframe.
Key Features:
Computes a log-log regression: ln(Price) vs ln(Days since inception)
Yields a power-law growth curve: F(t) = C · ^b
Includes dynamic channel bands at user-defined percentage offsets
Projects the trend forward in time with linear extrapolation
I have just freshly published this indicator for free on TradingView. Visit my profile, add it to your chart, and explore how Bitcoin consistently revisits its fair value in bear markets before launching new macro waves.
Use Cases:
Identify overextensions above the fair value channel
Spot mean-reversion setups near the lower channel band
Gauge long-term trend continuation via slope and forecast
The indicator is best used on daily, weekly and monthly charts, and it supports both all-time and rolling-window modes.
Educational Insight:
The Fair Value Trend Model isn’t just a tool! It's a lens to view the long-term rhythm of the Bitcoin market. By understanding where the fair value lies, you gain the clarity to separate short-term volatility from long-term opportunity.
Every great trader starts with a desire to understand. If you're learning, experimenting, and observing patiently—you’re on the right path. Let this model be your guide through the noise. Trust the math, respect the cycles, and never stop refining your edge.
Study day and swing trading, improve your technical and psychological skills, and wait patiently for high-probability trade setups, whether short-, medium-, or long-term. Being patient is key.
Psychological Insight: Mastery Over Impulse
The greatest returns favour the patient. Traders who ignored the noise in 2022 and accumulated around $16K were rewarded exponentially. As Bitcoin potentially enters a correction, the same principle applies: monitor, learn, and prepare—not panic.
Top-tier traders execute based on structure, not emotion. This cycle will reward those who:
-> Study multi-timeframe confluences
Outlook: Bearish Retracement, Bullish Opportunity
While a push to $120K+ is possible, the confluence of Elliott Wave, harmonic patterns, and macro tools suggest a potential 40% retracement into ~$64K by end of 2025/early 2026. This aligns with historical patterns and may offer a great buying opportunity.
This cycle isn’t about catching the exact top—it’s about navigating it intelligently. Use tools that reflect structural value, not just reactive price action. Combine the Fair Value Trend Model with other tools to gain clarity. Most importantly: remain curious, remain disciplined.
Happy trading.
Thanks for reading =) stay sharp, stay patient, and keep evolving 🚀
_________________________________
If you found this helpful, leave a like and comment below! Got requests for the next technical analysis? Let me know.
Fairvalue
$HIMS : YOU DON'T OWN ENOUGH OF THIS NAME HEADING INTO EARNINGS!NYSE:HIMS WHY YOU SHOULD BUY BEFORE EARNINGS.
In this video, we talk about:
1.) Why the stock is crashing
2.) Why everything on the Technicals/ Fundamentals point to a STRONG BUY.
3.) My earnings prediction & fair value
Thanks for watching! I know it was a longer video, but I always want to be thorough.
Comment below if you like this type of content or if your not a fan of videos and rather have posts.
NASDAQ:SOFI REPEAT INBOUND!
NFA
#BuyingOpportunity #BuyTheDip

Fair Value for S&P 500, Price Targets for the next 12 monthsGoing into next week I calculate fair value for the S&P 500 to be between 5,400 and 4,800 with an average target of 5,100 over the next 12 months. The low end of the range factors in any chance that we see the economy creep to a stagnant point over the next 12 months.
If by some miracle the economy should continue to experience above average GDP growth, the S&P 500 could go as high as 6,300 in the year ahead
Investors should be cautious about making any large stock purchases if we continue to see unemployment rise and GDP growth slow.
Holding off for better buying opportunities is for the best with the S&P 500 above the 5,400 level. The market is likely to continue to see downward pressure. Right now, earnings growth projections are lofty and likely to be revised downward over the next 6 months.

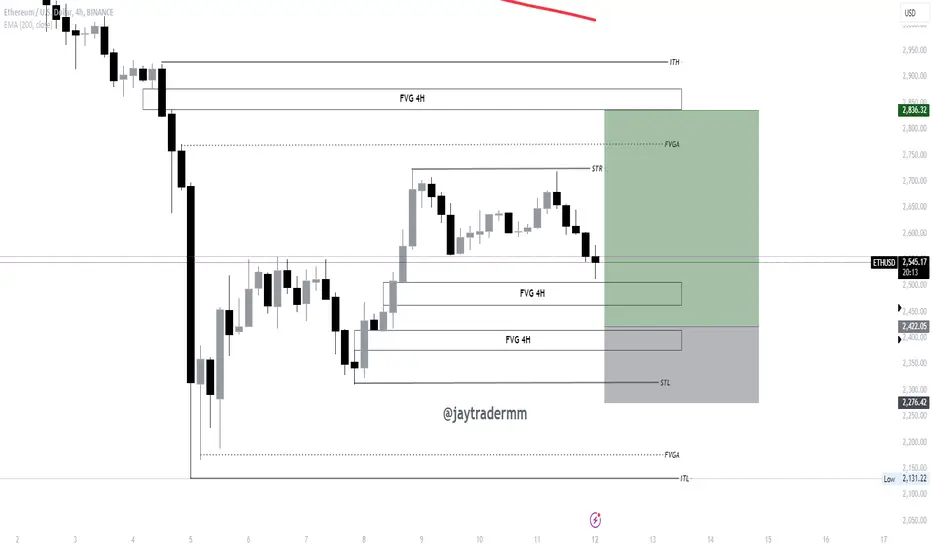
Eth longStarting a new week, I am expecting to reach the previous high. So, from the fair value area, I am looking for a long position entry in the second fair value gap 4h with the stop loss in the swing low. BINANCE:ETHUSD
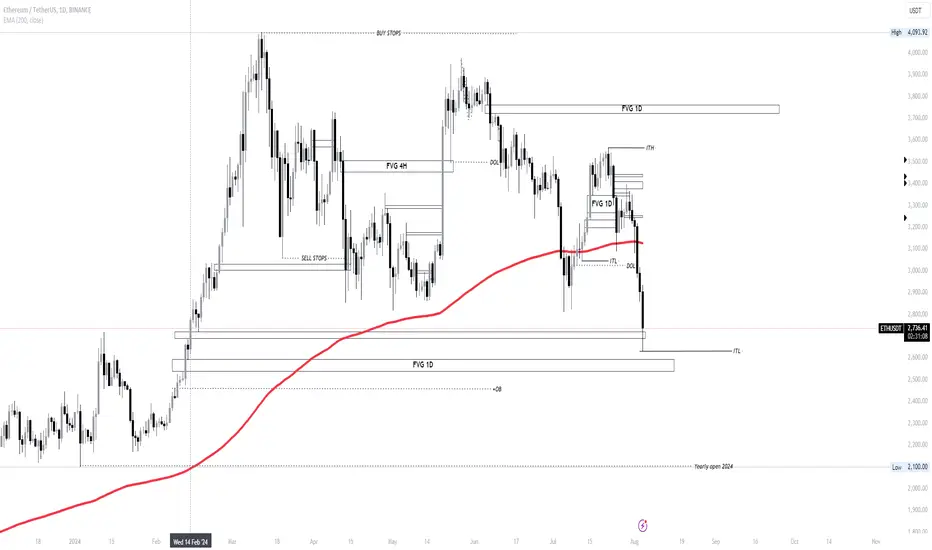
ETH, 7 months ago we were here.BINANCE:ETHUSDT
As i said, seven months ago we were here. Back to the point. The yearly open is on 2,100$ from now. It must to rebounce from here or at least to stay longer in this range to do a consolidation in highers prices.
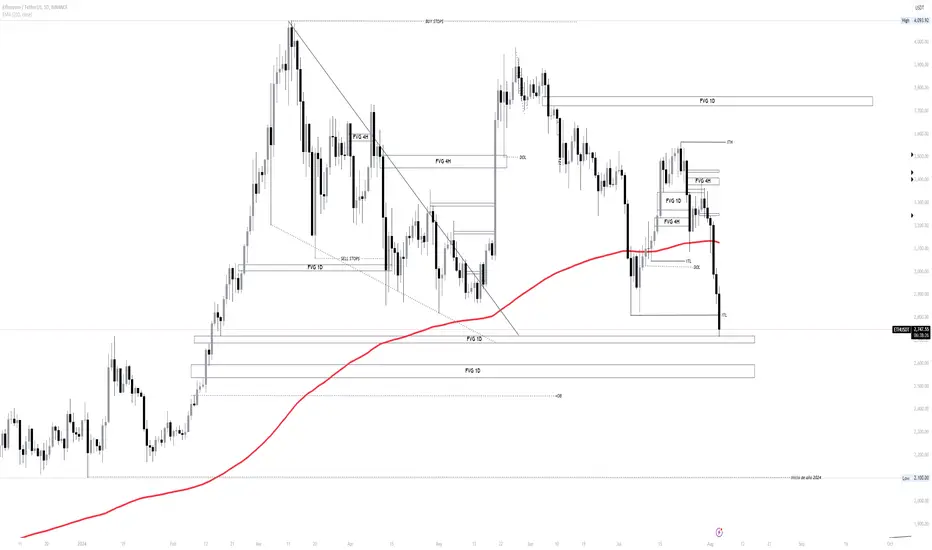
Eth, the plan I have.I am just waiting the market reaction on monday on BINANCE:ETHUSDT to see how is going to be my plan for next week. I am expected to mittigate the fair value and then, to see the market reaction going up.
Premium & Discount Price Delivery in Institutional TradingGreetings Traders!
In today's educational video, we will delve into the concepts of premium and discount price delivery. The objective is to provide you with a comprehensive understanding of institutional-level market mechanics. Before we proceed, it is crucial to define what we mean by "institutional level" and "smart money," as these terms are often misunderstood. We will also address the common misconceptions about who the liquidity providers are in the market.
By grasping these foundational concepts, you will gain a new perspective on the market, realizing that its movements are not random but calculated and precise, orchestrated by well-informed entities often referred to as smart money.
If you have any questions, please leave them in the comment section below.
Best Regards,
The_Architect

Can SNAP slo-mo bounce from an earnings fall? LONGSNAP had a mild top and bottom line beat with last week's earnings and
the price fall. Given SNAP's mediocre social media interface, I think the
earnings were decent but I suppose most traders felt otherwise looking
for more. Technically on the 1H chart, price is sitting at support at the
bottom of the fair value zone. PVT and the Gaussian Awesome Oscillator
are flat line trendlines. Reversion to the mean says SNAP will rise from
current market price. I will go long. If price can rise and get to 11.5,
the volume profile's volume void suggests it could easily cross over the
mean VWAP into the 12.5 range for another leg higher. If you want my
ideas of targets and a stop loss, please comment.

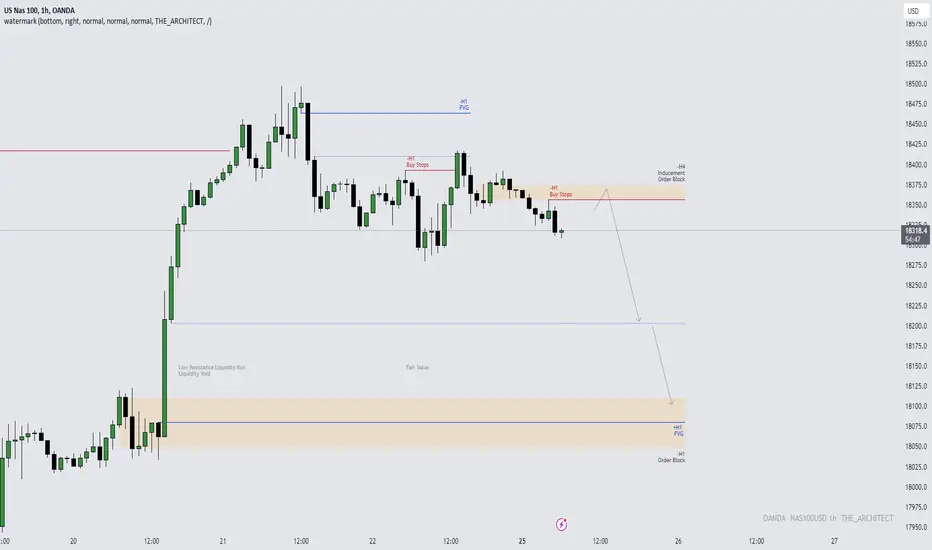
NAS100USD: Exploring Potential Sell OpportunitiesCurrently, NAS100USD shows signs of a potential sell-side draw towards the H1 Bullish Order Block . This hypothesis is reinforced by several confluences, notably the presence of inefficiencies such as Liquidity Void and Fair Value Gaps at discount prices, which typically signal opportune moments for smart money to capitalize on profits.
For confirmation of entries, we await a pullback into the H4 Bearish Order Block, which also features Buy Stop Liquidity below it, serving as our selling target.
Stay tuned for an in-depth video analysis of NAS100USD to further dissect this potential trading opportunity.
Kind Regards,
The_Architect
Mastering High Probability Trading EnvironmentsIn this educational video, we'll delve into High Probability Trading Environments and introduce a simple yet effective concept to confirm their presence . Understanding these environments will empower you to confidently navigate the market with consistency and success.
For a comprehensive understanding, I recommend watching my previous video on Understanding Trend Analysis, SMT, and ICT Concepts below.
If you have any questions, feel free to leave them in the comments section.
Happy trading!
The_Architect

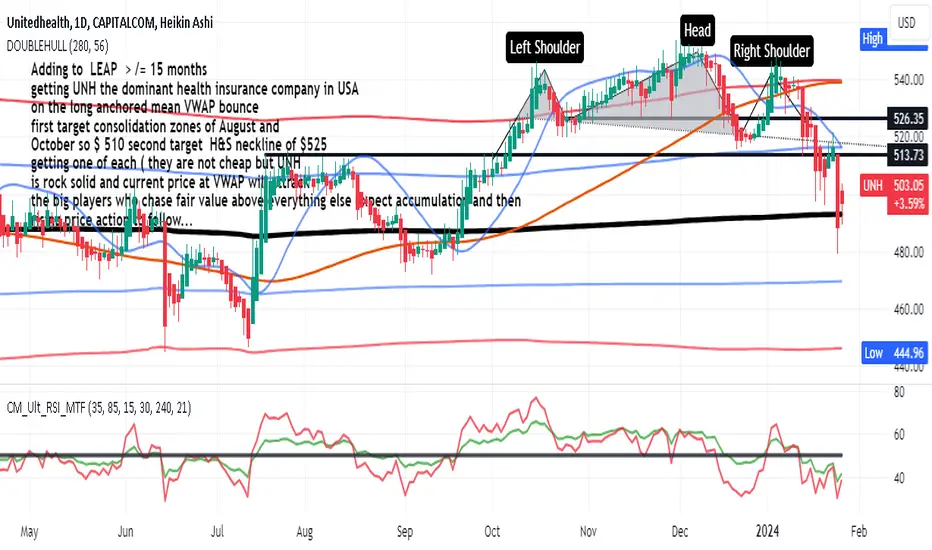
UNH, the dominate health insurance market leader LONGAs shown on the 4H chart, UNH based on a long-term VWAP band setup, it as fiar value for the
first time since September. This dip is significant as price fell from a head and shoulders pattern
of three months duration. The candles in the past couple of days show the reversal at the
mean VWAP support. I have retrieved 60% out of a near term expiration call option. Some may
say this is simply a death cross on a pair of moving averages with a bit of correction on the
overall downtrend. I understand that point of view. Notwithstanding that perspective,
healthcare is expected to be an outperforming sector in 2024. UNH is on sale. As a healthcare
provider, it has paid me large sums in the historical past. I will take trades as described
in the text box on the chart. I believe buying out of the money and at a discount will be
a good strategy for this megacap moving forward.
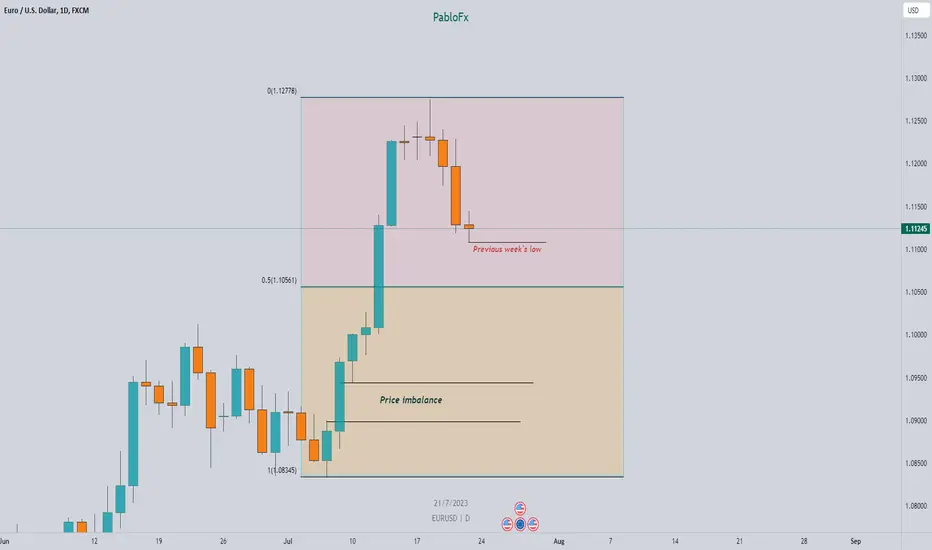
EurUsd Lower This Week!I think EurUsd will travel lower this week. My first target for Monday/Tuesday would be previous week's low. Keeping in mind FOMC is this week too on Wednesday. That will generate volatility into the market and maybe rebalance our range to 50%.
Happy trading and good luck!!!
Stock Market Logic Series #5We are going to discuss the concept of FAIR price and how it is related to momentum.
This is also a missing piece of the puzzle related to the guppy moving averages. Which never explains the logic of fair price behind the moving averages. Just saying "traders are selling" or "investors are buying" without giving you the psychology behind the buying and selling.
The psychology behind buying and selling:
When you want something, you are willing to pay a premium on it, just to get it.
When you don't want something, you are willing to give a discount on it, just to get rid of it.
The Significance of Moving Averages in Stock Market Trading
In stock market trading, moving averages play a significant role in determining the fair price of a stock. Fast moving averages represent the short-term fair price, while slow moving averages indicate the long-term fair price. These moving averages serve as important indicators for traders, helping them understand the price trends and make informed decisions.
Trading Above the Fair Price: Strong Buyer Interest
When trading is above the fair price, it signifies that buyers are highly interested in acquiring the stock, even if it means paying above the fair price. This increased buying pressure drives the price up, as individuals value the stock and are willing to pay a premium to secure it. This scenario presents an opportunity for traders to benefit from price appreciation. Go with momentum.
Buying Opportunities: Trading Below the Moving Average
Conversely, when the price of a stock falls below the moving average, it indicates a potential opportunity for investor buyers. In this situation, the previous owner of the stock may become anxious to sell and is willing to do so at a price below the fair value. This creates a favorable buying opportunity for investors, as the stock can be acquired at a discount or fair price.
Trading Below the Fair Price: Anxious Sellers and Discounted Stocks
Trading below the fair price implies that the old buyer is motivated to sell the stock quickly. They may be eager to get rid of their position, leading them to offer the stock at a price lower than its fair value. For trading purposes, this means momentum is down, and you should look for an opportunity to sell. If the price is dramatically traded below the fair price (away from MA) this could FLAG you that a trend reversal may just happens. Remember the psychology of buying and selling. Ask yourself, if someone wants it, how come this price is so cheap?
Unfair Prices in a Downtrend: Waiting for Confirmation of a Decline
Moreover, when you are in a downtrend, when the price is above the moving average, it indicates that the stock is trading at an unfair price. However, if you have insights or analysis suggesting that the price will decline in the future, it may be wise to wait for the short-term trend to shift. By observing the stock's movement and waiting for the price to fall below the yellow fair price (moving average), traders can confirm that selling is indeed happening before making their move. Getting in too early, with the wrong trading technique, will get you hurt.
Assessing Market Conditions: Understanding Fair Prices and Moving Averages
By understanding the dynamics of fair prices and their relationship with moving averages, traders can better assess market conditions. They can identify when prices deviate from their fair value and use this knowledge to their advantage. This insight allows traders to make informed decisions based on price trends, helping them maximize potential profits and minimize risks.
Comprehensive Research: Beyond Fair Prices and Moving Averages
If you could couple of other factors that support your view of FAIR price. You can consider various factors such as company fundamentals, industry trends, and market sentiment to complement your understanding of fair prices and moving averages.
Enhancing Trading Strategies: Incorporating Technical Indicators
In addition to fair prices and moving averages, traders should also consider other technical indicators and tools to enhance their trading strategies. These may include volume analysis, trend lines, support and resistance levels, and oscillators. By incorporating multiple indicators, you can gain deeper insights into market movements and improve your ability to identify profitable opportunities.
Adapting to Market Dynamics: Continuous Learning in Stock Market Trading
Understanding the concept of fair prices in relation to moving averages is just one piece of the puzzle. Successful traders continually adapt and refine their strategies based on market conditions, new information, and evolving trends. By staying informed, conducting a thorough analysis, and employing sound trading principles, you can increase your chances of success in the stock market.
Hope this helps you, follow for more. Like this post to save it to your ideas for future reference, so you will not forget this principle.

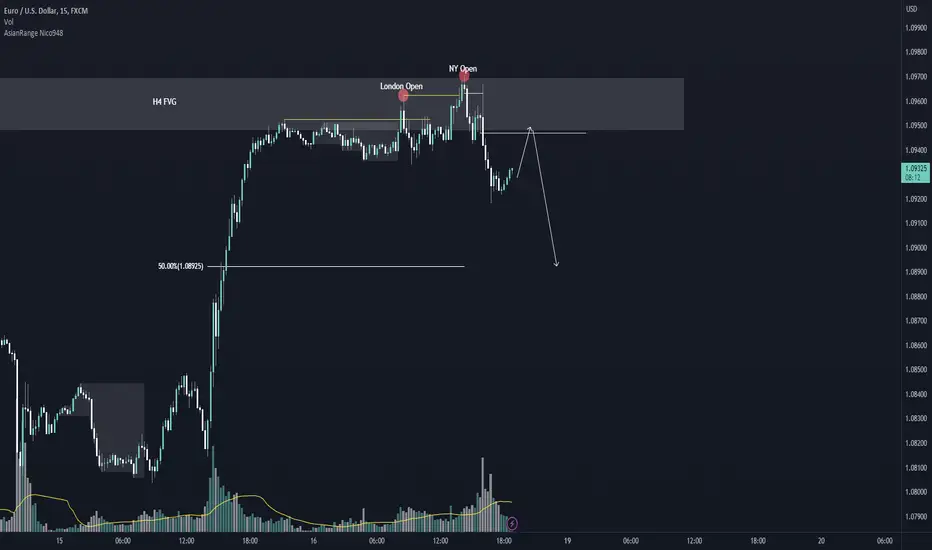
EUR/USD - Back to fair valueEUR/USD analysis for next week. Price currently reacted on the H4 fair value gap after a long bullsih push. We took out liquidity first on London open and then on NY open causing a market structure shift on the m15 timeframe. You can look for a potential setup to go short once price retraces and potentially fill the FVG + Imbalance on this m15 swing that caused the break. Wait for rejection on the zone for a potential short targeting fair value (50% of the swing).
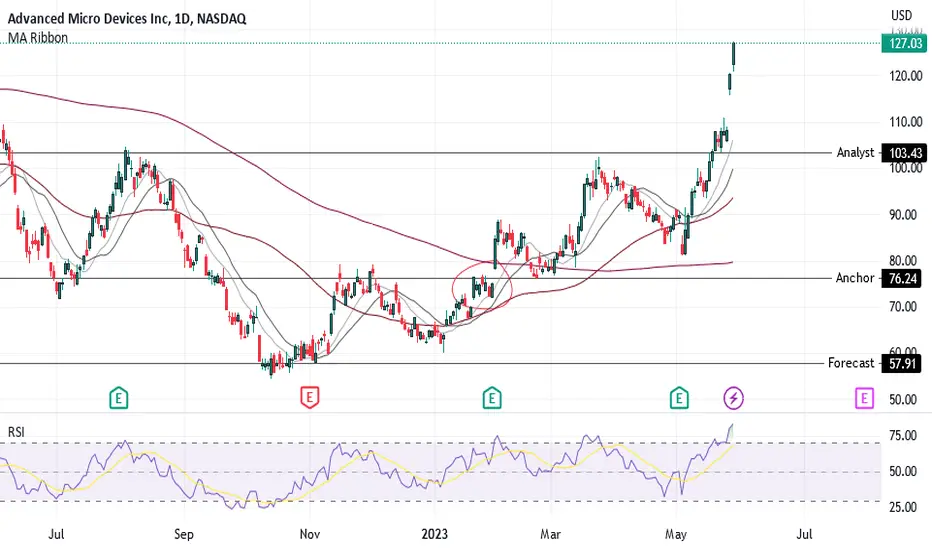
Valuation Chart for AMD, Average Analyst Targets and ForecastsFor those that believe that some how AMD will magically stay at these levels, please keep in mind, the average analyst target is $103.43. On top of that, I believe the company is Anchored at lower prices based on projected earnings growth and cost of equity. This stock will revisit lower levels once again.
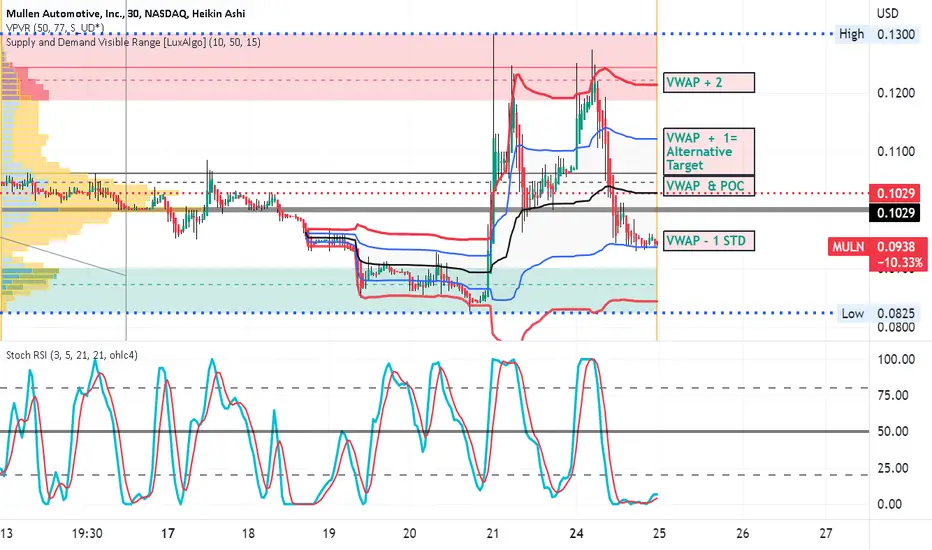
MILN Electric Vehicle Penny Stock MULN is a nine-penny stock that is high volatile with a wide ATR.
On the 15-minute chart, price is currently sitting above the support zone
shown by the Luxalgo indicator. Upside to the resistance zone is
nearly 40% which this stock can do in 1-2 days. Just in the past two days
MULN formed a double top at 12 cents near to the VQAP + 2 then tended down.
After the downtrend price currently in the undervalued range one standard
deviation below VWAP which MULN is using for support.
The RSI confirms price as in the low oversold zone while the high relative
volume in the past couple of days affirms trader interest. Once a reversal
is steadily underway I suspect a volume surge will drive price higher
and do so quickly.
I see this as a great opportunity to take swing long trade looking for
at least 1/2 of the upside 40%. The stop loss will be set just below the support zone.
If price moves there the trade is invalidated. If not the target is 12 cents at the
level of the double top or alternatively a more conservative target of one standard
above VWAP ( blue line) at about 11.4 cents. Lastly, there is the alternative of
inexpensive options which if taken strategically can significantly leverage
the returns of a stock trade.
Btc signal crypto bulishhello traders bitcoin is in a nice bullish uptrend we have still objective on a weekly timeframe to rich into the fair valuation area we trade what we see follow the trend comment down below also follow and contact me if you want to learn more let make money

expect a weak dollarAfter fair vaule gap was filled and the bullish orderblock was tapped dollar will tumble into lower targets.
Keep an eye on it!

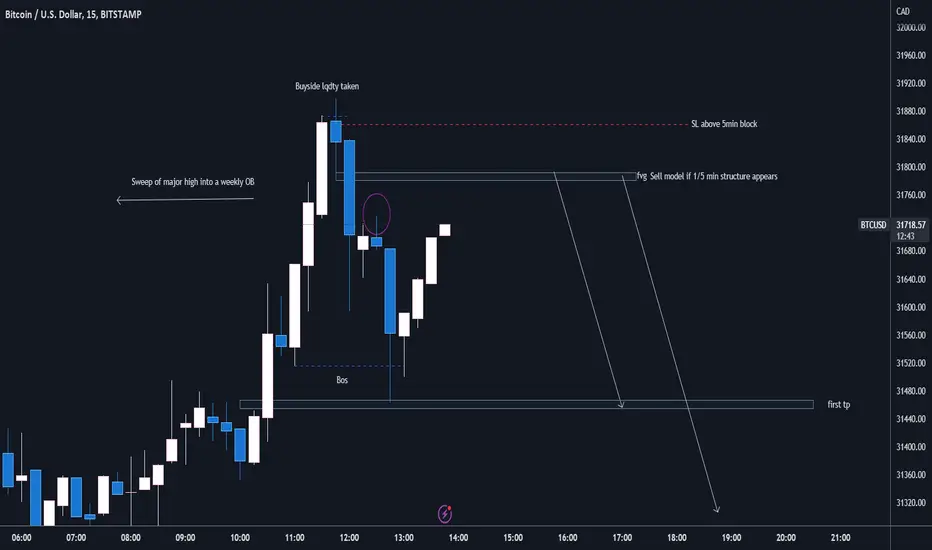
BTC weekly order block shortPrevious major high swept , still playing within previous weekly order block, il be taking two positions as I think this is a swing to the downside before the bull run continues.
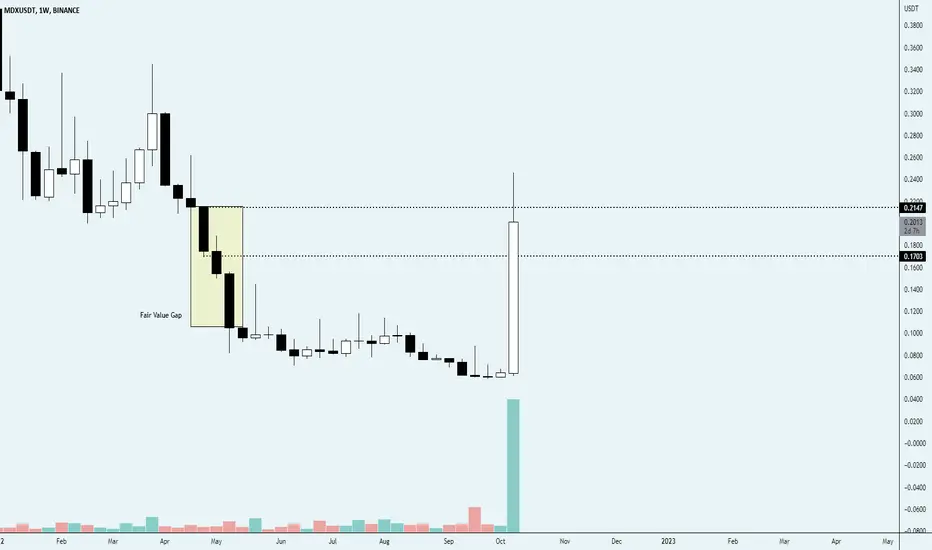
MDX - Fair Value Gap TakenI covered this in my recent YT video that we had a fair value gap in the yellow box area.
Price (especially short squeezes) tend to fill this gaps sooner or later.
I had also marked out those key levels to look out for as targets (dotted lines).
Mdex smashed both of them with hast, filling the FVG now.
Is this the start to a real trend? (I wouldn't be longing here).
Why PayPal ( $PYPL) is one of my TOP long call "position trades"Why I like PayPal PYPL
Back to 2017 levels, pretty much "recession proof" (give or take). It's almost God sent being down at these levels (undervalued/fair value). There are some strikes that are def. set up for nicely profitable positions if chosen correctly, common shares as well. Though I hid a lot of my indicators for a simple view, there is def. a divergence between price and RSI on both the Daily & Weekly, as well as the Monthly looking pretty bottomed out. I am pretty big into Harmonic patterns , but am not going to share my "secret sauce", at this current time.
I will continue to add to my position and average down (as planned) into further out strike dates. I as well will MOST LIKELY play the short term trends as well, but my overall goal is to see at least $115.00 with my "position trade" call contracts.
I typically leaves these "ideas" pretty brief on Trading View as I don't really have a BIG following on here
If you have any questions about my "idea" feel free to reach out!
(This is a repost as I had some community violations I was unaware about)

$BTC to reverse between 24,100 and 19,800I'be been waiting for this moment to hapen for months. 24,100 was the mark I have Bitcoin reversing and it's finally here. This number is the midpoint between the monthly fait value gap, fills a weekly fair value gap, and is just below a liquidity point and is a daily bullish order block all of those things combined is a sure tell sign of a reversal
see chart for previous reference points, Next stop is 40k
