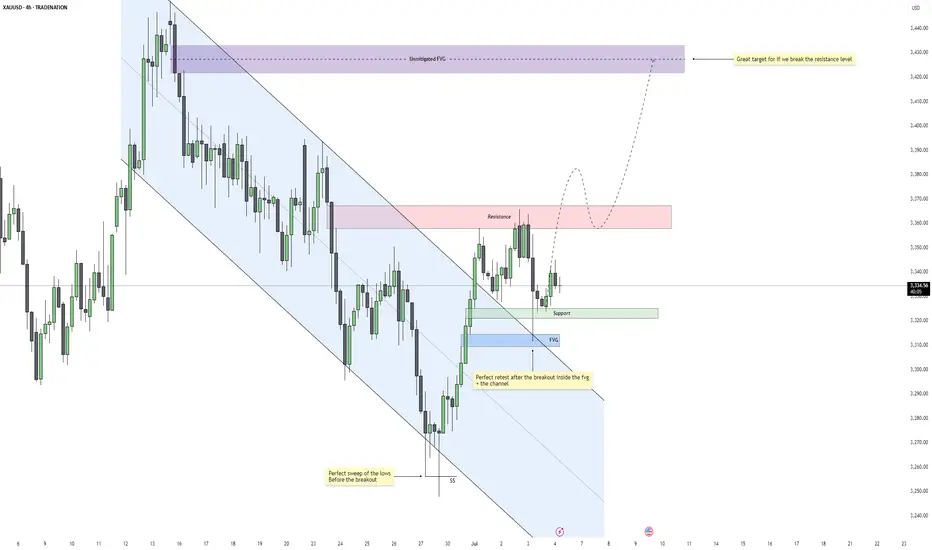
Gold – Is $3430 the Next Target After This Breakout?Gold recently completed a clean sweep of the 4H swing lows, taking out downside liquidity just before breaking out of a well-defined descending channel. This move marked a shift in momentum and structure, suggesting that the bearish leg may have concluded and the market is now transitioning into a more bullish phase.
Breakout Confirmation and Retest Zone
Following the breakout, price retraced and tapped directly into a confluence area where a fair value gap aligns with the upper boundary of the broken channel. This acted as a high-probability retest zone, and the reaction was strong. The market respected this structure perfectly, adding conviction to the breakout's validity.
Support and Resistance Dynamics
Currently, price is hovering between a nearby support level and a short-term resistance zone above. The support is holding firm after the retest, while the resistance is capping upward momentum for now. This is a healthy consolidation following the breakout, and it provides a clear structure for monitoring continuation.
Imbalance Target and Flow Outlook
Should the market gain enough strength to break through the overhead resistance, there is a large unmitigated imbalance further above that stands as a strong magnet. It represents a clean fair value gap left behind during the previous selloff and could be the next major draw if bullish momentum continues.
Overall Flow and Trade Logic
The sequence is very clean: sweep of liquidity, bullish breakout, efficient retest, and now consolidation above support. As long as price continues to form higher lows and respect the current structure, the probability of further upside remains favorable. Patience around the resistance area will be key for confirmation.
Conclusion
Gold is displaying a textbook reversal setup driven by liquidity and structure. If the current support continues to hold and buyers reclaim control above resistance, the path toward the upper imbalance becomes highly probable. The market is aligned for continuation, with bullish momentum building gradually.
Disclosure: I am part of Trade Nation's Influencer program and receive a monthly fee for using their TradingView charts in my analysis.
___________________________________
Thanks for your support!
If you found this idea helpful or learned something new, drop a like 👍 and leave a comment, I’d love to hear your thoughts! 🚀
Fairvaluegap
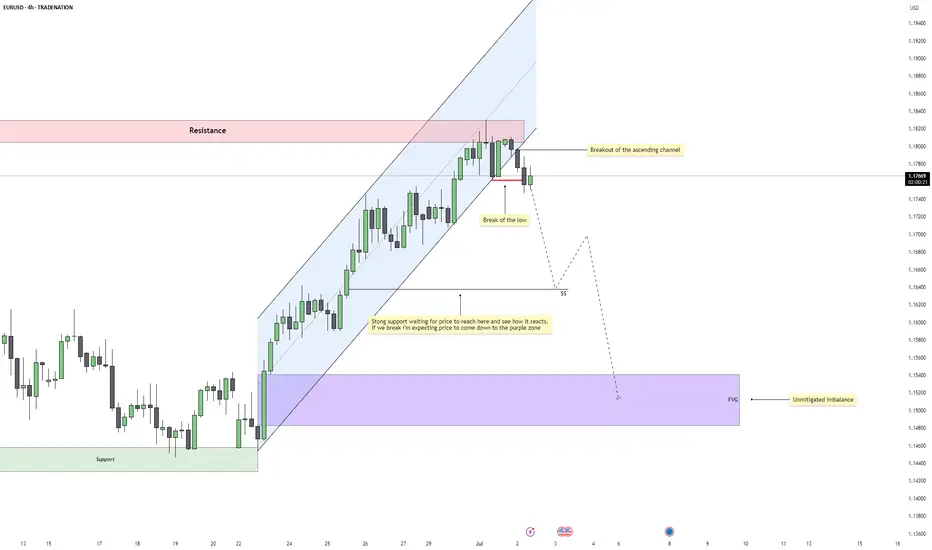
EURUSD – Bearish Reversal Confirmed After Structural BreakEURUSD has shifted out of its bullish environment after a sustained rally inside a clean ascending channel. Price recently rejected a resistance zone that capped previous buying pressure and has now started to rotate downward. This marks the first serious challenge to the trend and sets the tone for a potential bearish phase.
Channel Breakdown and Price Behavior
The ascending channel had been respected for several sessions, guiding price upward with consistent higher highs and higher lows. The recent breakdown from this structure is significant, as it shows the market is no longer willing to support higher prices within that controlled environment. This type of breakout often signals a loss of momentum and increased volatility in the opposite direction.
Break of the Low and Shift in Structure
After breaking the channel, price also took out a major internal low, which had previously held during retracements. This is a key signal of a structural shift, confirming that the uptrend has been interrupted. When price breaks a low that buyers had been defending, it shows sellers have stepped in with conviction and are likely aiming lower targets.
Short-Term Target and Reaction Zone
The first area of interest sits just below current price where a support shelf and price inefficiencies line up. This zone, marked with the dollar sign symbol on the chart, may attract a short-term reaction. If buyers are still present, this is where they would likely try to step in. However, the rejection from resistance and the structural break suggest this level could eventually give way.
Imbalance Zone Below and Liquidity Target
If that support fails, the next high-probability draw is the large untested imbalance sitting further below. This zone has remained untouched since the rally began and represents unfinished business for the market. Price often seeks out these inefficiencies, especially after trend shifts, making it a natural target for sellers if momentum continues.
Conclusion
EURUSD is showing clear signs of bearish pressure after rejecting resistance, breaking structure, and leaving behind unmitigated downside targets. As long as we remain below the broken low, the path of least resistance points lower. The imbalance zone below remains the key destination unless the market shows signs of reversal higher.
Disclosure: I am part of Trade Nation's Influencer program and receive a monthly fee for using their TradingView charts in my analysis.
___________________________________
Thanks for your support!
If you found this idea helpful or learned something new, drop a like 👍 and leave a comment, I’d love to hear your thoughts! 🚀
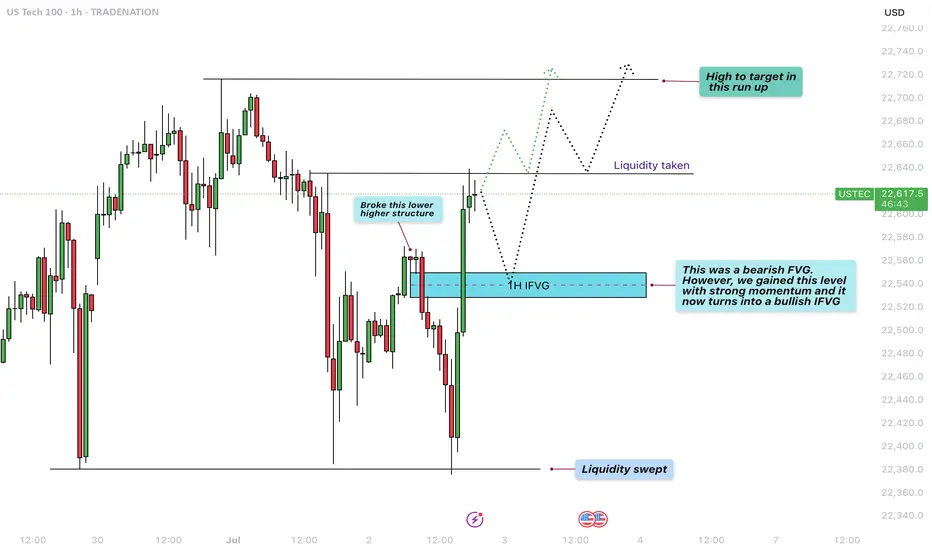
US100 - Reversal after liquidity sweep to target new highs?The chart presented shows a 1-hour analysis of the US100 (Nasdaq 100), illustrating a clean and structured price action narrative. Initially, we observe that the market swept liquidity at the lows, indicated by a sharp wick that pierced beneath the previous support levels. This type of liquidity sweep is common when smart money looks to grab stop-loss orders before reversing the trend.
Liquidity sweep to the downside
Following this liquidity sweep, price action aggressively moved upwards, breaking a lower high structure that had previously marked the bearish control of the market. This break of structure is a key bullish signal, suggesting a shift in momentum from bearish to bullish, and often signifies the beginning of a new upward leg.
1H FVG
An important element on this chart is the 1-hour Fair Value Gap (FVG), initially acting as a bearish imbalance. However, due to the strong bullish momentum, price not only reclaimed this level but did so decisively. As a result, this bearish FVG is now considered a bullish FVG, indicating that it may serve as a support zone on any short-term pullback.
Liquidity taken from the upside
After reclaiming the FVG and breaking structure, price surged further, taking out upside liquidity just above recent highs. This action typically leads to a short-term pullback, as profit-taking and new supply enter the market. The chart suggests that any retracement may find support at the 1H FVG, providing a potential entry point for bullish continuation.
Conclusion
In conclusion, the US100 demonstrated a textbook liquidity grab at the lows, followed by a break in bearish structure, a shift in momentum, and an inversion of a key FVG zone from bearish to bullish. The short-term upside liquidity has been cleared, and the next logical target is the high marked on the chart. Should the price respect the newly formed bullish FVG on any pullback, we can expect continuation toward that upper high, completing the bullish run.
Disclosure: I am part of Trade Nation's Influencer program and receive a monthly fee for using their TradingView charts in my analysis.
Thanks for your support.
- Make sure to follow me so you don't miss out on the next analysis!
- Drop a like and leave a comment!
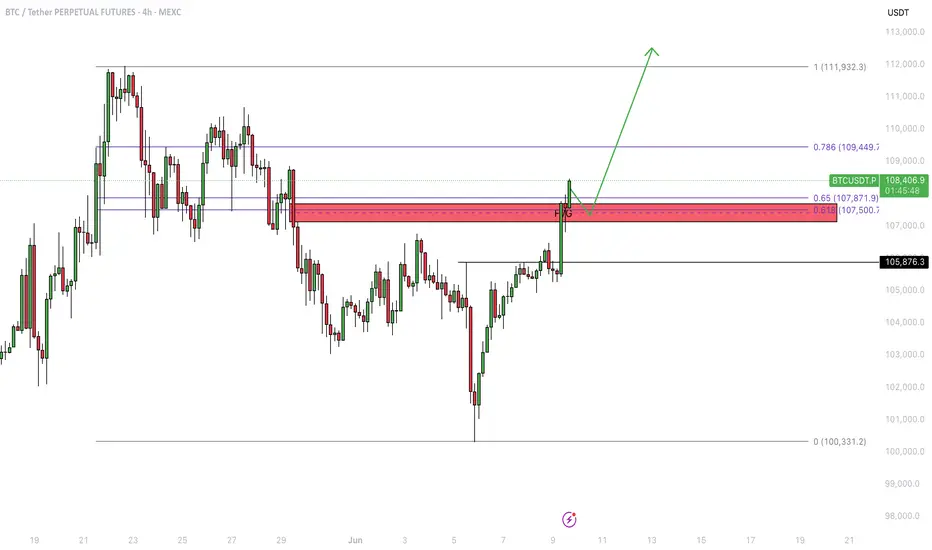
Bitcoin - Price struggles below resistance, correction to $104k?This 4-hour chart for BTC/USD illustrates a detailed technical analysis scenario highlighting key resistance and support zones, as well as a critical fair value gap (FVG). The chart shows that Bitcoin is currently facing strong resistance in the $108,000 to $109,000 range. This area has been tested multiple times without a successful breakout, indicating significant selling pressure. The price is currently trading just below this resistance zone, struggling to gain momentum above it.
Support zone in the consolidation
A clear support level has been marked in the recent consolidation area around $106,000. This zone has served as a short-term base during the recent upward movement, and a retest here could provide a temporary bounce or pause in bearish momentum. However, if this support fails to hold, the next major area of interest lies within the 4-hour bullish FVG between approximately $103,000 and $104,000.
4H FVG
There is a clear 4-hour bullish FVG between approximately $103.000 and $104.000. This level can act as a strong support for buyers after filling up the inbalance zone. it is highly important to hold this level as support and not to break below it.
Upside potential
On the upside, if BTC can defend the support in the consolidation zone and reclaim momentum, a push back to the $108,000 to $109,000 resistance area is probable. A successful breakout above this zone would invalidate the bearish scenario and may trigger a bullish continuation, with the potential to reach higher targets such as $111,000 or beyond.
Downside risk
The downside risk becomes more pronounced if BTC breaks below the 4H FVG. A sustained move beneath this level would likely signal weakness in buyer interest and potentially open the path to deeper downside targets. In such a scenario, the price could accelerate lower toward the psychological support level at $100,000. This round number also carries technical and emotional significance for traders, which could create both a strong support area and potential buying interest.
Conclusion
In conclusion, Bitcoin remains at a critical juncture. The key levels to watch are the support within the current consolidation and the 4H FVG imbalance zone. A breakdown below the FVG could lead to a decline toward $100,000, while holding above these levels keeps the door open for another test of resistance at $108,000 to $109,000. A breakout from there would indicate bullish strength and a shift in market sentiment. Traders should remain cautious and reactive to how price behaves around these critical areas.
Disclosure: I am part of Trade Nation's Influencer program and receive a monthly fee for using their TradingView charts in my analysis.
Thanks for your support.
- Make sure to follow me so you don't miss out on the next analysis!
- Drop a like and leave a comment!

Bitcoin - Rejection From Major Resistance, Eyes on 103.8K SupporBitcoin is once again reacting to a major resistance zone around 108.8K, a level that has consistently rejected price in the past. The market attempted a breakout but failed to sustain momentum, forming multiple wicks and signs of weakness near the highs. This repeated rejection suggests that sellers are still in control up here and that this zone remains a strong ceiling for price.
Immediate Downside Scenario
With bearish pressure building at resistance, price is now pulling back and eyeing the first key support level around 103.8K. This zone previously acted as a significant base, with an imbalance overlap and structural demand from past price action. If price taps into this zone and buyers defend it, we could see a recovery bounce and potentially another retest of the upper resistance.
Breakdown Risk and Bearish Expansion
However, if 103.8K fails to hold, this opens the door for a deeper correction. The next logical downside target would be in the 98K region, where a higher timeframe imbalance sits and where price last found strong demand during the last major push up. This would also align with a full sweep of recent liquidity build-ups below.
Bullish Recovery Path
In the bullish case, holding 103.8K could initiate a rebound back toward the 108.8K resistance. This would likely depend on a solid reaction and displacement from the support zone, potentially forming a new higher low structure. For bulls to regain full control, we would need to see a clean breakout above the resistance zone with continuation.
Key Zones to Watch
The red resistance zone near 108.8K remains the clear invalidation for further upside, while the grey support block around 103.8K is the first major level that could decide the short-term trend. If that breaks, the purple demand zone near 98K is a high-probability area for price to find support again.
Conclusion
Bitcoin is still stuck between a strong resistance ceiling and a critical mid-range support zone. The rejection from the top signals that we may see downside in the near term, but whether this turns into a full reversal or just a retracement depends entirely on how price reacts around 103.8K. Hold it and we bounce, break it and we likely drop toward 98K. Keep watching how price behaves at these levels to gauge momentum and direction.
___________________________________
Thanks for your support!
If you found this idea helpful or learned something new, drop a like 👍 and leave a comment, I’d love to hear your thoughts! 🚀

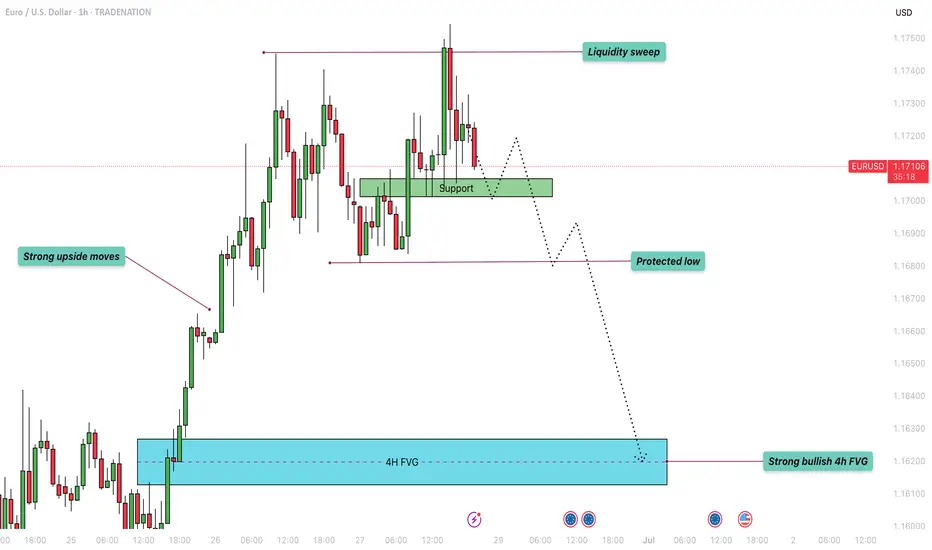
EUR/USD - Liquidity grabbed! Move towards the 4H FVG next?This chart illustrates a short-term bearish outlook on the EUR/USD currency pair, using smart money concepts like liquidity grabs, fair value gaps (FVGs), and structural levels such as support and protected lows. It is based on the 1-hour timeframe and references a higher timeframe (4H) for added confluence.
Liquidity Sweep
At the top of the recent price movement, a "Liquidity sweep" is marked, suggesting that the market pushed above recent highs to trigger stop-losses of short positions or entice breakout traders before reversing. This kind of move is common in smart money concepts and typically precedes a directional shift, which in this case, is anticipated to be downward. This sweep likely removed buy-side liquidity and indicates that institutional traders may now seek to target sell-side liquidity below recent lows.
Support Zone
The green shaded area labeled "Support" represents a previous consolidation or demand zone that temporarily held price after the liquidity sweep. This zone is seen as a short-term reaction point where price may consolidate or bounce slightly before continuing lower. However, the dashed black line projection suggests that this support is not expected to hold long-term, as price is forecasted to break below it.
Protected Low
A previous low is labeled "Protected low," implying that it hasn’t been violated during recent downward moves. This term often refers to a structural level that, if broken, confirms a shift in market structure. In this context, the projection anticipates that price will break below this protected low, indicating a bearish intent and unlocking further downside movement.
4H Fair Value Gap (FVG)
The large blue zone labeled "4H FVG" marks an imbalance or inefficiency on the 4-hour chart. This zone is referred to as a "Strong bullish 4h FVG," suggesting that once the sell-side liquidity is taken and the lower targets are met, this area is expected to act as a high-probability demand zone. Institutional traders often look for price to fill these FVGs before reversing, as they represent unmitigated institutional orders. The projected path implies that this is the ultimate downside target where price may react bullishly.
Conclusion
Overall, this analysis outlines a bearish short-term scenario for EUR/USD. After sweeping liquidity above recent highs, price is expected to respect the bearish order flow, break through the current support level, and move below the protected low. The ultimate downside target lies within the strong 4H FVG, where a significant bullish reaction might occur. This suggests a classic smart money play, manipulate (sweep liquidity), shift (break structure), and mitigate (return to FVG)—offering a well-structured trade idea for both intraday and swing traders.
Disclosure: I am part of Trade Nation's Influencer program and receive a monthly fee for using their TradingView charts in my analysis.
Thanks for your support.
- Make sure to follow me so you don't miss out on the next analysis!
- Drop a like and leave a comment!
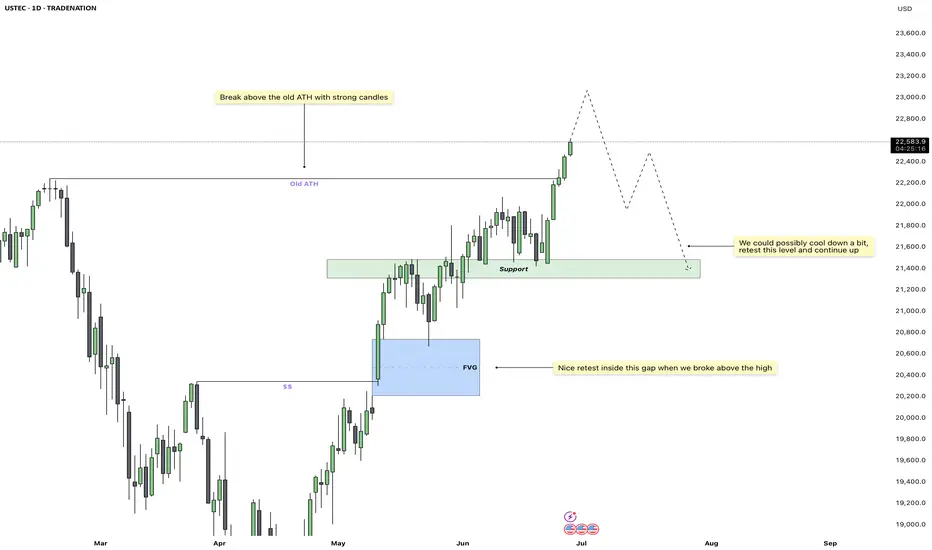
US100 – Extended Rally, Eyes on Pullback to Key SupportUS100 continues to show impressive strength, with no real signs of slowing down yet. The recent push above the previous all-time high came with strong bullish candles and high volume, confirming the breakout as legitimate rather than a false pump. This surge followed a clean retest of the fair value gap below, which acted as a springboard for the next leg higher.
Imbalance Retest and ATH Break
Before the breakout, price perfectly respected the FVG just above the 20,800 zone. That retest was crucial, showing institutional interest in defending higher prices. From there, the index cleared the old ATH with authority, and we are now trading comfortably above it, establishing new highs in the process.
Support Zone Outlook
While momentum remains bullish, the market doesn’t move in a straight line forever. A short-term cool-off is possible. I’m eyeing the marked-out support zone just above 21,400, which previously acted as resistance and now flips to demand. If we do pull back, this is the most logical area for buyers to step back in.
Potential Price Path
The dotted projection outlines two possible paths: one, a minor pullback followed by immediate continuation, and two, a deeper retest into the green support zone before resuming the uptrend. Both scenarios remain bullish as long as price stays above that support. A retest into this level would be healthy and provide a clean long entry for continuation.
Key Levels to Watch
The area around 21,400 to 21,700 is critical. If we revisit this zone, I’ll be watching for bullish price action to confirm continuation. On the upside, we’re now in price discovery mode, so upside targets are more open-ended, but 23,000+ becomes a magnet if momentum stays intact.
Conclusion
US100 is in strong bullish territory, with institutional signs backing the move. A pullback would be welcome and likely provide a high-probability long setup. Until the structure breaks, I remain bullish on this index, watching for a healthy dip into the support zone for potential continuation higher.
Disclosure: I am part of Trade Nation's Influencer program and receive a monthly fee for using their TradingView charts in my analysis.
___________________________________
Thanks for your support!
If you found this idea helpful or learned something new, drop a like 👍 and leave a comment, I’d love to hear your thoughts! 🚀
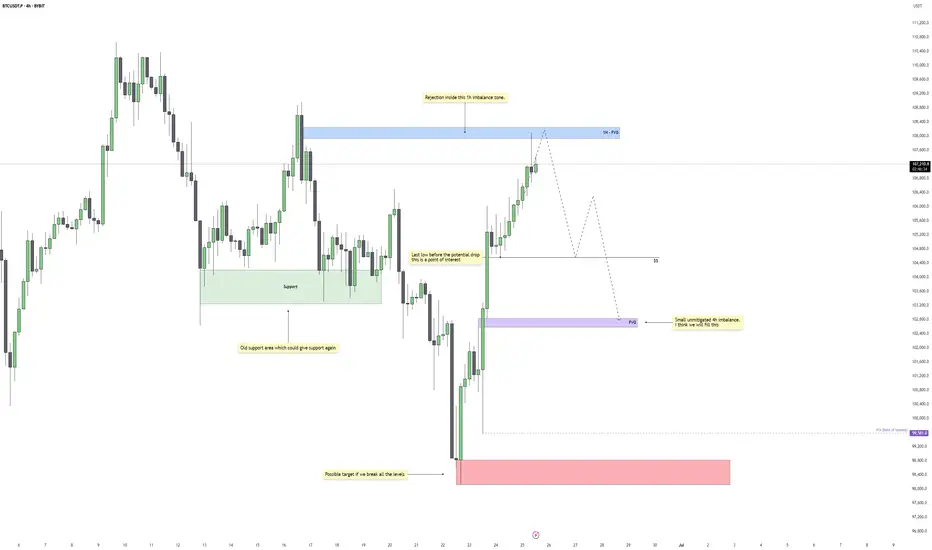
Bitcoin - Bears Take Control, Reversal Coming?After an aggressive bullish rally, Bitcoin has filled a clean 1H imbalance zone near 108K and swept short-term liquidity above recent 1H highs. The move into premium pricing saw clear signs of rejection, with a strong bearish reaction directly inside the imbalance area. This reaction confirms the area as a valid supply zone and signals that bulls may have exhausted their momentum in the short term.
Liquidity Sweep and Rejection
The sweep of prior highs was sharp and quick, lacking follow-through, and was immediately followed by rejection wicks and a drop in momentum. This kind of price action typically hints at engineered liquidity grabs, where smart money drives price into inefficiencies to fill orders before reversing direction. That liquidity sweep, paired with the fill of the 1H FVG, increases the probability that this high is now set in place for a short-term reversal.
Key Short-Term Level to Watch
The immediate level of interest lies at the most recent low before the rally, marked clearly as a potential short-term support. This low often acts as a magnet post-sweep, as price retraces to test if there’s real buyer interest left or not. If this low fails to hold, the bearish momentum could accelerate into the nearby 4H Fair Value Gap around the 102.5K–101.9K area.
Fair Value Gap and Lower Target
That 4H FVG has not yet been filled, and there’s also a small unmitigated imbalance sitting just above it. If price drops into this zone and still fails to show strong buyer interest, the path opens toward a more significant downside move. The final downside target sits near 98K, highlighted by a higher timeframe demand area and major structure level. This zone would only come into play if all intermediate support levels break cleanly.
Bearish Roadmap
Short-term, I expect a retest of the recent low, followed by a possible reaction. But if that reaction fails and momentum stays bearish, the 4H FVG fill becomes highly likely. A break below that would shift control decisively to sellers, with 98K as the next major liquidity pocket to target. This move would also clean out most of the inefficiencies left behind by the recent aggressive bullish move.
Conclusion
The rejection from the 1H imbalance and liquidity sweep suggest Bitcoin’s recent rally may be done for now. Until we reclaim the 1H FVG and break above recent highs with strength, the bias is bearish. If the key low breaks, I’ll be watching how price reacts inside the FVG zone. A weak reaction could open up the flush toward the 98K level for a larger liquidity draw.
___________________________________
Thanks for your support!
If you found this idea helpful or learned something new, drop a like 👍 and leave a comment, I’d love to hear your thoughts! 🚀
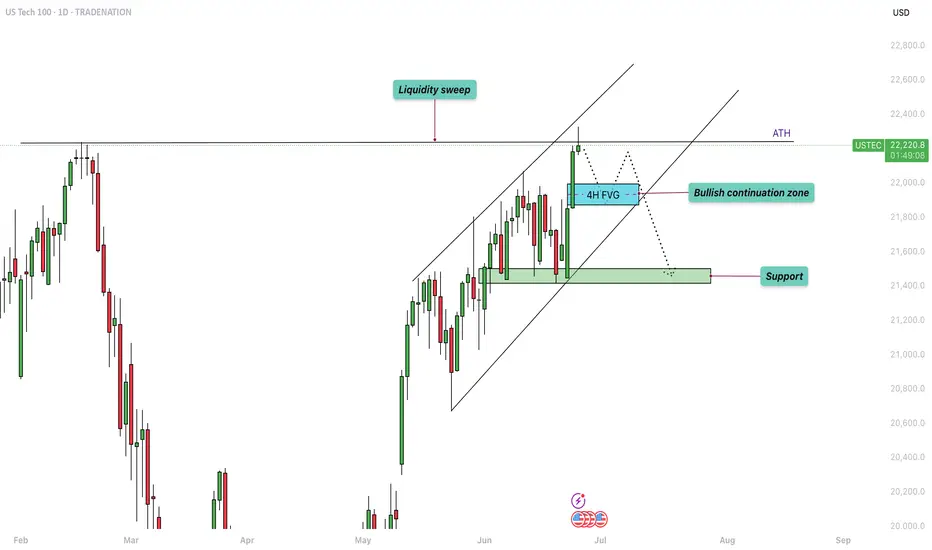
US100 - Liquidity sweep above the ATHIntroduction
The US100 has been exhibiting a strong upward trend on the daily timeframe ever since the sharp correction in early April. This sustained bullish momentum culminated in a break above the previous all-time high (ATH) earlier today. However, this breakout may not be entirely convincing just yet, as there are signs of a potential short-term reversal. The move above the ATH could represent a liquidity sweep, where price action briefly pushes past a key level before retracing, possibly trapping late buyers.
Liquidity Sweep
On the daily chart, the US100 did succeed in breaching the previous ATH, but the breakout appears to have been short-lived. Price quickly reversed after the new high was printed, leaving behind only a wick above the ATH. This type of price action forms what is commonly referred to as a swing failure pattern, a scenario where the market tests liquidity above a key level before turning back down. Such a pattern often signals upcoming weakness, especially when the breakout lacks strong follow-through or volume support.
4H Fair Value Gap (FVG)
During the most recent leg up, the US100 left behind an unfilled fair value gap (FVG) on the 4-hour timeframe. This imbalance zone, created when price moves too quickly in one direction without enough time for buyers and sellers to match orders evenly, often acts as a magnet for price to return to. In the context of the current market structure, this 4H FVG could provide a meaningful support level if the index does experience a pullback. Should the index find support here and show signs of renewed buying interest, the broader uptrend is likely to continue. However, if this zone fails to hold, we may see a deeper retracement toward lower support levels.
Conclusion
While the US100 remains in a strong and well-defined uptrend on the higher timeframes, the recent price action above the ATH introduces the possibility of a short-term pullback. The appearance of a swing failure pattern and the presence of an untested 4H FVG suggest that some corrective movement could unfold in the near term. That said, the FVG presents a key area to watch for bullish continuation. If buyers step in at this imbalance zone, the index could resume its upward trajectory, reaffirming the strength of the current trend.
Disclosure: I am part of Trade Nation's Influencer program and receive a monthly fee for using their TradingView charts in my analysis.
Thanks for your support.
- Make sure to follow me so you don't miss out on the next analysis!
- Drop a like and leave a comment!
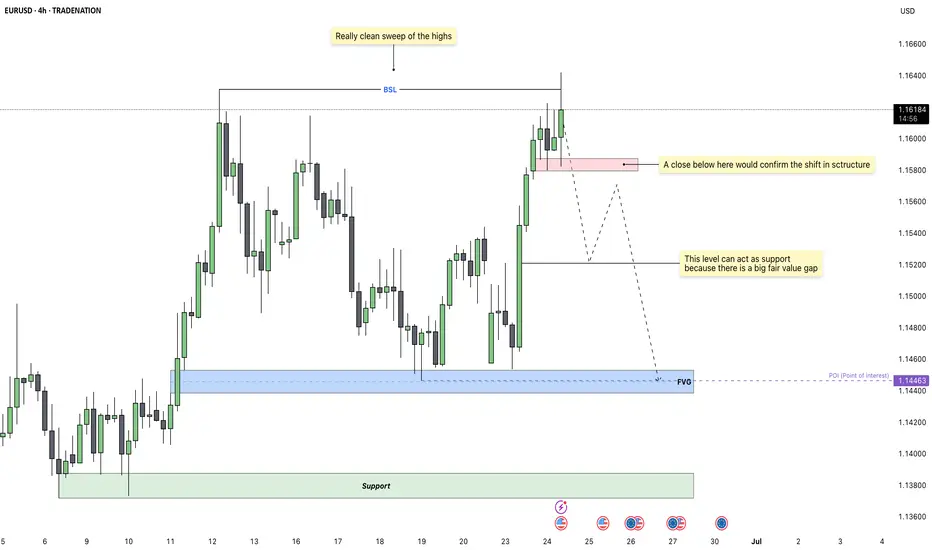
EURUSD - Bears Preparing a Bearish Shift in StructureEURUSD has been pushing higher over the past few sessions, reaching into a key liquidity zone. On the 4H chart, we’ve now seen a very clean sweep of previous swing highs, which completes the first step needed for a potential reversal. This sweep acted as a buy-side liquidity run, taking out resting orders before showing early signs of exhaustion.
Liquidity Sweep and Structural Confirmation
The sweep of the highs marked a potential turning point, but for this setup to gain validity, we need to see confirmation through structure. That confirmation would come from a decisive 4H close below the red mitigation zone. This area aligns with a small demand that previously pushed price up, so a close below would mark a clean break in bullish order flow and confirm a bearish structure shift.
Downside Expectations and Key Levels
If the structure shift is confirmed, I expect EURUSD to move lower toward the fair value gap around 1.14600 to 1.14400. This FVG could provide temporary support, and we may see some reaction there. However, due to the size of the imbalance and the overall context, price has the potential to continue lower through that level.
Interim Reactions and Minor Scenarios
There is a chance price reacts to the FVG and pulls back before continuing lower. Any bounce from this zone would likely be short-term unless it leads to a clear market structure shift back to the upside. If price fails to hold above the FVG, the deeper support zone below near 1.13800 would become the next logical target.
Trigger Point for Bearish Bias
The most important trigger for this trade is a 4H close below the red box. Without that, the bullish structure technically remains intact. Once that level is broken, I will consider the sweep and break combination a completed reversal signal, targeting the FVG and beyond.
Conclusion
This setup follows a textbook liquidity grab followed by a potential structure break. Patience is key here, as I’m waiting for confirmation before taking action. If price closes below the red zone, I’ll be actively looking for shorts targeting the 1.14600 region, with room to extend lower depending on how price reacts at the FVG.
Disclosure: I am part of Trade Nation's Influencer program and receive a monthly fee for using their TradingView charts in my analysis.
___________________________________
Thanks for your support!
If you found this idea helpful or learned something new, drop a like 👍 and leave a comment, I’d love to hear your thoughts! 🚀
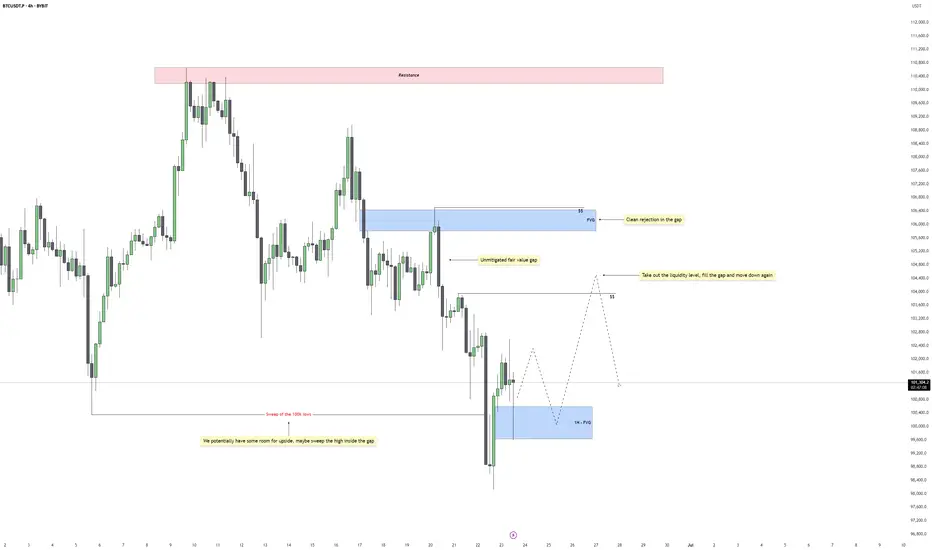
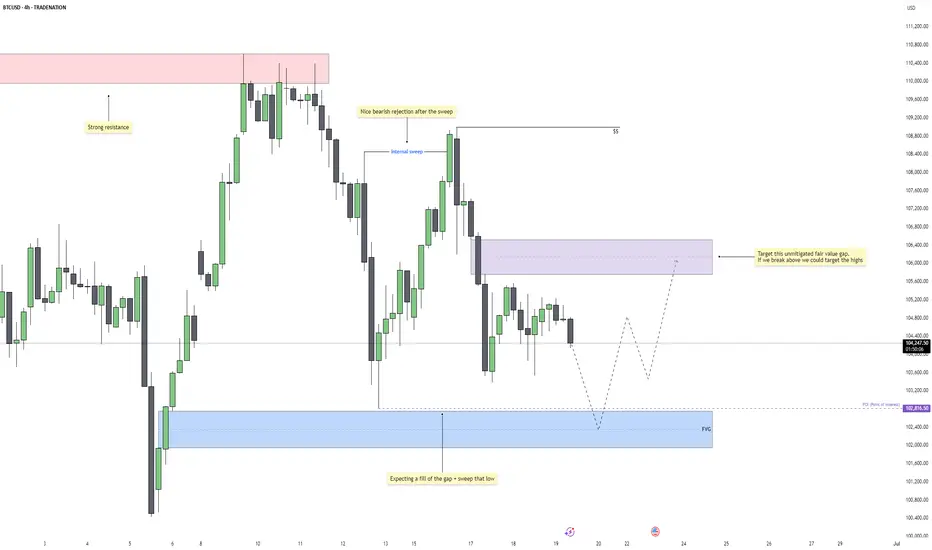
Bitcoin - Bounce Incoming or Breakdown to 97.5k?Market Context
Bitcoin recently swept the 100k lows, clearing out built-up liquidity beneath that level. This move formed a strong reaction candle, suggesting interest from buyers and confirming the presence of resting demand. The sweep aligns with the concept of smart money targeting obvious liquidity pools before shifting direction. It also marks a potential short-term low, at least temporarily.
Short-Term Structure and FVG Setup
Following the sweep, price tapped into a clean 1H fair value gap and has been respecting it so far. This is our immediate line in the sand. As long as this gap holds, we’re dealing with a scenario of temporary bullish order flow. The market structure on lower timeframes suggests the potential for a short-term rebound, possibly into the inefficiencies left above.
Upside Target and Gap Fill Potential
If price continues to hold the 1H FVG, we could see a push higher that targets unfilled gaps above, particularly the one where we saw a clean rejection previously. There’s a clear inducement just above recent highs, so a sweep of those could be used to fill that imbalance. This would align with the idea of running internal liquidity before reversing or stalling at supply.
Bearish Breakdown Scenario
On the flip side, if price breaks down from the 1H FVG without reclaiming structure, the entire bullish idea invalidates. In that case, I expect price to gravitate back toward the 97.5k zone. This would be a logical area for deeper mitigation and potential reaccumulation, especially since it sits below the current consolidation. The failure to hold the gap would signal weak demand and continuation of the broader bearish leg.
Scouting Liquidity and Price Flow
Right now, the main idea is tied to how price behaves around the short-term 1H FVG. That is the pivot. Hold it, and we should see some form of liquidity run into the unfilled gap above. Lose it, and the next wave of downside should unlock, pushing us closer to 97.5k. Either way, liquidity remains the core driver in both directions.
Conclusion
Price has swept major downside liquidity and is now reacting to a key imbalance. As long as the 1H fair value gap holds, I expect short-term upside targeting unfilled inefficiencies and internal highs. A failure to hold would shift the bias back to the downside, with the 97.5k range as the next probable draw on liquidity.
___________________________________
Thanks for your support!
If you found this idea helpful or learned something new, drop a like 👍 and leave a comment, I’d love to hear your thoughts! 🚀
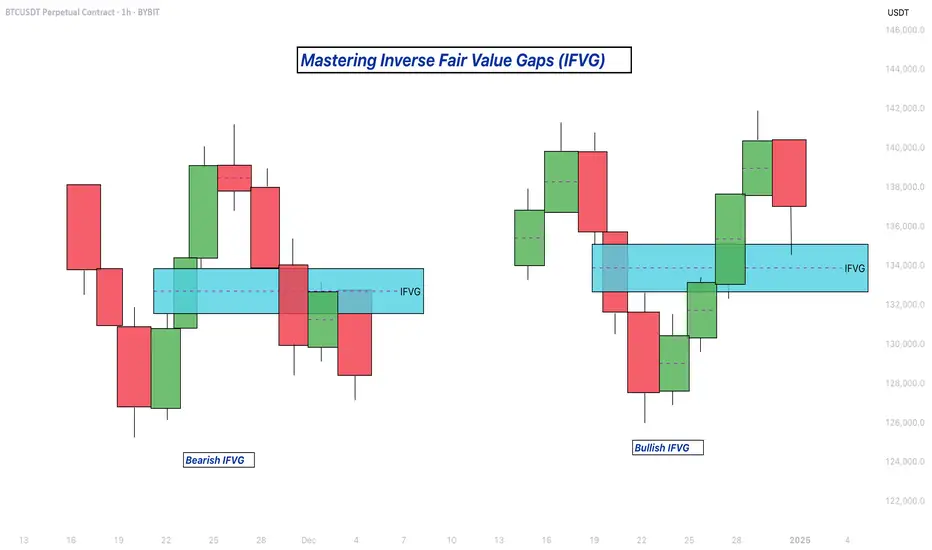
Mastering Inverse Fair Value Gaps (IFVG) - How to use them?In this guide, I’ll explain the concept of the Inverse Fair Value Gap (IFVG), how it forms, and how you can use it to identify high-probability trading opportunities. You'll learn how to spot the IFVG on a chart, understand their significance in price action, and apply a simple strategy to trade them effectively.
What will be discussed?
- What is a FVG
- What is an IFVG
- What is a bullish IFVG
- What is a bearish IFVG
- How to trade the IFVG
-------------------------------
What is a FVG?
A FVG is a technical concept used by traders to identify inefficiencies in price movement on a chart. The idea behind a fair value gap is that during periods of strong momentum, price can move so quickly that it leaves behind a "gap" where not all buy and sell orders were able to be executed efficiently. This gap creates an imbalance in the market, which price may later revisit in an attempt to rebalance supply and demand.
A fair value gap is typically observed within a sequence of three candles (or bars). The first candle marks the beginning of a strong move. The second candle shows a significant directional push, either bullish or bearish, often with a long body indicating strong momentum. The third candle continues in the direction of the move, opening and closing beyond the range of the first candle. The fair value gap itself is defined by the price range between the high of the first candle and the low of the third candle (in the case of a bullish move), or between the low of the first candle and the high of the third (in a bearish move). This range represents the area of imbalance or inefficiency.
-------------------------------
What is an IFVG?
An Inverse Fair Value Gap (IFVG) occurs when a traditional Fair Value Gap (FVG) is not respected by price, and instead of acting as a support or resistance zone, price breaks through it with strength. Normally, a Fair Value Gap represents a price imbalance left by a strong move, and when price returns to this area, it often reacts by respecting the gap, bouncing off it or reversing, because it's seen as a high-probability level where orders may rest.
However, in the case of an IFVG, price does not respect this imbalance. Instead, it slices through the FVG in the opposite direction, showing that the initial momentum behind the imbalance has weakened or reversed. This breach is a strong indication that market sentiment is shifting. What was once a zone of strength now becomes invalid, and this failed reaction signals that the opposite side of the market (buyers or sellers) has taken control.
The IFVG highlights a key transition in momentum. It tells traders that the prior bias, bullish or bearish, is breaking down, and the new dominant force is pushing price beyond levels that would typically hold. This makes the IFVG useful not only as a sign of failed structure but also as a potential confirmation of a trend reversal or strong continuation in the opposite direction. Essentially, where an FVG usually acts as a wall, an IFVG is what’s left after that wall gets knocked down.
-------------------------------
What is a bullish IFVG?
A bullish Inverse Fair Value Gap (IFVG) occurs when price breaks through a bearish Fair Value Gap (FVG) instead of respecting it. In a typical bearish FVG, the expectation is that when price retraces into the gap, it will react to the imbalance, usually by reversing lower, as the area represents previous selling pressure or inefficiency caused by aggressive sellers.
However, when price does not react bearishly and instead breaks cleanly through the bearish FVG, it signals a shift in market sentiment and momentum. This breakout through the imbalance suggests that buyers are now in control and that the bearish pressure in that zone has been absorbed or invalidated. What was once considered a resistance area is now being overpowered, often leading to continued bullish movement.
-------------------------------
What is a bearish IFVG?
A bearish Inverse Fair Value Gap (IFVG) occurs when price breaks through a bullish Fair Value Gap (FVG) instead of respecting it. In a normal bullish FVG, the expectation is that when price returns to the gap, it will act as support and prompt a move higher, as this area represents a previous imbalance created by strong buying pressure.
However, when price fails to respect the bullish FVG and instead breaks down through it, this signals a shift in momentum to the downside. The anticipated support fails to hold, suggesting that buyers are no longer in control or that their efforts have been overwhelmed by aggressive selling. This kind of move transforms the bullish FVG into a bearish signal, as it confirms weakness in what was previously considered a demand zone.
-------------------------------
How to trade the IFVG?
Trading the Inverse Fair Value Gap (IFVG) requires patience, precision, and clear confirmation of a shift in momentum. The process involves waiting for key conditions to form before entering a trade. Here's how to approach it step-by-step:
First, you need to wait for a liquidity sweep. This means price must take out a recent high or low, typically a short-term liquidity pool, trapping traders on the wrong side of the market. This sweep sets the stage for a potential reversal and indicates that the market is ready to shift direction.
After the liquidity sweep, watch for a 1-minute Fair Value Gap (FVG) to form and then get broken in the opposite direction. This break is crucial, it’s what creates the Inverse Fair Value Gap. The invalidation of this initial FVG confirms that momentum has switched and that the market is no longer respecting the previous imbalance.
Once the IFVG has formed, your entry comes on the close of the candle that breaks and closes beyond the IFVG, above it in a bullish scenario, or below it in a bearish one. This close confirms that the gap has not held and that price is likely to continue in the new direction.
Place your stop loss below the low (for a bullish setup) or above the high (for a bearish setup) of the structure that formed the IFVG. This gives you protection just beyond the level that would invalidate the setup.
-------------------------------
Thanks for your support.
- Make sure to follow me so you don't miss out on the next analysis!
- Drop a like and leave a comment!
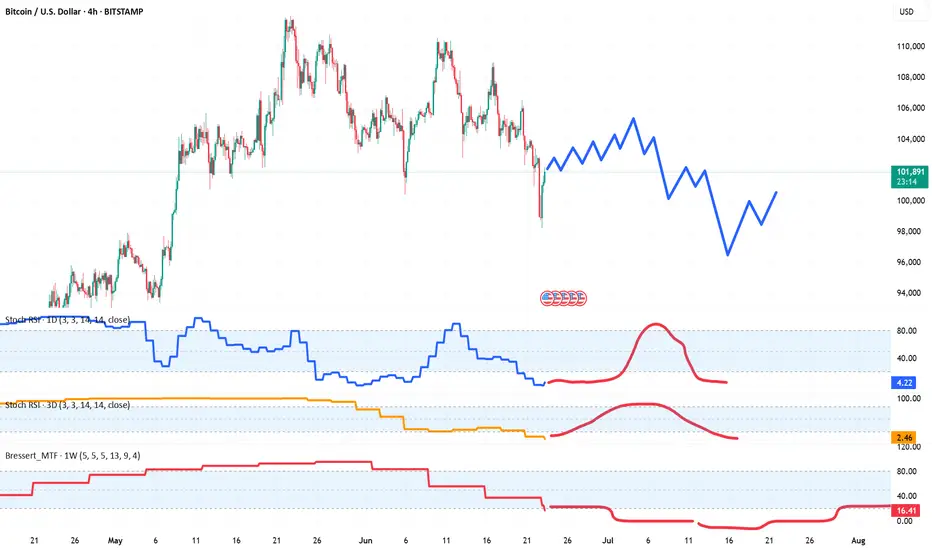
Bitcoin's Failed 60-Day Cycle: Relief Rally Before More DownsideBitcoin has officially failed its current 60-day cycle by breaking below the previous cycle low on June 5th, touching $100,000. This marks a key structural shift that traders should not ignore.
📉 What’s Next? Likely Scenario:
The highest probability setup now is a relief rally toward the Stoch RSI highs on the 1-Day and 3-Day timeframes, followed by a move downward into the 60-day cycle low, projected to form between late July and early August. This aligns with a potential retest of the Value Area Low from April, a key support zone to watch.
📈 Upside Target:
If we do see bullish continuation in the short term, the main upside target is $105,000. This level is significant as it clusters three Weekly Point of Control (POC) levels from May and June, making it a high-liquidity magnet for price. Historically, Bitcoin tends to gravitate toward these levels when several align closely.
💼 Current Positioning:
I’m currently long BTC and ETH, and I’m watching closely for Stoch RSI to top out on the 1-Day and 3-Day timeframes. I’ll look to reduce or exit those positions as we approach those cycle peaks.
🔔 Pro Tip: Price often seeks out stacked POC levels. If you’re a volume profile trader, keep $105K on your radar.
📌 P.S. For access to my custom indicators and deeper cycle analysis, check the description in my profile.
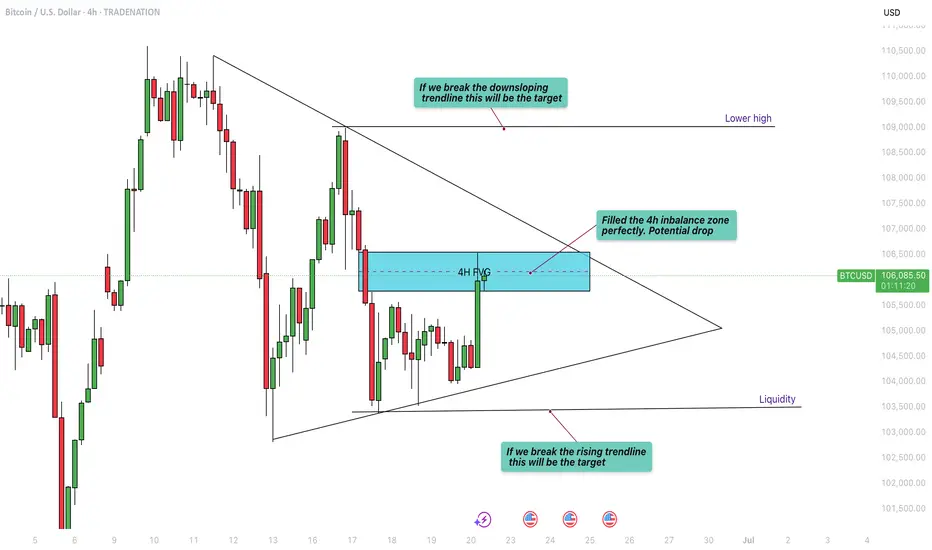
Bitcoin - Will it explode up or down?Introduction
Bitcoin (BTC) is currently trading within a symmetrical triangle pattern, forming a series of higher lows and lower highs. This price action indicates a tightening range as the market approaches the apex of the triangle. A breakout is becoming increasingly likely in the coming days, and traders are now watching closely to see which direction BTC will choose. Will it break to the upside or the downside?
Pattern Trading
The symmetrical triangle has been a consistent feature of BTC’s recent price action. Price has been oscillating between the descending resistance and ascending support trendlines, gradually compressing the range. Based on the current structure, Bitcoin could continue moving within this pattern until around June 26th, when the triangle becomes extremely narrow and a breakout becomes imminent. Historically, such setups can produce false breakouts or “fake-outs,” where the price temporarily moves in one direction before sharply reversing and breaking out in the opposite direction. These moves often trap traders who enter too early, so caution is advised. Market manipulation is not uncommon in these tight formations, making it essential to wait for confirmation before entering a position.
4H Fair Value Gap (FVG)
Bitcoin has recently filled a 4-hour Fair Value Gap (FVG), a zone that often attracts price due to inefficiencies in the market. Now that this gap has been filled, there could be increased selling pressure, potentially pushing BTC back down toward the lower boundary of the triangle. If BTC is unable to break through the resistance created by this FVG, we may see more bearish momentum. However, should BTC manage to break and hold above this imbalance zone, it would be a strong sign of bullish intent and could open the door for a move to the upside. For now, though, this area remains a significant resistance level.
Upside Target
If BTC manages to break out of the triangle to the upside with strong volume and confirmation, the first major resistance level is around $109,000. This would be a logical target for bulls, as it represents a key zone of liquidity and previous interest. A successful move toward this level would confirm the bullish breakout and could set the stage for further gains, depending on broader market sentiment.
Downside Targets
Conversely, if BTC breaks below the lower trendline of the triangle, the first area to watch is around $103,500. This level is where a significant amount of liquidity has built up, and it could act as initial support. However, if that level fails to hold, the next key psychological level to watch would be $100,000. A drop below this milestone could trigger panic selling and further downside, especially if market sentiment turns negative.
Conclusion
At this point, BTC is at a critical juncture, and traders should remain patient as the market decides its next direction. While the current rejection from the 4H FVG suggests some short-term bearish pressure, the overall pattern remains neutral until a confirmed breakout occurs. Trading within the triangle can be risky due to the possibility of fake-outs, so it’s best to wait for clear confirmation before committing to a trade. Stay cautious, manage your risk carefully, and prepare for volatility as Bitcoin approaches a decisive move.
Disclosure: I am part of Trade Nation's Influencer program and receive a monthly fee for using their TradingView charts in my analysis.
Thanks for your support.
- Make sure to follow me so you don't miss out on the next analysis!
- Drop a like and leave a comment!
Bitcoin - Expecting Liquidity Grab at 102.8k Before Relief MoveMarket Context
After a strong rejection from resistance, price has shown clear signs of internal weakness. We recently got an internal liquidity sweep followed by a sharp move down, confirming a shift in momentum. The market is currently compressing just below a key fair value gap, hinting at further downside before any real bullish structure can form
Internal Sweep and Bearish Pressure
The internal sweep acted as a final inducement before the market sold off. The reaction afterward was clean and aggressive, suggesting that smart money is offloading positions into trapped longs. Price has now stalled in a tight range, and the lack of bullish follow-through adds weight to the idea that lower prices are still on the table.
Fair Value Gap Below as Draw
The unfilled imbalance below, lining up near 102.8k, is acting as a magnet. This level has not been tapped and lines up cleanly with the idea of a final liquidity sweep before any retracement. It would make sense to target this zone to clear out remaining liquidity and rebalance price before reassessing.
Retracement Scenarios After the Sweep
Once that low is swept and the gap is filled, we could see a retracement back into the previous fair value gap around 106k. This could either form a lower high, continuing the broader downtrend, or potentially run the high if there's enough momentum. Either way, the reaction from that level will offer the next major clue on direction.
Key Expectation
Until the low around 102.8k is swept, the bearish narrative remains intact. The cleanest setup would be a liquidity run into that level followed by a reaction that leads us higher, ideally back toward the 106k zone. From there, we’ll watch how price behaves to decide whether a deeper correction or a trend continuation is in play.
Conclusion
Still leaning bearish short-term as long as that gap and low remain unfilled. Once we tap into the 102.8k area, I’ll be watching for a shift that could give us a play back into the 106k gap. It’s all about liquidity, structure, and the cleanest path for smart money to move.
Disclosure: I am part of Trade Nation's Influencer program and receive a monthly fee for using their TradingView charts in my analysis.
Thanks for your support!
If you found this idea helpful or learned something new, drop a like 👍 and leave a comment, I’d love to hear your thoughts! 🚀
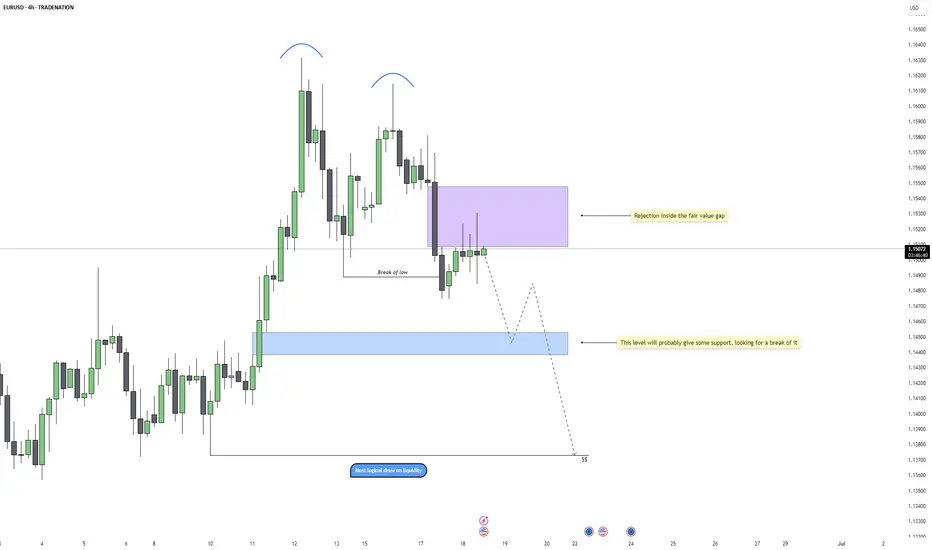
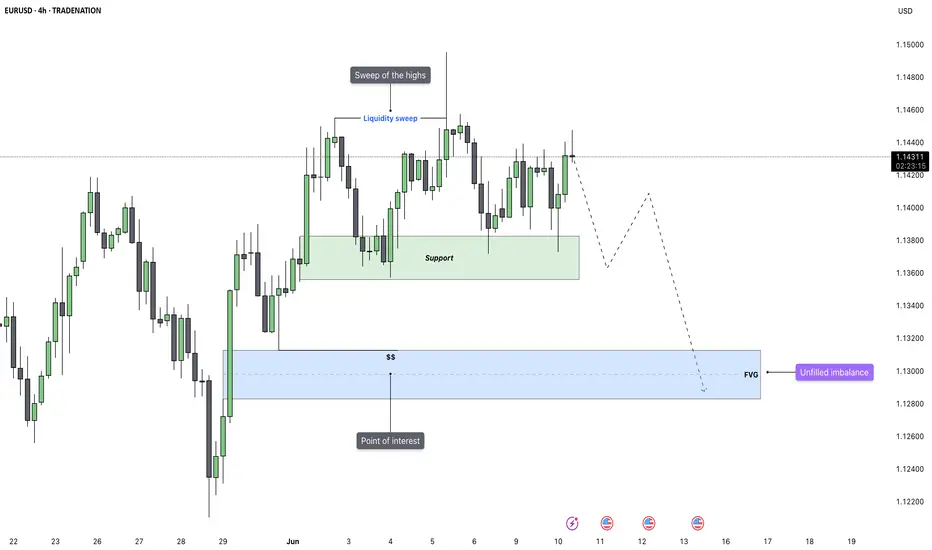
EURUSD - FVG Rejection and Bearish Continuation PlayEURUSD has been showing consistent bearish pressure on the 4H chart, with a clear shift in momentum after forming a double top near 1.162. That marked the beginning of a structural change, which was confirmed once price broke the most recent higher low. Since then, the market has transitioned into a bearish structure, with lower highs forming consecutively. This suggests that the bullish trend is over for now, and the market is more likely to seek liquidity below.
Rejection at Fair Value Gap
After the low was broken, price retraced back into a 4H fair value gap, which has now acted as resistance. This is typical smart money behavior, sweep liquidity, shift structure, then retest an imbalance before continuing lower. The wick rejection inside the purple FVG zone is a strong signal that this area is being respected and that sellers are defending it. The rejection aligns with the overall bearish market flow and suggests that the market has likely completed its retest.
Short-Term Support and Liquidity Target
The light blue FVG around 1.144 could offer temporary support, but the bias remains bearish. That level sits right at the midpoint of the recent bullish leg that was already violated, and while price may pause here, the more logical draw on liquidity sits deeper. Unless there’s a sudden shift in market structure or high-impact fundamental news, this area is expected to eventually give way.
Liquidity Below and Final Target
The cleanest and most obvious liquidity pool rests around the 1.137 zone. This is where price previously consolidated before initiating the impulsive move higher, and it remains unmitigated. If the current bearish structure holds, the market will likely target this area next. The path there might not be linear, we could see a short-term bounce off 1.144, but as long as price remains below the 1.153 FVG rejection, the bearish continuation remains valid.
Trade Expectation and Risk Context
This setup aligns well with typical displacement-retest-continuation behavior. The risk is clearly defined above the FVG rejection, and as long as lower highs continue forming beneath that zone, the bearish thesis remains intact. Key downside targets are 1.144 for partials, and 1.137 as the final draw on liquidity. This setup offers both precision and strong narrative confluence, ideal for swing or intraday positioning.
Conclusion
Price has shifted bearish on the 4H, confirmed by a break of structure and rejection from a clear FVG. As long as we remain below that imbalance, the market should continue hunting liquidity to the downside. 1.144 may act as short-term support, but the real magnet sits at 1.137. Patience and risk control will be key in riding this move effectively.
Disclosure: I am part of Trade Nation's Influencer program and receive a monthly fee for using their TradingView charts in my analysis.
___________________________________
Thanks for your support!
If you found this idea helpful or learned something new, drop a like 👍 and leave a comment, I’d love to hear your thoughts! 🚀
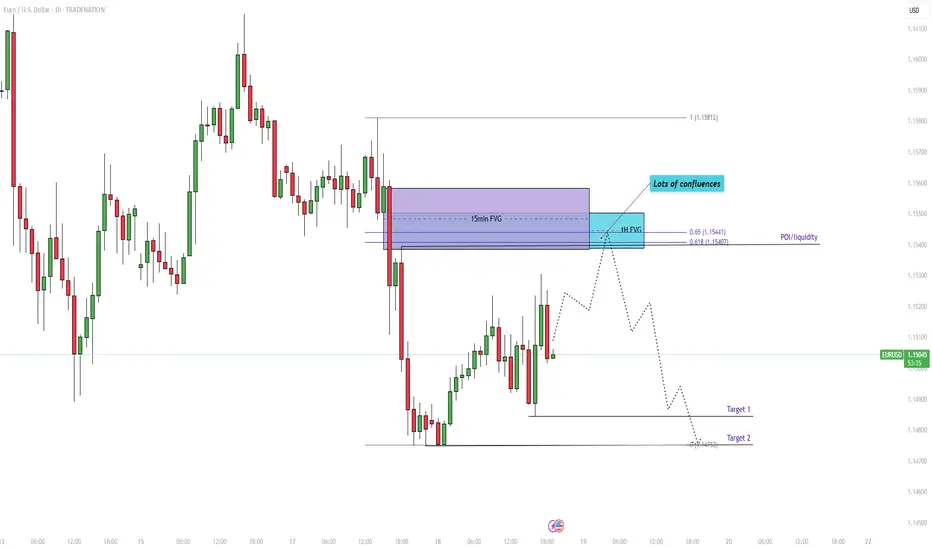
EUR/USD - Eyes on the major resistance at 1.1540!Introduction
The EUR/USD currency pair has been trending downward on the 1-hour timeframe, indicating that bearish momentum is firmly in control. In this analysis, I will outline what to expect from the pair moving forward, and highlight the high-confluence zone that could offer a potential short setup. This area combines technical factors that suggest it may act as strong resistance if price retraces upward before continuing the downtrend.
Market Structure
On the 1-hour chart, the EUR/USD continues to form a series of lower highs and lower lows, which clearly confirms a bearish market structure. This consistent pattern reinforces that sellers have the upper hand, and that any short-term rallies are likely to be corrective in nature, not trend-changing. As long as this structure remains intact, the broader expectation remains bearish, with sellers likely to defend key resistance levels.
Fair Value Gaps on the 15-Minute and 1-Hour Timeframes
During the latest downward movement, the pair left behind two notable Fair Value Gaps, one on the 1-hour chart and another on the 15-minute chart. These imbalances are closely aligned, creating a strong confluence zone where price may face resistance if it moves back upward. The zone between 1.15400 and 1.15600 represents this overlapping FVG area. Because these gaps were formed by aggressive selling pressure, revisiting this level could trigger a bearish reaction, as traders look to re-enter short positions from a premium price.
Golden Pocket Fibonacci Retracement
Adding to this confluence, the Golden Pocket, the area between the 61.8% and 65% Fibonacci retracement levels, lies between 1.15407 and 1.15441. This zone is widely respected among traders due to its tendency to act as a reversal point in trending markets. The fact that it aligns so closely with both the 15-minute and 1-hour FVGs increases the likelihood of price reacting here. If the market retraces into this pocket, we could see renewed selling pressure, making it a valuable level to watch for short entries.
Point of Interest and Liquidity Zone
Within the latest leg down, there was a brief two-hour consolidation before the pair continued lower, leaving behind a distinct wick to the upside. This area is significant because it likely represents a point of interest where buy-side liquidity was grabbed. Many traders who entered shorts early may have placed their stop-losses above this consolidation high, creating a liquidity pool. This level, sitting inside the broader resistance zone formed by the FVGs and the Golden Pocket, adds another layer of technical significance. Price may move into this liquidity before reversing lower, offering a potential trap for buyers and an opportunity for sellers.
Downside Targets
If the price reacts to the resistance zone and resumes its downward movement, there are two logical targets to the downside. The first is 1.1485, which corresponds to the most recent swing low. The second target is 1.1475, which represents a deeper low and a stronger potential support level. These levels align with previous structure and could serve as key take-profit zones for traders holding short positions.
Conclusion
The EUR/USD remains in a well-defined downtrend, and several technical elements now converge between 1.15400 and 1.15600 to form a strong resistance zone. This area includes the 15-minute Fair Value Gap, the 1-hour Fair Value Gap, the Golden Pocket Fibonacci retracement, and a significant point of interest tied to liquidity. While the pair may not need to reach this zone before continuing lower, if it does, it is likely to act as a barrier to further upside. For traders looking to follow the dominant trend, this high-confluence area offers a potential entry point to the downside, with clear structure-based targets below.
Disclosure: I am part of Trade Nation's Influencer program and receive a monthly fee for using their TradingView charts in my analysis.
Thanks for your support.
- Make sure to follow me so you don't miss out on the next analysis!
- Drop a like and leave a comment!
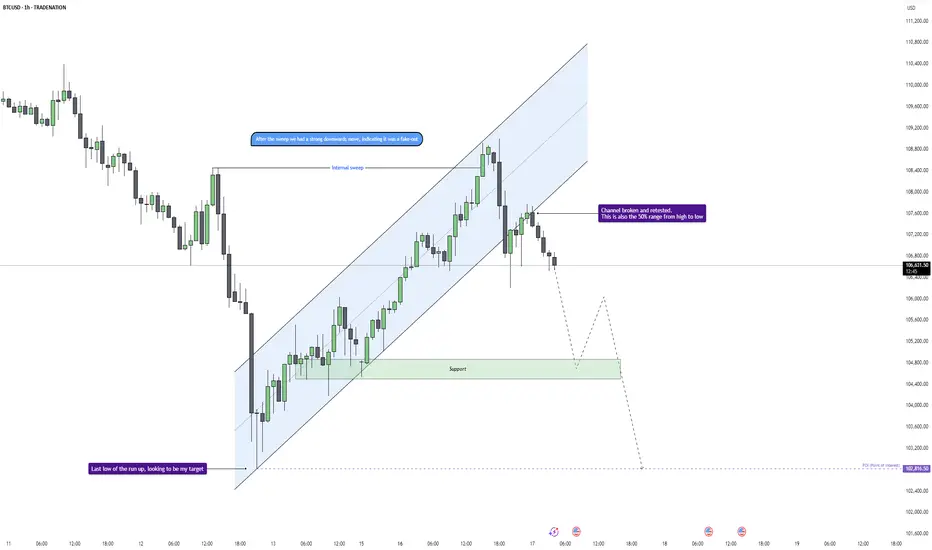
Bitcoin - Trend Shift Confirmed, Eyes on $102.8K LiquidityMarket Context
Bitcoin showed signs of exhaustion after a strong short-term rally within a clean upward channel on the 1H chart. Price action had been respecting the trend structure until a key deviation occurred near $108,500, where we saw an internal liquidity sweep that hinted at potential distribution.
Fake-Out Confirmation and Shift in Momentum
After taking out local highs around $108.5K, price failed to continue higher and instead reversed sharply, confirming the sweep as a classic fake-out. This kind of internal liquidity grab is typically used to trap breakout buyers before reversing and targeting previous lows.
Break of Structure and Channel Retest
The rising channel was broken convincingly, and price has now retested the underside of the channel, aligning with the 50% equilibrium of the entire high-to-low range. This reinforces the bearish bias and suggests the market has likely shifted from accumulation to distribution.
Downside Targets and Key Levels
Immediate support sits around $104.6K, which served as a consolidation base during the earlier run-up. If this level fails to hold, the next key target would be a sweep of the previous significant low at $102.8K. This area is marked as a point of interest and could offer a reaction or reversal.
Price Expectations and Trade Outlook
As long as price remains below the broken channel and under $107K, the bearish scenario remains in play. I’m watching for bearish continuation into $104.6K first, and a potential full sweep toward $102.8K if that support fails.
Conclusion
The internal sweep followed by impulsive rejection, combined with a clear channel breakdown and retest, shifts the bias to bearish. A move into the $104.6K region seems probable, with a lower liquidity target at $102.8K in sight if downside pressure accelerates.
Disclosure: I am part of Trade Nation's Influencer program and receive a monthly fee for using their TradingView charts in my analysis.
___________________________________
Thanks for your support!
If you found this idea helpful or learned something new, drop a like 👍 and leave a comment, I’d love to hear your thoughts! 🚀
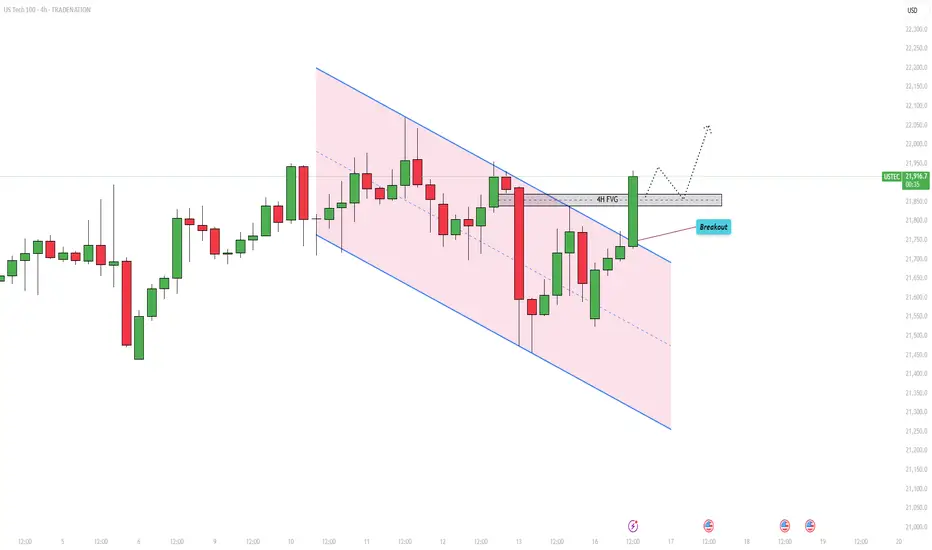
US100 – Eyes on $22,040 as bulls take chargeIntroduction
The US100 is currently showing signs of a bullish breakout, moving above the boundaries of a previously established parallel channel. It is now approaching an important area of imbalance, known as a Fair Value Gap (FVG), on the 4-hour chart. If the index manages to break through this zone, there is a strong potential for continued upward momentum. Let’s take a closer look at the technical setup and what might come next.
Parallel Channel
For some time, the US100 had been trading within a downward-sloping parallel channel, consistently making lower highs and lower lows. However, today's price action has changed that narrative. The index has broken out of the channel to the upside and is currently pushing towards new short-term highs, which could mark the beginning of a bullish trend reversal.
4-Hour Fair Value Gap (FVG)
The current focus is on an open 4-hour FVG that ranges from approximately 21,840 to 21,870. This zone could serve as a significant resistance level, potentially rejecting further upward movement. However, if the US100 breaks decisively above this range, it could open the door for a rapid push toward previous highs. Such a move would signal strong bullish momentum and confirm the breakout as legitimate.
Possibility of a False Breakout
There is always the risk that this breakout could turn out to be a false move. If the US100 fails to hold above the 4-hour FVG and reverses back below the channel breakout point, it could indicate a bull trap. In that case, the index may resume its downward trend. Still, based on the current momentum and market structure, this scenario seems less likely at the moment.
Upside Target
If the breakout above the FVG is successful, the next significant target lies at the recent highs near 22,040. This level is expected to act as strong resistance. Should the US100 manage to break through it, we could see a test of the all-time high in the near future. However, it’s important to approach the market with patience and let each level confirm itself before expecting further upside.
Conclusion
While the US100 has successfully broken out of its parallel channel, it is now facing a key test at the 4-hour FVG. A clean break above this zone would likely shift market sentiment to bullish and set the stage for a move toward 22,040 and potentially beyond. Until then, traders should watch closely for confirmation and be mindful of the possibility of a pullback.
Disclosure: I am part of Trade Nation's Influencer program and receive a monthly fee for using their TradingView charts in my analysis.
Thanks for your support.
- Make sure to follow me so you don't miss out on the next analysis!
- Drop a like and leave a comment!
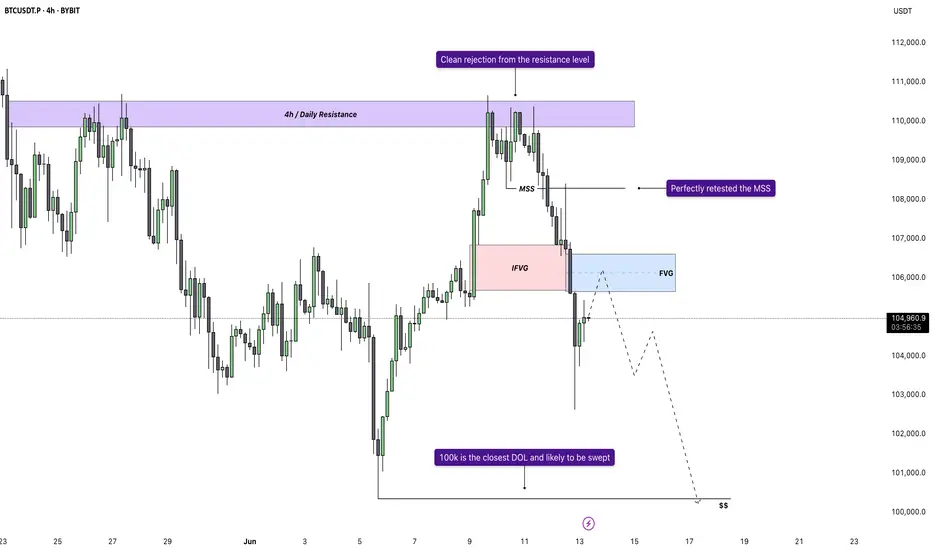
Bitcoin - Bears vs Bulls: $100k next?Price recently tapped into a well-defined 4H and daily resistance zone and was met with an immediate rejection. That rejection wasn’t just a reaction, it led to a confirmed market structure shift as price broke the previous low. This transition from higher highs to a lower low signals the first sign of bearish control, flipping the short-term bias and setting the tone for a move lower.
Retest of MSS and Inversion Fair Value Gap
After the break in structure, price retraced directly into the origin of the move, retesting the same zone where the shift occurred. A previously bullish 4H gap has now flipped into resistance, rejecting price perfectly. This inversion, where a bullish imbalance turns into a bearish reaction zone, confirms the change in direction and strengthens the downside narrative.
New FVG as Entry Opportunity
The latest bearish impulse created a clean new fair value gap just above current price. A retest of this gap would offer a high-probability continuation setup, as it aligns with both recent structure and order flow. This zone becomes the critical level for bears to defend, and unless price reclaims it, the expectation remains for continuation toward lower liquidity.
Liquidity Outlook and Bearish Target
Below current price, a large pool of liquidity is sitting just above a major psychological round number. That level hasn’t been swept yet and is a likely downside magnet. With no meaningful support between the current FVG and that draw on liquidity, price is likely to reach for it next. This fits the typical sequence following a market structure shift: rejection, shift, retest, continuation, and liquidity sweep.
Momentum and Contextual Confluence
Zooming out slightly, the current move fits within broader bearish momentum that has been developing across timeframes. There’s no sign of strong bullish absorption, and each push higher has been met with efficient selling. This isn’t a chaotic breakdown, but a controlled sequence of lower highs and lower lows, supported by clean structural shifts and consistent rejection zones.
Conclusion
The chart tells a clear story. A clean rejection from a key resistance zone led to a confirmed bearish structure shift, followed by a textbook retest and fresh fair value gap. As long as price remains below that gap, the setup favors continuation lower, with the nearest liquidity pool being the most likely draw. This remains a high-probability bearish scenario until proven otherwise by a shift back above invalidation levels.
___________________________________
Thanks for your support!
If you found this idea helpful or learned something new, drop a like 👍 and leave a comment, I’d love to hear your thoughts! 🚀
EURUSD - Waiting for the Breakdown After 4H SweepEURUSD has just completed a sweep of the 4H highs, tagging liquidity resting above the consolidation range. That move looks like a classic inducement, with price now reacting lower and showing signs of weakness. This type of sweep, especially when it happens inside a range, often leads to a reversal back through the range, provided the internal low breaks cleanly. Right now, price is still hovering above that key point, but we can see signs of slowing momentum already.
Liquidity Context and Sweep Logic
This recent push above the highs fits well within ICT-style logic: a sweep of internal range liquidity that serves to fuel the opposite move. The chart shows a textbook example of a consolidation phase being manipulated to the upside first, where buy stops get triggered and liquidity is taken. The real move tends to unfold after that, once we get confirmation through structure breaks and displacement to the downside.
Structure Break and Bearish Confirmation
The internal low within the range is acting as a key trigger level. A clean break below that would serve as confirmation of a bearish market structure shift. That’s the point where the market goes from internal liquidity hunt to actual displacement. If that low gives way, the probability of continuation lower increases significantly, and that’s where I’ll be expecting price to seek the next pocket of liquidity.
Support and Key Area of Interest
There’s also a well-respected support level not too far below, one that price has bounced from several times. That area could either act as a temporary reaction zone or, if broken impulsively, could open the path toward deeper inefficiencies. Ideally, I want to see price break below both the internal low and this support area, then continue toward my next level of interest where I expect either a reaction or a higher probability setup to form.
Conclusion
For now, this setup is a waiting game. The liquidity has been swept on the upside, and now it’s all about whether the structure confirms to the downside. I’m not interested in chasing the first move. What I want to see is displacement below the internal low and support level, followed by continuation or a clean reaction from the next zone of interest.
Disclosure: I am part of Trade Nation's Influencer program and receive a monthly fee for using their TradingView charts in my analysis.
___________________________________
Thanks for your support!
If you found this idea helpful or learned something new, drop a like 👍 and leave a comment, I’d love to hear your thoughts! 🚀
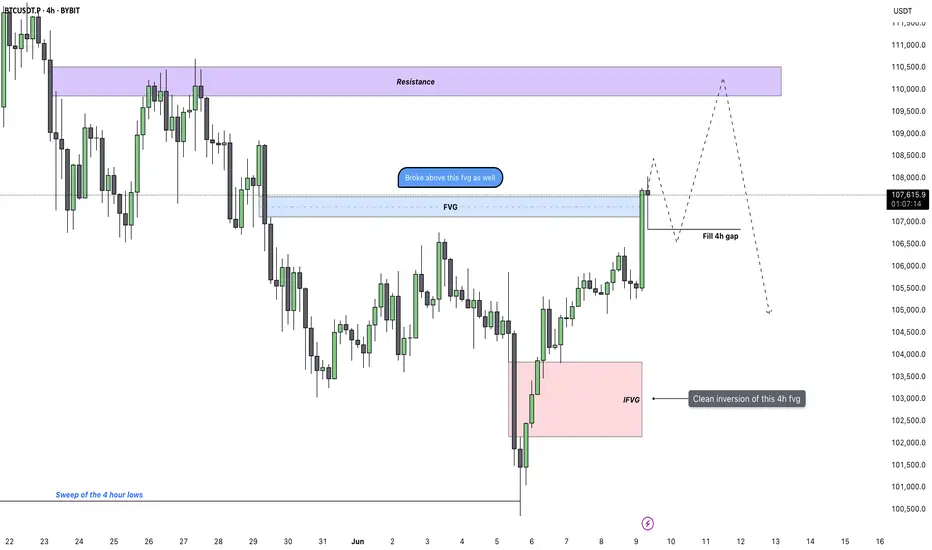
Bitcoin - Bulls in Control: Aiming For $110kBitcoin has just confirmed a strong bullish breakout after consolidating beneath a prior fair value gap. The market not only broke out of that zone cleanly but did so with conviction, creating a new inversion fair value gap (IFVG) along the way. This type of structure often indicates a shift in sentiment, especially when paired with increasing volume and impulsive candles.
Fair Value Gap Break and Continuation Context
Following the breakout, price surged straight through another 4H FVG overhead, flipping it with strength and no hesitation. That kind of move shows clear intent. The market didn't pause or stall at resistance, which increases the probability that the same pattern could play out again, clean break, shallow pullback, and continuation. The breakout level now holds as short-term support.
Near-Term Expectations – FVG Fill Before Higher
With this latest 4H candle close, I’m now expecting a short pullback to fill the newly created 4H FVG below. This would provide the market with the fuel it needs to continue higher without leaving inefficient price action behind. The structure is setting up a classic breakout-fill-continue sequence, and the next key objective sits just below a clear resistance zone overhead.
Conclusion
Bitcoin broke out of a compression zone, formed an IFVG, and followed up with a strong push through the next fair value gap. I’m expecting a controlled retracement to fill the new 4H imbalance, after which price could continue pushing toward the major resistance area. The momentum is clean and structured—until that changes, continuation remains the more likely path.
___________________________________
Thanks for your support!
If you found this idea helpful or learned something new, drop a like 👍 and leave a comment, I’d love to hear your thoughts! 🚀
Bitcoin - Showing strength as it breaks key resistance levels!Bitcoin (BTC) recently demonstrated impressive strength by bouncing off a well-known confluence zone consisting of the golden pocket and a 4-hour fair value gap (FVG) around the $100,000 level. This technical area has historically acted as a reliable support and once again proved its significance, offering a solid foundation for the current rally.
Following this bounce, BTC surged to $108,000, decisively breaking above the 4-hour FVG near $107,000. With this breakout, the previously resistant zone is now expected to flip into support, adding further confidence to the bullish outlook. This type of price action is often seen in strong uptrends, where key resistance levels are reclaimed and converted into support, providing a base for further upside.
Importantly, BTC has also managed to push through the golden pocket resistance, a critical Fibonacci retracement area closely watched by traders. This breakout, in conjunction with the 4H FVG clearance, clears the path for a potential continuation toward Bitcoin’s all-time high.
Momentum is clearly building. Buying pressure is strong, and retracements have been shallow, indicating a market dominated by demand. While this is a bullish sign, a brief pullback or bounce off the newly formed support (the 4H FVG zone) would be healthy. Such a move would allow BTC to consolidate and build strength before potentially pushing toward new highs.
Overall, the technical landscape looks increasingly favorable for BTC. As long as it holds above the reclaimed support zones, the path to retesting, and possibly surpassing, the all-time high appears wide open.
Thanks for your support.
- Make sure to follow me so you don't miss out on the next analysis!
- Drop a like and leave a comment!