IREDA India should target 253.8Daily chart,
The stock NSE:IREDA has crossed a falling expanding wedge, and the target is 253.8, passing through a strong resistance level at 234.3
However, there is a strong Resistance line R, currently around 172.7
So, after stabilizing above 172.7 for 2 days, the target should be confirmed for a new entry (buy)
Consider a stop loss below 154, and raise the level along with the bullish movement.
Technical indicators:
RSI is forming a bullish direction - positive
MACD is about to cross up the zero line - To be assertive after crossing both the zero line and its signal.
Fallingexpandingwedgepattern

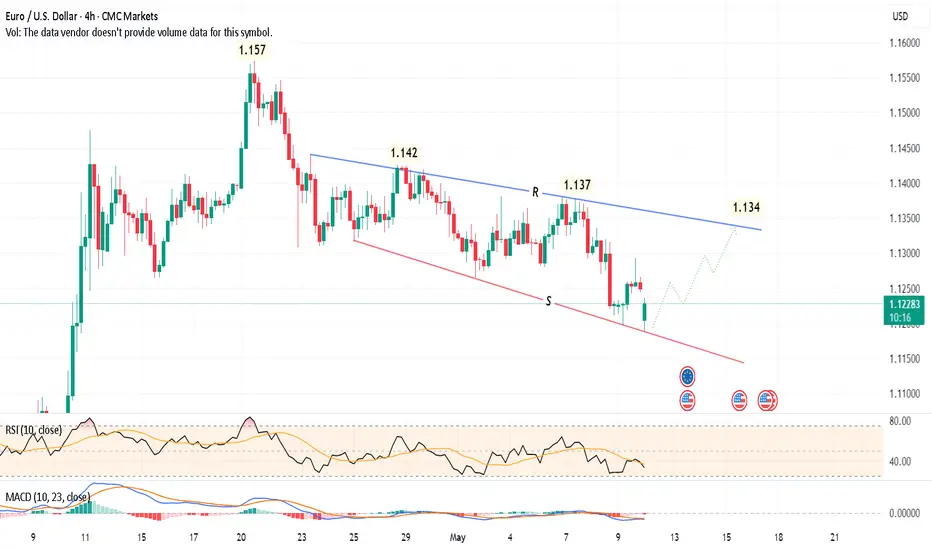
EUR/USD should rebound to 1.1344-hour chart,
The EUR/USD CMCMARKETS:EURUSD is trading in a falling expanding (broadening) wedge pattern. The price rebounded from the support level S, and is expected to test the upper resistance line R - at around 1.134
After crossing the line R, and stabilizing for 12 hours above this level, the target will be 1.157 to 1.159 - passing through the shown resistance levels 1.137 and 1.142
Consider a stop loss below the support line (currently 1.119)
RSI is in the buy zone. MACD needs to cross up its signal line to confirm.
IREDA India should target 253.8
Daily chart,
The stock NSE:IREDA has crossed a falling expanding wedge, and the target is 253.8, passing through a strong resistance level at 234.3
However, there is a strong Resistance line R, currently around 172.7
So, after stabilizing above 172.7 for 2 days, the target should be confirmed for a new entry (buy)
Consider a stop loss below 154, and raise the level along with the bullish movement.
Technical indicators:
RSI is forming a bullish direction - positive
MACD is about to cross up the zero line - To be assertive after crossing both the zero line and its signal.
