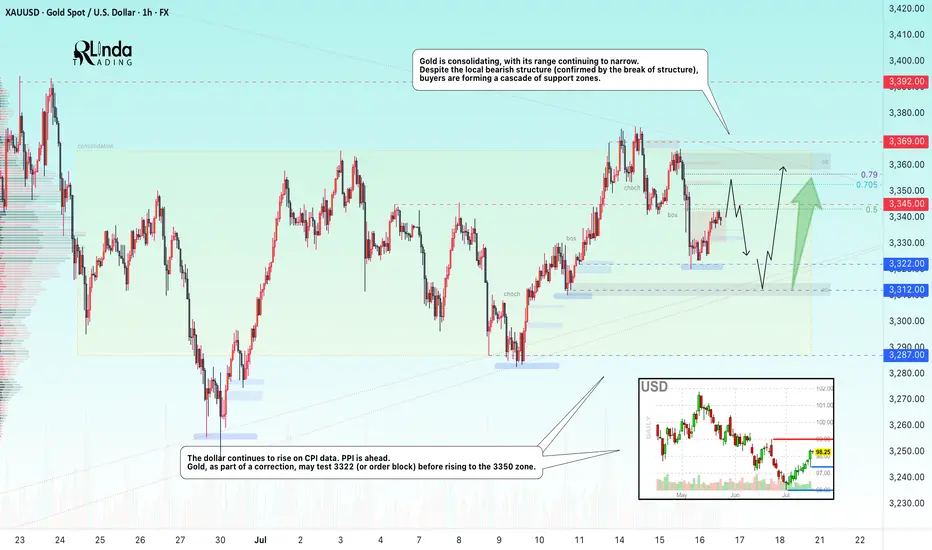
GOLD → Borders are shrinking. Consolidation continues...FX:XAUUSD is adjusting amid controversial CPI data and confirming the local bearish market structure. The PPI is ahead, and gold is consolidating, with its boundaries continuing to narrow...
Gold is recovering slightly but remains under pressure amid rising bond yields and a stronger US dollar. Higher inflation in the US reduces the chances of a quick Fed rate cut. Traders are cautious ahead of the PPI data release. If producer inflation exceeds forecasts, the dollar may rise again, putting further pressure on gold
Technically, we see consolidation in a symmetrical triangle pattern. Trading within the consolidation has a negative side - low volatility and unpredictable movements. The purpose of such movements is accumulation. However, decisions can be made based on relatively strong levels. In the current situation, we are seeing a rebound from 0.5 Fibonacci (I do not rule out a retest of the 0.7 zone before correction). The price may head towards the liquidity zone of 3322 before rising to the upper boundary of the consolidation and the zone of interest of 3350-3360.
Resistance levels: 3345, 3353, 3369
Support levels: 3322, 3312, 3287
The problem is that the price is in a consolidation phase. That is, technically, it is standing still and moving between local levels. You can trade relative to the indicated levels. Focus on PPI data. At the moment, gold is in the middle of a triangle and is likely to continue trading within the boundaries of a narrowing channel due to uncertainty...
Best regards, R. Linda!
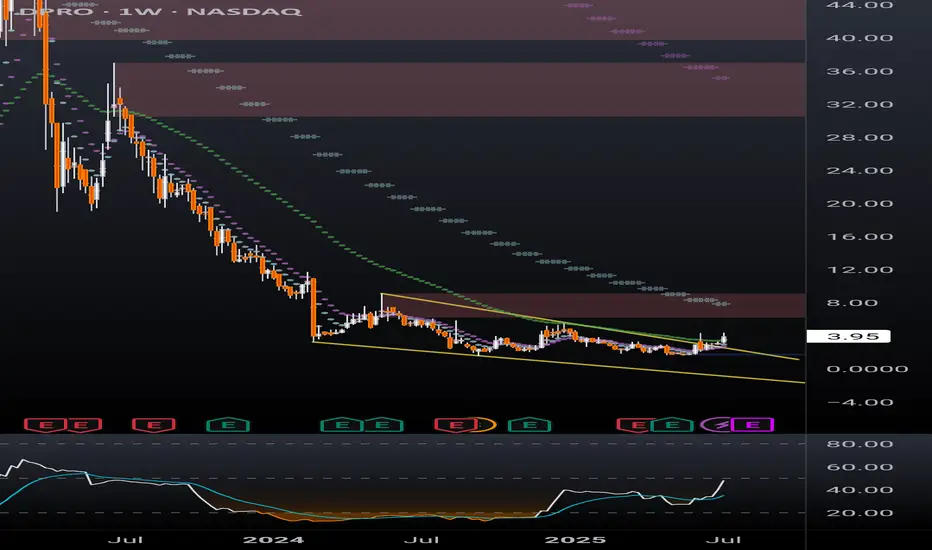
Falling Wedge
DPRO falling wedge breakoutDPRO has broken out of a falling wedge on the weekly. Ticker will respond well to Trump's "Big Beautiful Bill" which includes over $30 billion for defense/military spending. The drone company is already making progress with US military projects and is setting up for a strong rally.
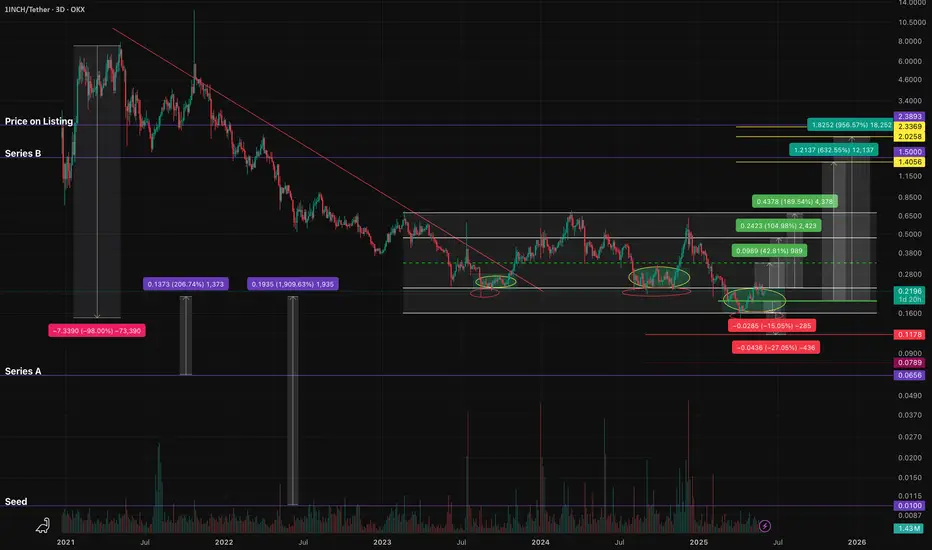
1INCHUSDT - fear zone, return to the channel, growth potential1inch - is a decentralized exchange (DEX) aggregator that combines multiple DEXs into a single platform, aiming to provide users with the most efficient routes for swaps across all platforms.
📍 CoinMarketCap : #160
📍 Twitter(X) : 1.3M
The coin has already been listed on exchanges during the distribution phase of the cycle and was partially sold off in waves. Then, in line with the overall market, it declined to more reasonable accumulation prices, shaking out small investors and those who entered positions on positive news.
The price has been moving within a horizontal channel for a couple of years, and the channel’s percentage range reflects the coin’s liquidity. Currently, the coin is in a fear zone, at its lowest price levels. In moments like this, very few people have funds left to accumulate positions, as they’ve already been trapped by optimistic bloggers and a positive news background earlier.
Many were wiped out recently due to a breakdown and consolidation below the previous support of the inner channel, and now there's emptiness and fear below. What’s happening now is an attempt to return back into the inner channel. If this zone holds, the channel targets may be realized.
Resistance zones where the price may react are marked on the chart. Potential final downside wicks are also indicated. It’s important to allocate funds wisely for position building and use proper percentage distribution, according to your own experience!
______
📌 Not financial advice. Observing structure and recurring phases.
Operate within your strategy and with an awareness of risks.
NZDCHF → Pre-breakdown consolidation on a downtrendFX:NZDCHF is forming a pre-breakout consolidation amid a downtrend. Focus on support at 0.4759. Global and local trends are down...
On July 10-11, the currency pair attempted to break out of the trend. In the chart, it looks like a resistance breakout, but technically it was a short squeeze aimed at accumulating liquidity before the fall. We can see that the price quickly returned back and the market is testing the low from which the trap formation began. The risk zone for the market is 0.4759 - 0.475. In simple terms, this is a bull trap against the backdrop of a downtrend. The NZD has passed through the risk zone. At this time, the currency pair is forming a pre-breakout consolidation relative to the support level of 0.4759 with the aim of continuing its decline.
Support levels: 0.4759, 0.4753
Resistance levels: 0.477, 0.4782
A breakout of the 0.4759 level and consolidation in the sell zone could trigger a continuation of the decline within the main and local trends.
Best regards, R. Linda!

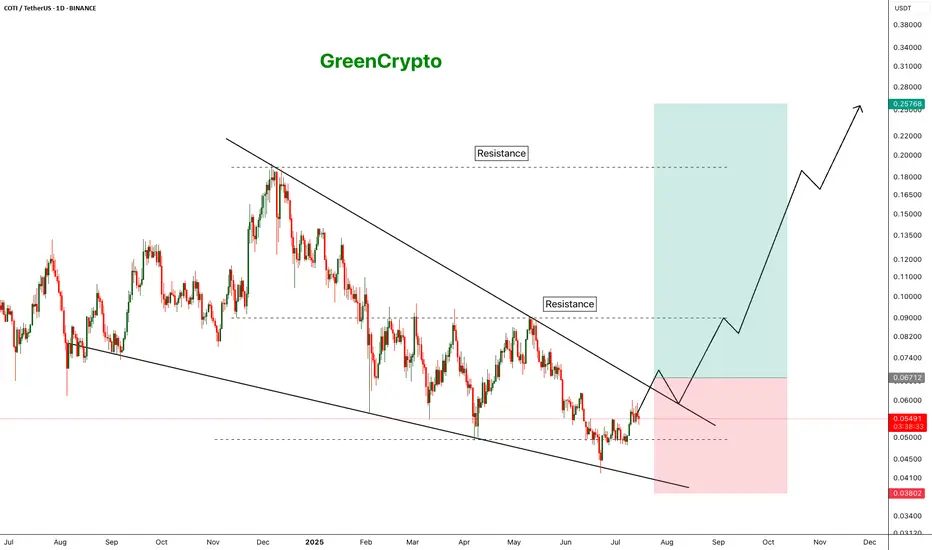
COTI - Crazy Breakout Soooooon- COTI is trading inside the falling wedge pattern
- Price is currently nearing the resistance trendline,
- A clear breakout of this trendline will push the price higher
- we will enter a long trade after the breakout
Entry Price: 0.06696
Stop Loss: 0.03793
TP1: 0.07746
TP2: 0.10366
TP3: 0.14599
TP4: 0.25150
Don't forget to keep stoploss
Cheers
GreenCrypto
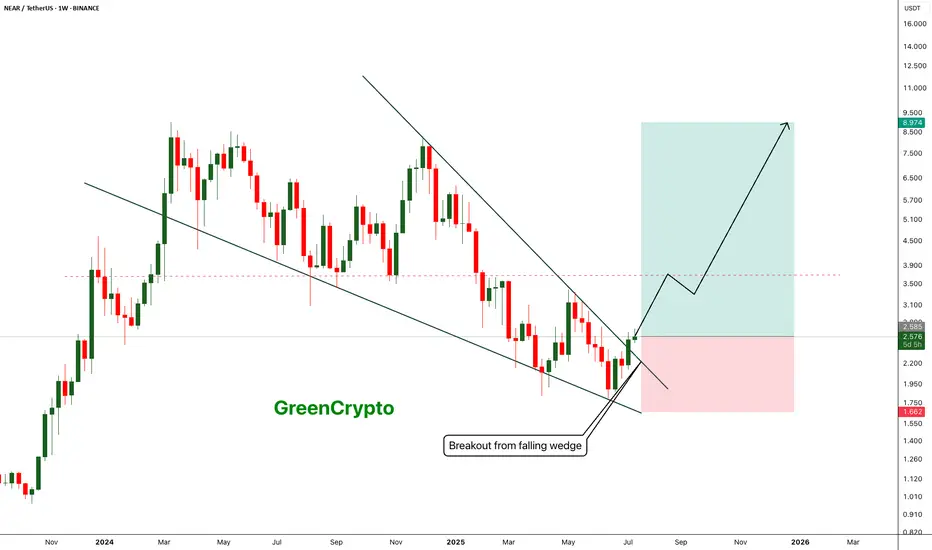
NEAR - Breakout from falling wedge pattern- Near has successfully broken out from the falling wedge pattern and now heading towards the next minor resistance around 3.6 range
- breakout from the minor resistance should push price towards the 9$ range
Entry Price: 2.57
Stop Loss: 1.66
TP1:2.935
TP2: 3.256
TP3: 3.986
TP4: 5.461
TP5: 7.102
TP6: 8.948
Stay tuned for more updates.
Cheers
GreenCrypto
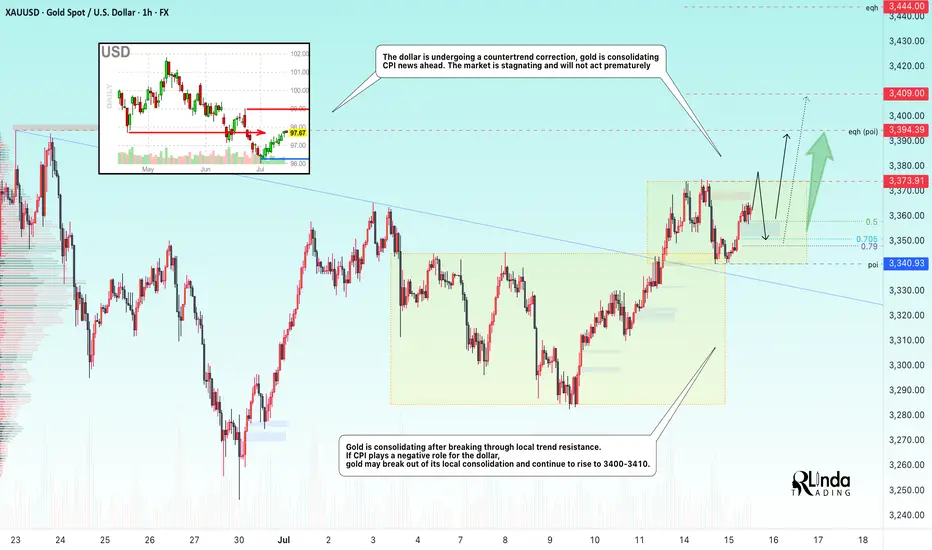
GOLD → Consolidation ahead of CPI. Chances for growth?FX:XAUUSD Gold is consolidating amid a correction in the dollar ahead of important news. Consumer price index data is due later today. The market is stagnant and will not move prematurely.
On Tuesday, gold rose slightly amid profit-taking ahead of the US CPI release. Investors are waiting for a signal from inflation: weaker data could strengthen bets on a Fed rate cut and support gold, while strong inflation would strengthen the dollar and put pressure on the metal. The situation is exacerbated by Trump's new tariff threats and his criticism of the Fed chair. Let me remind you of Trump's pressure on regulators regarding inflation and interest rate cuts.
Technically, gold is trading above the previously broken “symmetrical triangle” consolidation. Bulls are trying to hold their ground above 3340-3350. Focus on the current range of 3340-3373
Resistance levels: 3373, 3394
Support levels: 3350, 3340
Favorable news for gold could boost interest in the metal, which would generally lead to growth. However, there is a factor of unpredictability, and against this backdrop, gold may test support at 3350-3340. If the bulls manage to keep the price above this zone, we may see growth in the medium term. Otherwise, the price may drop to 3310-3280.
Best regards, R. Linda!
TON It will grow soon...So if you pay attention to the TON chart you can see that the price has formed a Ascending wedge which means it is expected to price move as equal as the measured price movement.( AB=CD )
NOTE: wait for break of the WEDGE .
Best regards CobraVanguard.💚

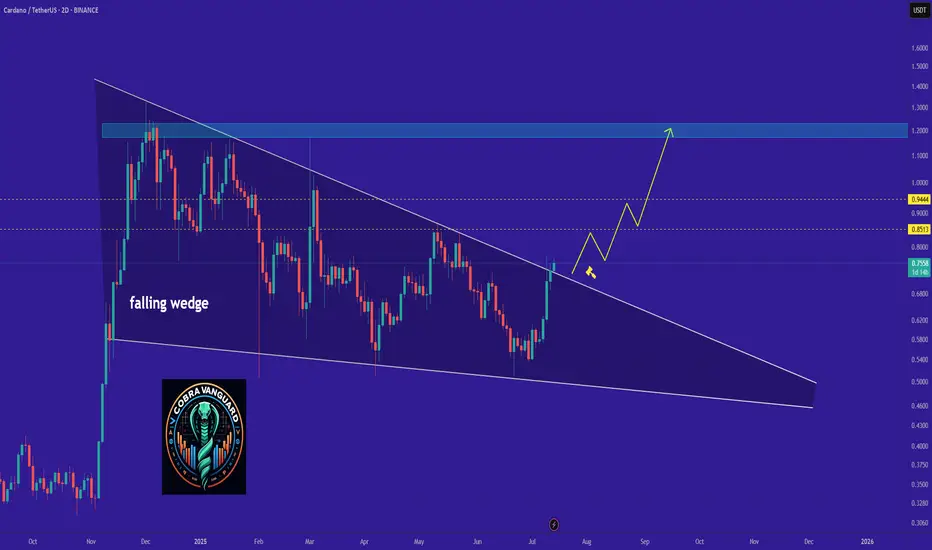
ADA - Time to buy again!The price has broken the wedge pattern, which means it can easily reach its previous high or even go higher.
Best regards CobraVanguard.💚
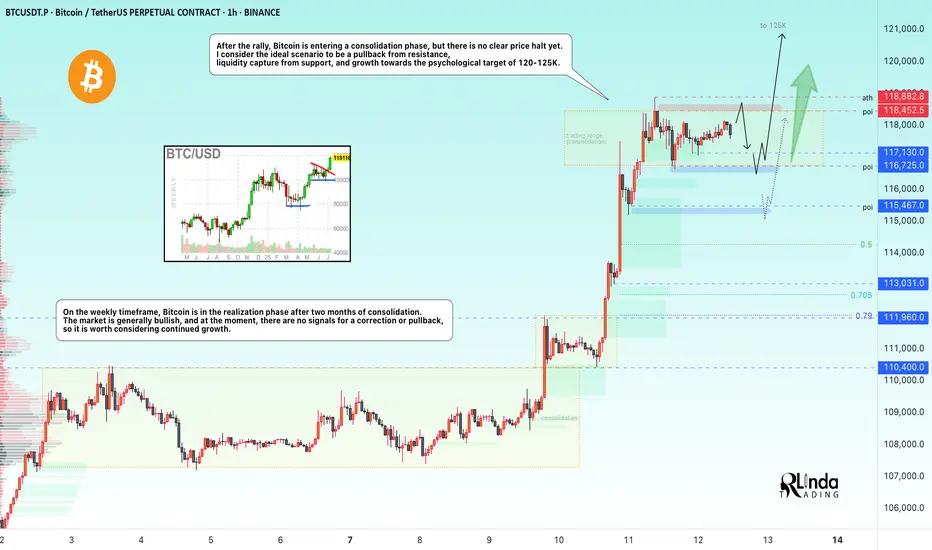
BITCOIN → Stopping after the rally? What next? 125K or 110K?BINANCE:BTCUSDT rose and updated its historical maximum to a new record of 118K with “kopecks” (different prices on different exchanges). Now the price has supposedly stopped and entered a consolidation phase, but it is too early to draw any conclusions based on this alone...
Fundamentally, Bitcoin rose following the SP500 and NQ100 indices. The reasons are clearly geopolitical. The correlation level is not high, but the flagship is following the stock indices, which are also updating their historical highs.
Technically, Bitcoin has emerged from a two-month consolidation and entered a realization phase. So what's next? Continuation of the phase or correction? Let's take a look.
On the daily chart, I would highlight two zones. The risk and sell zone is below 117,500. If the price closes below this zone today/tomorrow, we will most likely be able to look for signals for a possible correction. As part of the correction, we can expect a decline to 115,500, 114,300, or even to the old ATH of 112K.
The second zone is the buying zone. A closing price above 118,400–118,900 and consolidation with the gradual formation of a breakout of structure may hint at a possible continuation of growth toward psychological targets.
Resistance levels: 118,400, 118900
Support levels: 117100, 116700, 115500
In the chart above, I have highlighted the situations, levels, and zones that interest me more precisely.
Now I am waiting for Bitcoin to retest resistance or support and confirm certain levels, based on which decisions can be made. I think that in the near future, Bitcoin will show us where it is headed. Updates will be published as something interesting emerges...
Best regards, R. Linda!
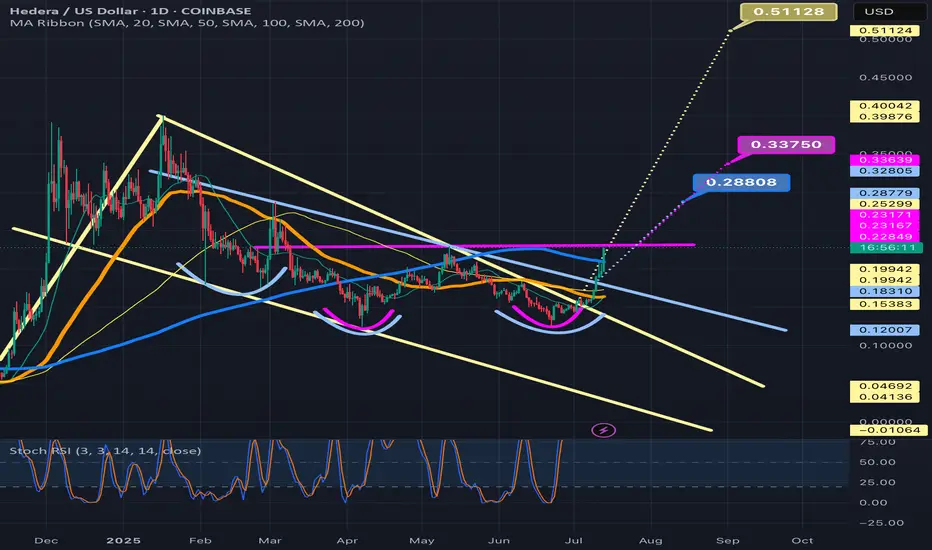
A linear Chart version of the current HBAR bull patternsIt just dawned on me that I had my chart on logarithmic for the previous 2 posts I amde about HBARUSD. As usual, the chart patterns on the log chart tend to have much higher breakout targets than the version of the chart patterns that appear on the linear chart. As soon as I realized this I went back in and adjusted the patterns to their linear chart erosions. The inverse head and shoulders remained mostly the same but the bullflag/desceding channel has now morphed into a falling wedge/bullish pennant. As you can see the breakout target for all 3 patterns is a much lower price than what the price targets were on the logarithmic chart. That’s not to say that the logarithmic targets are invalid, I think what will most likely occur Ike usually is both chart’s targets will be validated, it will likely just take much longer for the logarithmic chart’s targets to be reached as is how things usually pan out. *not financial advice*
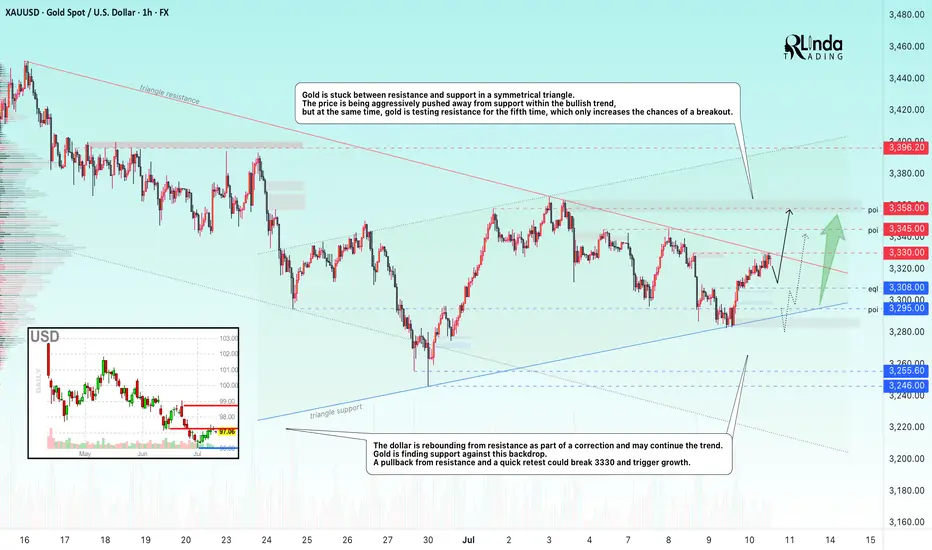
GOLD → Retest of consolidation resistance. Breakout?FX:XAUUSD is consolidating in a symmetrical triangle pattern. The price is stabilizing amid a falling dollar and uncertainty...
Gold is recovering after falling to $3,283 thanks to a weaker dollar and lower bond yields amid concerns over Trump's new tariff threats. The announced tariffs against seven countries, including Brazil and the Philippines, have heightened tensions, partially offsetting the Fed's hawkish signals. Markets are now awaiting new data from the US and speeches by Fed officials, which could influence the further dynamics of gold.
Technically, gold is squeezed between the resistance and support of a symmetrical triangle. The price is being aggressively pushed away from support within a bullish trend, but at the same time, gold is testing resistance for the fifth time, which only increases the chances of a breakout.
Resistance levels: 3330, 3345, 3358
Support levels: 3308, 3295
If gold continues to storm the local resistance at 3330 and the triangle resistance during consolidation, we will have a good chance of catching the breakout and growth. An additional scenario could be growth after a shake-up of the triangle support and the global trend.
Best regards, R. Linda!
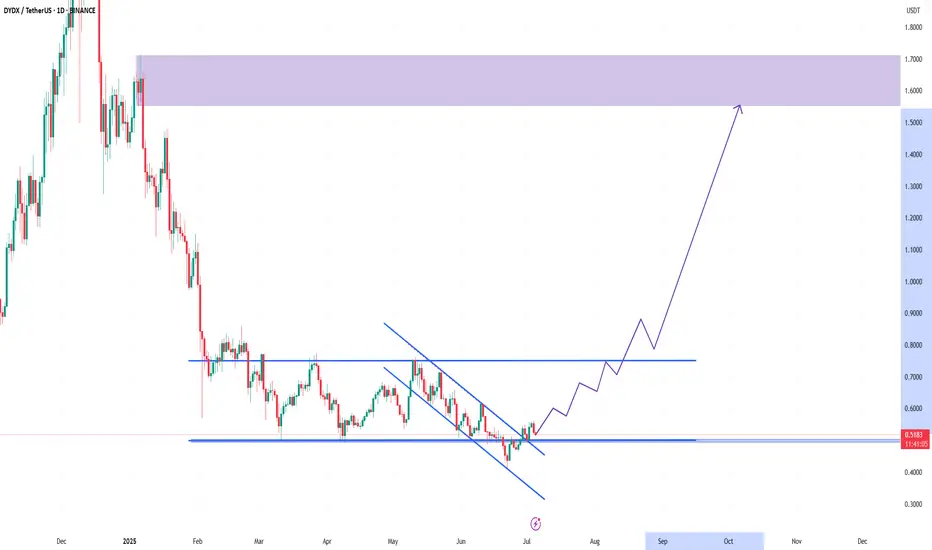
DYDX Breakout from Falling Wedge | Targeting $1.60+# DYDX Breakout from Falling Wedge | Targeting $1.60+
📈 **DYDX/USDT Analysis – Daily Timeframe**
DYDX has just broken out of a falling wedge pattern – a classic bullish reversal formation – after holding a strong support zone around **$0.50**. This zone has acted as a reliable demand area for several months.
---
🔍 **Technical Highlights:**
- ✅ Falling wedge breakout confirmed with daily candle close above resistance
- 🟢 Strong support at $0.50–$0.52
- ⚠️ Horizontal resistance at $0.75 may act as a short-term barrier
- 🚀 Potential rally toward major resistance at **$1.60–$1.70** (target zone)
---
🎯 **Profit Targets:**
- First Target: **$0.75**
- Final Target: **$1.60 – $1.70**
❌ **Invalidation (Stop-loss idea):**
- If price breaks below $0.48 with volume, the bullish scenario may be invalidated.
---
📊 This setup is based on breakout structure and potential trend reversal. If volume confirms, this could be the beginning of a new mid-term uptrend.
💬 Let me know what you think about this setup! Would love to hear your feedback.
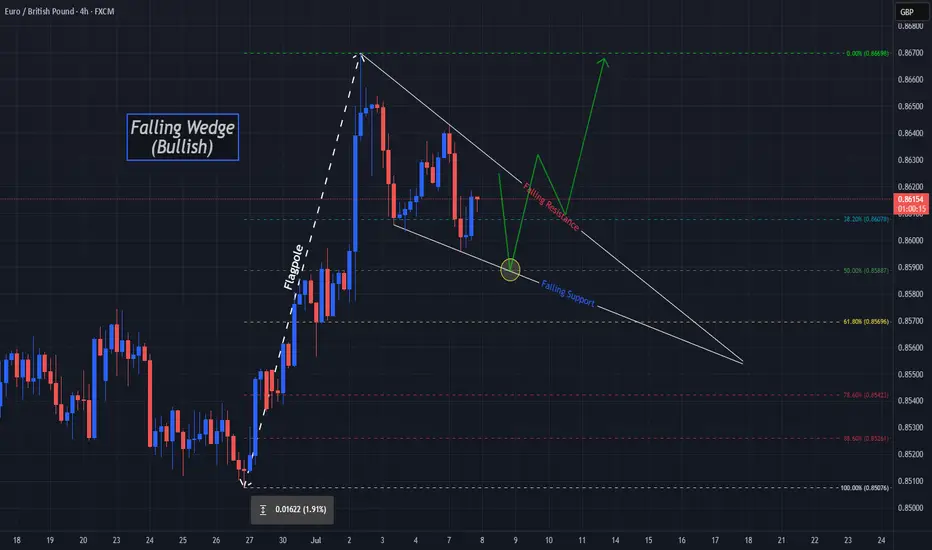
Bulls Could "Wedge" Their Way Into Higher Prices On EGOANDA:EURGBP has made some impressive moves up since the Low from May 29th and Price just fell short of the Highs of April 11th before falling into a very familiar Bullish Pattern, the Falling Wedge!
The Falling Wedge is typically a Bullish Pattern where we expect Price to give us a Bullish Break of the Falling Resistance and Successful Retest of the Break before Price heads Higher!
Wedge Patterns can play both Reversal and Continuation Patterns dependent upon the location they form and surrounding Major Support/Resistance or Highs/Lows. In this case, we will be looking for a Continuation with Price being in an Uptrend before pausing slightly for a Consolidation Phase to form the "Triangle" of the Pattern.
*It is important to note that both the Falling Resistance and Falling Support have only been tested twice where three tests of both Trendlines should point to a strong equilibrium from both Bears and Bulls, validating the legs of the Triangle and strengthening the Consolidation Bias. ( So we could see Price test the Falling Resistance one last time before falling down to the Falling Support for a 3rd test! )
Lastly, when it comes to a Wedge Pattern, we should suspect that once Price makes a 3rd Test of the Falling Support and Retraces to the 50% Fibonacci Level @ .85887, this will signal the End of the Consolidation Phase!
- And this will be the time to enter!
**Once the Pattern is Confirmed and Breakout is Validated, based on the "Flagpole" or Rally prior to Price falling into the Consolidation Phase we can anticipate Price to potentially rise to the most recent High on April 11th of .87374 and give the next Previous High on November 16th 2023 of .87657 a try!
Fundamentally, news is light this week for both currencies in the pair with GDP m/m releasing for GBP on Friday, July 11th with a Forecast of .1%, a .4% increase from June's -.3%
Also, CPI y/y for GBP will be released the following week on Wednesday, July 16th.
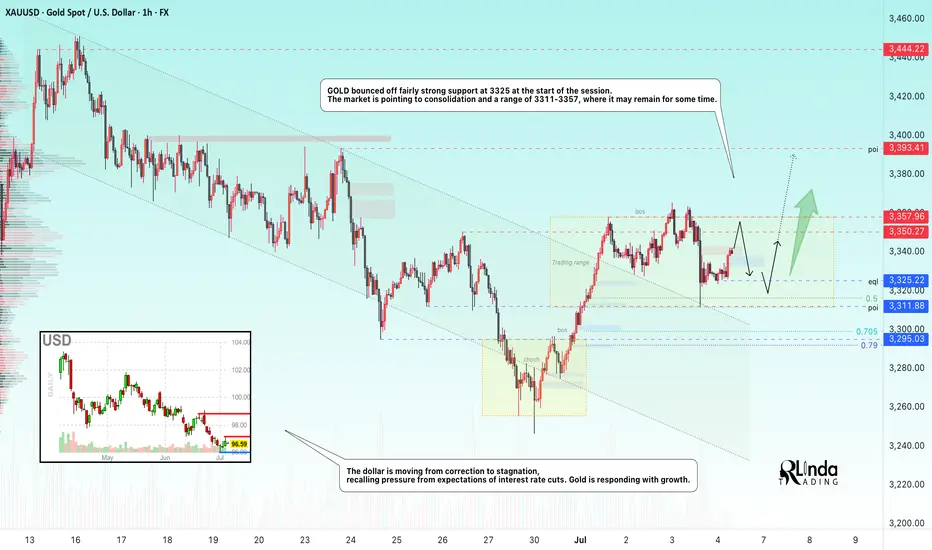
GOLD → Consolidation after a trend break...FX:XAUUSD , after breaking out of a downtrend, is consolidating, which may continue for some time due to Thursday's news and low liquidity on Friday.
Gold stabilized after a correction, but volatility risks remain. After falling from a weekly high of $3,366, gold prices found demand again in Asia on Friday. Strong US employment data cooled expectations of an imminent Fed rate cut, which supported the dollar and limited gold's gains. Additional pressure is coming from the hawkish shift in Fed expectations, but US budget risks and weak liquidity due to the holidays could increase price volatility in the coming days.
Technically, the focus is on the boundaries of the current consolidation at 3311 and 3357. In addition, within the range there is an important level of 3325, which divides the market into bearish and bullish zones...
Resistance levels: 3350, 3357, 3393
Support levels: 3325, 3311
It is important to understand the situation: due to the holiday in the US, liquidity is lower, making it easier to move the price. The rest of the world, interested in gold, can easily push the price up. The trigger will be the zone 3350 - 3350. There is a chance that the market will try to break through the resistance without a pullback and continue to rise to 3393.
However, the most likely scenario is that after yesterday's volatility, gold will remain within 3325 - 3357 before rising next week
Best regards, R. Linda!
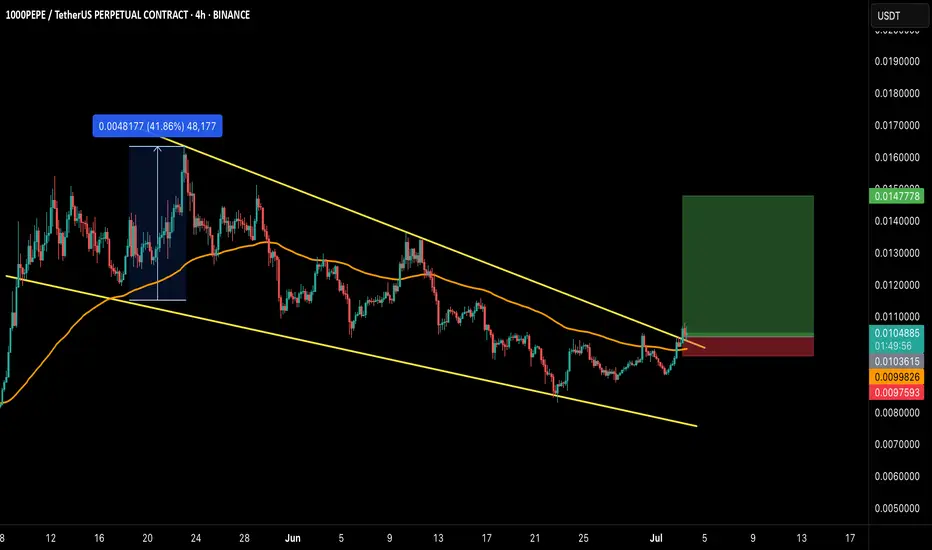
PEPE/USDT – Falling Wedge Breakout!Hey Traders — if you're into high-conviction setups with real momentum, this one’s for you.
CRYPTOCAP:PEPE has finally broken out from the falling wedge structure on the 4H chart after weeks of consolidation. This is a bullish reversal pattern that historically leads to explosive upside moves.
✅ Breakout Confirmed
✅ Above the 100 EMA
✅ Volume picking up post-breakout
🎯 Targets:
$0.0115/0.0126 / 0.0138 / 0.0147+
🛑 Stop Loss: 0.00975
⚡ Leverage: 5x-10x max (Scalp/Short-term swing)
If momentum sustains, we might see 40%+ move.
Let’s ride the wave. Stay sharp!
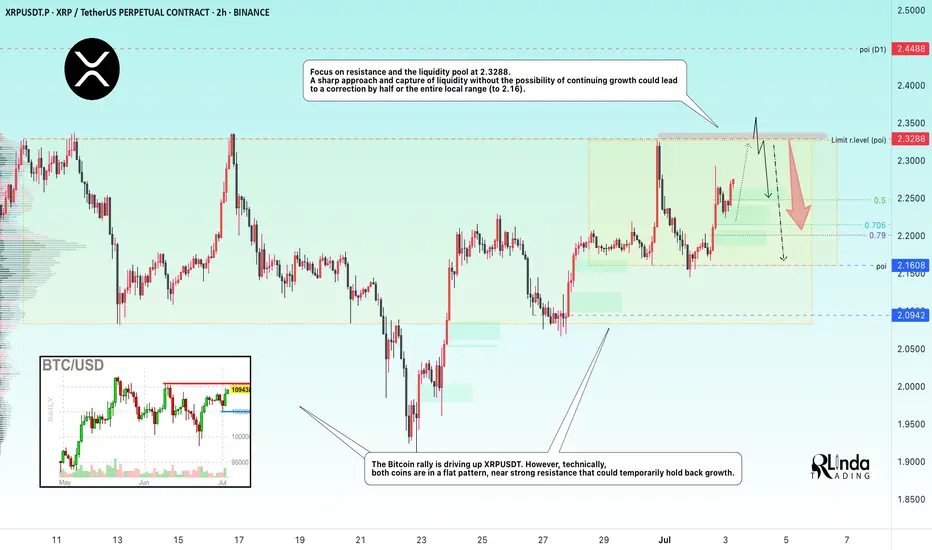
XRPUSDT → Resistance retest. Coin inside the flatBINANCE:XRPUSDT is rising towards resistance at 2.3288 due to a shift in the fundamental background to positive and a rally in Bitcoin, but there is always a but...
On the daily chart, XRP is trading below strong trend resistance, and there is also a fairly strong and voluminous liquidity pool at 2.3300 ahead, which could provide strong resistance. Bitcoin is also approaching its critical level of 110500, which may temporarily hold back growth, and a correction in the flagship could trigger a correction in the rest of the market...
Focus on resistance and the liquidity pool at 2.3288. A sharp approach and capture of liquidity without the possibility of continuing growth could lead to a correction by half or the entire local range (to 2.16).
Resistance levels: 2.3288, 2.357, 2.45
Support levels: 2.25, 2.213, 2.16
If the retest of resistance at 2.3288 ends in a false breakout, then subsequent consolidation below the level could trigger a correction to the above support and interest zones.
Best regards, R. Linda!
AUDCHF AUDCHF is preparing to break through support and fallWeak market structure. Gradually declining lows and no reaction to support at 0.5211. Buyers are trying to keep the price above 0.5211, but under market pressure their strength is weakening.
Relative to 0.5211, we see the formation of consolidation, which is of a “pre-breakdown” nature.
Accordingly, a break below the 0.5211 support level could trigger the activation of buyers' SL orders, leading to liquidation and a downward price distribution.
Potential targets include 0.518 and 0.5164.

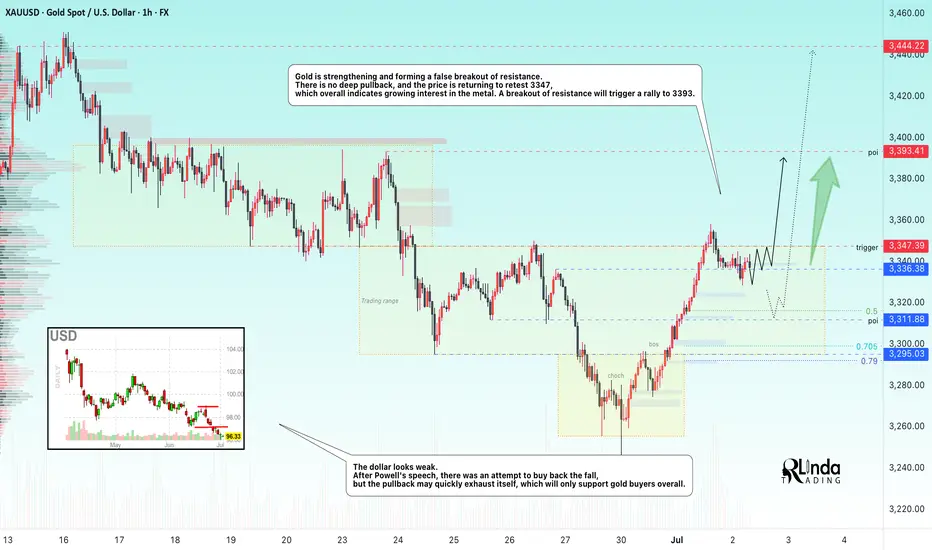
GOLD → Retesting resistance may lead to a breakout.FX:XAUUSD breaks the downward resistance line on the senior timeframe and tests the upper limit of the trading range amid the falling dollar and Powell's speech. The metal may continue its upward movement.
The dollar's rise was short-lived after Fed Chairman Jerome Powell hinted at an imminent interest rate cut, but not in July... The probability of a rate cut in July fell to 22%, and in September to 72%.
Markets are awaiting fresh employment data (ADP and Nonfarm Payrolls), which could influence the prospects for rate cuts. Weak reports could revive interest in gold, but for now, the asset remains under pressure due to the short-term strengthening of the dollar and uncertainty surrounding Fed policy.
Technically, if the pre-breakout structure remains intact and gold continues to attack resistance within the local range of 3347-3330 (3335), the chances of further growth will be high...
Resistance levels: 3347, 3358
Support levels: 3336, 3316, 3311
The global trend is upward, and locally, the price is also returning to growth. If the bulls can maintain the current trend, break through the resistance at 3347, and hold their ground above this level, then the next target will be 3390-3400. I do not rule out a correction to 3325, 3316 (liquidity hunt) before the growth continues.
Best regards, R. Linda!
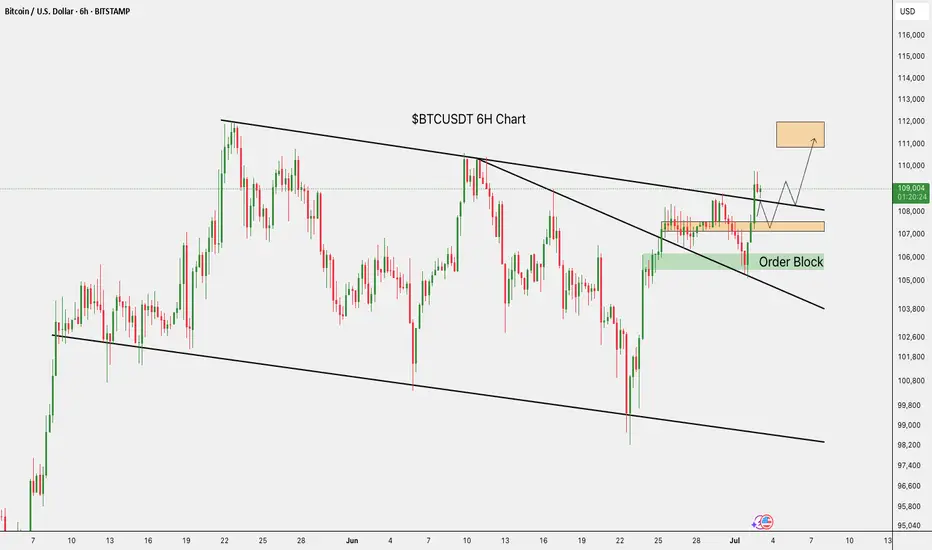
$BTC/USDT 6H Update BTC has broken out and is now retesting the breakout zone.
If this level holds, we could see a push toward $111K–$112K.
Key support remains around $108K.
DYRO, NFA
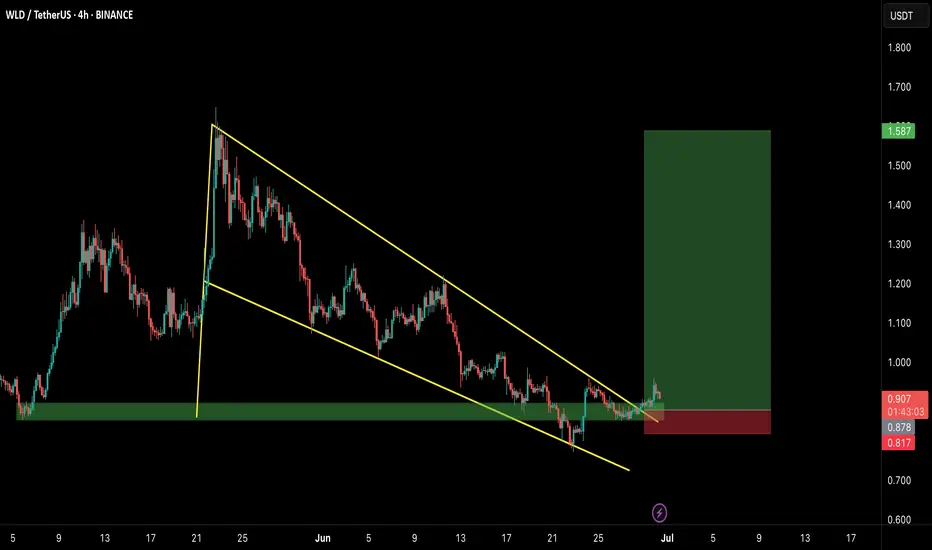
WLDUSDT – Bullish Setup Unfolding!Hey Traders — if you're into high-conviction setups with real momentum, this one’s for you.
WLD is breaking out from a well-defined falling wedge pattern on the 4H chart — a classic bullish structure. Currently retesting the breakout zone while holding the green demand box like a champ. 📈
💥 Entry Zone:
$0.87 – $0.91 (accumulate inside the green box)
🎯 Targets:
• $1.08
• $1.28
• $1.45
• $1.58
🛑 Stop Loss:
$0.81 (below the wedge + demand zone)
Looks poised for a strong move. As always, use proper risk management and watch for volume confirmation.
Let’s see how this plays out — bullish structure, solid risk-reward!
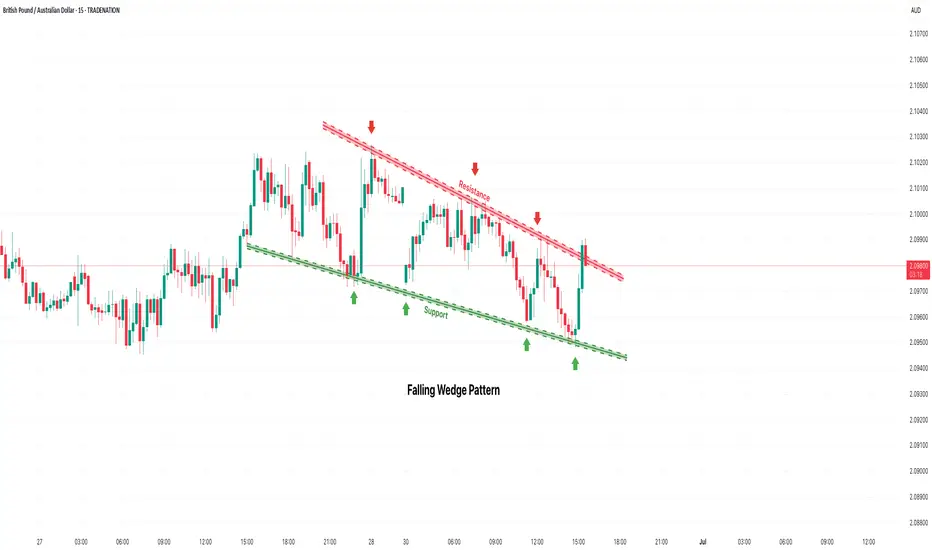
GBP/AUD Falling Wedge Pattern – Reversal or Breakdown?The GBP/AUD pair is currently trading inside a well-defined falling channel on the 15-minute timeframe. The price has been making lower highs and lower lows, respecting both the descending resistance and support trendlines. This setup suggests a short-term bearish structure, but the most recent bounce from the lower boundary raises the possibility of a bullish reversal from support.
🔁 Key Technical Levels
Resistance Zone: Around 2.0995–2.1005 (top of the channel)
Support Zone: Around 2.0930–2.0940 (bottom of the channel)
🔼 Bullish Reversal Scenario
The pair recently bounced strongly from the support zone, indicating buying interest near the channel bottom. If the price breaks above the descending resistance line with a strong bullish candle and follow-through, it would suggest a breakout from the falling channel. That could open upside potential toward 2.1020–2.1050, especially if volume supports the move.
🔽 Bearish Continuation Scenario
If the resistance holds and price starts to fall again, the pair could continue the downward structure, retesting the 2.0940–2.0930 support. A breakdown below that level would confirm a bearish continuation with possible targets near 2.0900 or lower.
🎯 Trade Plan Outline
Buy Setup:
Entry: On confirmed breakout above resistance (~2.1005)
SL: Below 2.0980
TP: 2.1030 / 2.1050
Sell Setup:
Entry: On rejection at resistance or confirmed breakdown below 2.0930
SL: Above 2.1000
TP: 2.0910 / 2.0885
=================================================================
Disclosure: I am part of Trade Nation's Influencer program and receive a monthly fee for using their TradingView charts in my analysis.
=================================================================
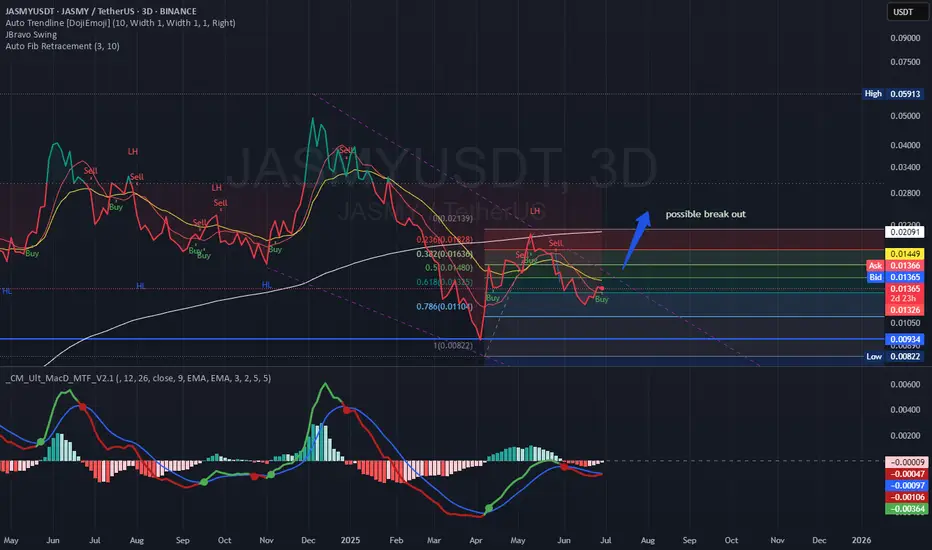
$Jasmy Possible falling wedge breakout This falling wedge pattern shows up in the 3day interval. The 4hr and other popular time intervals had bad news patterns on the hourly, an ascending wedge with downside breakout.
I guess we can wait and see ;)
thanks again,