JTO Approaching Breakout Point – Watch This Wedge!🚀 JTO Falling wedge Formation – 100%+ Potential Incoming?! 👀🔥
Hey Traders! If you're all about high-conviction plays and real alpha, smash that 👍 and tap Follow for more setups that actually deliver! 💹💯
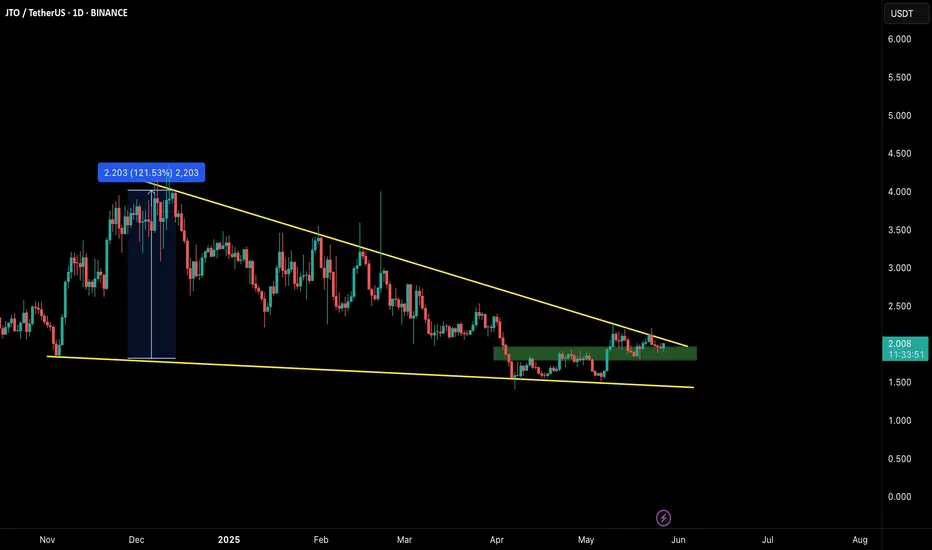
JTO has been consolidating within a falling wedge on the daily timeframe for months and is now approaching the apex of the structure.
The price has shown strong demand around the $1.85–$2.00 support zone and is now attempting to push above the wedge resistance trendline.
Technical Highlights:
Falling wedge formation, typically a bullish pattern
Support holding firm at the $2.00 psychological level
Potential for a breakout retest and continuation if volume confirms
Trade Setup
Entry: CMP and add more in the green box(up to $1.8)
Targets: $2.48 / $2.84 / $3.30
Stop Loss: Below $1.85
Risk-to-Reward: Well-structured setup with defined invalidation
A confirmed breakout from this structure could open the door for a strong upside move. Keep an eye on volume and market momentum for confirmation.
What do you think about this? Share your views in the comment section.
Falling Wedge
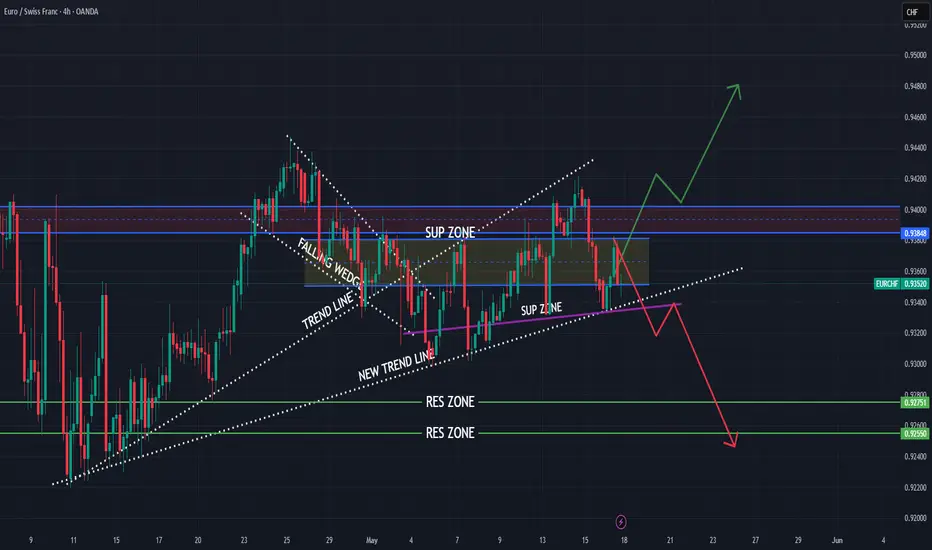
EURCHF both scenarios possibles
OANDA:EURCHF UPDATE from first analysis (attached) we are have upside - downside moves, new trend line is created, sup zone is created (violet line) and we can see also long zone.
If we see break of 0.94000 we will be higly possible in bullish move, break of sup zone (violet line) we will can see bearish move.
Currently still giving higher chances for bearish trend, but lets see some stronger moves.
SUP zone: 0.93850
RES zone: 0.92750, 0.92550
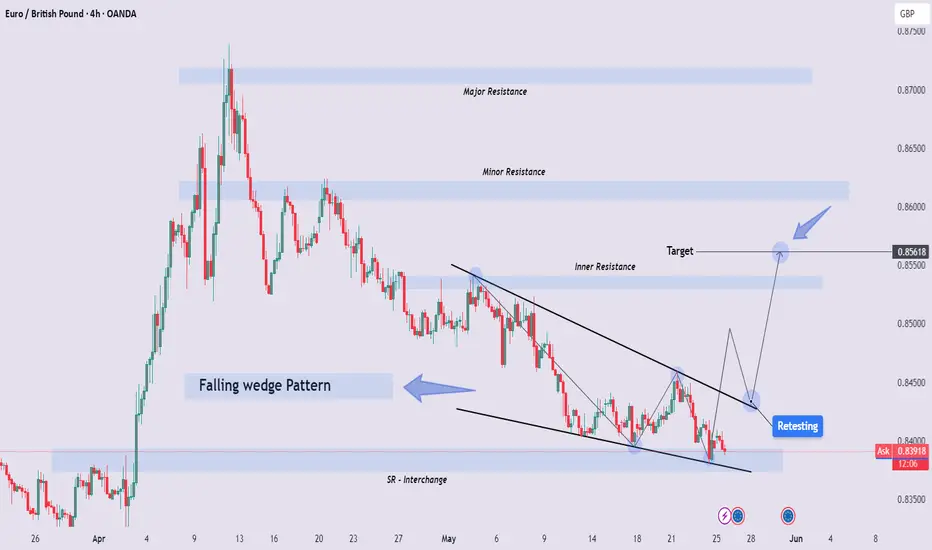
EUR/GBP Bullish Breakout Forming – Falling Wedge & Retest SetupEUR/GBP has been in a prolonged downtrend over the past several weeks, characterized by lower highs and lower lows. However, the recent price action shows signs of exhaustion in selling pressure, as the candles begin to compress into a Falling Wedge pattern — a classic bullish reversal formation.
The wedge is defined by two descending, converging trendlines. As price moves closer to the apex of this wedge, volatility contracts and volume typically dries up (not shown here, but conceptually expected). This signals that market participants are preparing for a directional breakout, most likely to the upside in this context.
🔍 Key Technical Elements:
🔸 1. Falling Wedge Pattern:
The Falling Wedge is a bullish setup that forms during a downtrend and signals a potential reversal when confirmed. Price here has followed a steady decline, but the slowing momentum and structure of the wedge suggest the sellers are losing control.
The wedge acts as a compression zone, where bearish moves are becoming less impactful.
Price touches both upper and lower wedge boundaries multiple times, increasing pattern validity.
A breakout has already occurred, and the pair is now undergoing a textbook retest of the broken wedge resistance (now acting as support).
🔸 2. Retest at Key Support Zone (SR Interchange):
The retest is happening precisely at a former support/resistance flip zone, labeled SR – Interchange on the chart. This is a historically significant area where price has reacted multiple times, adding confluence to the setup.
If this level holds during the retest, it may invite strong buying interest, fueling the bullish breakout move.
🔸 3. Resistance Zones & Targets:
Inner Resistance (~0.8460): First hurdle for bulls; breaching this will signal strong momentum.
Minor Resistance (~0.85618): This is the primary target of the setup, based on previous structure and wedge height projection.
Major Resistance (~0.8740): A longer-term bullish objective if momentum sustains beyond the first two targets.
These zones serve as logical areas for profit-taking and reassessment.
📐 Measured Move & Target Projection:
The projected breakout target of 0.85618 is derived using a combination of:
The vertical height of the wedge at its thickest point.
Previous market structure resistance zones.
Fibonacci and price symmetry (if analyzed further).
This target also aligns with a previous supply zone, making it a strong magnet for price if bullish momentum kicks in.
💡 Trading Plan (Not Financial Advice):
This setup provides a good risk-to-reward opportunity if executed with patience and proper confirmation:
Entry Zone: After bullish confirmation at the retest (e.g., bullish engulfing candle, pin bar, or break of minor lower high).
Stop Loss: Below the SR Interchange zone or recent swing low (~0.8350–0.8360).
Target 1: Inner Resistance (~0.8460)
Target 2: Minor Resistance (~0.85618)
Target 3 (extended): Major Resistance (~0.8740)
🔄 Market Psychology:
This chart setup reflects a shift in momentum and sentiment:
Sellers have driven the price down consistently but have failed to create new significant lows with force.
Buyers are stepping in at key demand zones, creating higher lows within the wedge.
The breakout suggests smart money accumulation, and the current retest offers one of the last low-risk entries before a broader move.
🔔 Confirmation to Watch:
Bullish reversal candlestick patterns at the retest zone.
Break above local lower highs near 0.8440–0.8460.
Momentum indicators (if used) showing divergence or crossover confirmation.
📉 Bias:
Short-Term Bullish
Valid if support at 0.8390–0.8400 holds and price confirms breakout continuation.
🧠 Minds Post (Expanded Explanation)
Title: EUR/GBP Bullish Reversal Developing – Falling Wedge Breakout Retest
EUR/GBP has broken out of a textbook falling wedge on the 4H chart, which often signals the end of a downtrend and beginning of a new bullish phase. The price is currently pulling back, testing the breakout zone — a crucial step in confirming the validity of the breakout.
If this retest holds, we may see a sharp move toward the 0.8460 and 0.8560 levels — both key resistances based on past price action.
This pattern reflects a deeper market psychology shift — from consistent bearish dominance to a potential bullish takeover. Smart money may already be positioning here.
I’m watching for confirmation at the support zone around 0.8390. If price holds and breaks above local highs, a continuation toward the upper resistance is likely.
Let the market come to you. Don’t chase. Wait for structure, then trade with confidence.
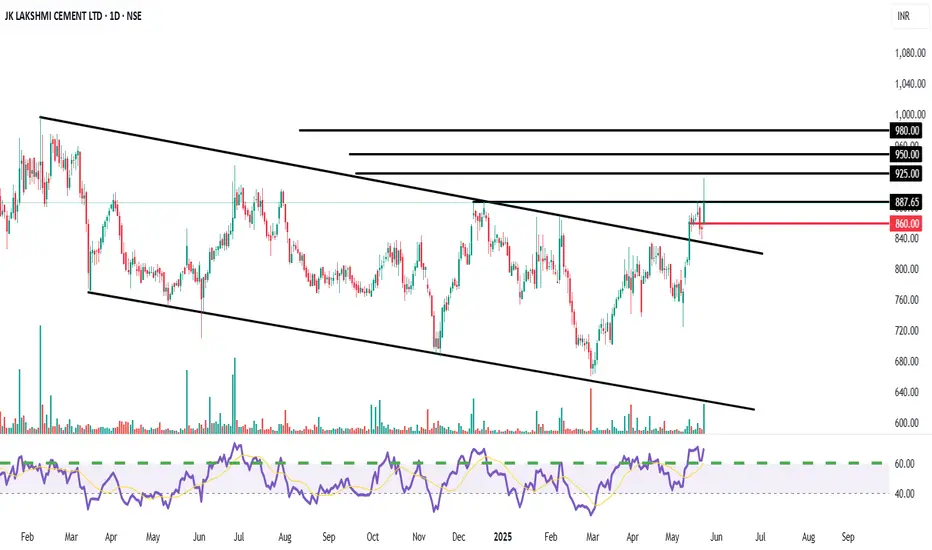
Potential Breakout from a Symmetrical Triangl Descending ChannelEntry Zone: We recommend initiating a BUY position in JK Lakshmi Cement around the current levels, ideally between ₹880 - ₹890. This considers the strong closing above the resistance trendline.
Target 1 (T1): ₹925
Target 2 (T2): ₹950
Target 3 (T3): ₹980 (If momentum sustains above T2)
Stop Loss (SL): ₹860 (Strictly on a closing basis)
Channel Breakout: The stock has decisively broken out of a multi-month descending channel/symmetrical triangle pattern, indicating a potential strong reversal from a corrective phase. This breakout appears to be supported by a noticeable pickup in volumes.
Key Resistance Breach: The stock has also managed to close above a significant horizontal resistance level around ₹880-885, which has acted as a hurdle multiple times in the past. A sustained move above this level confirms bullish intent.
RSI Strength: The Relative Strength Index (RSI) is showing strength, trading well above the 50-mark and moving towards the overbought zone, confirming increasing buying momentum.
Positive Price Action: The overall structure suggests accumulation at lower levels, and the current breakout could initiate the next leg of the uptrend.
Favorable Risk-Reward: The setup offers a compelling risk-reward profile for a short-term trade, with significant upside potential compared to the defined stop-loss.
Key Risk: A failure to sustain above the ₹880 level or a close below the ₹860 stop-loss would invalidate the bullish view and could lead to renewed selling pressure.
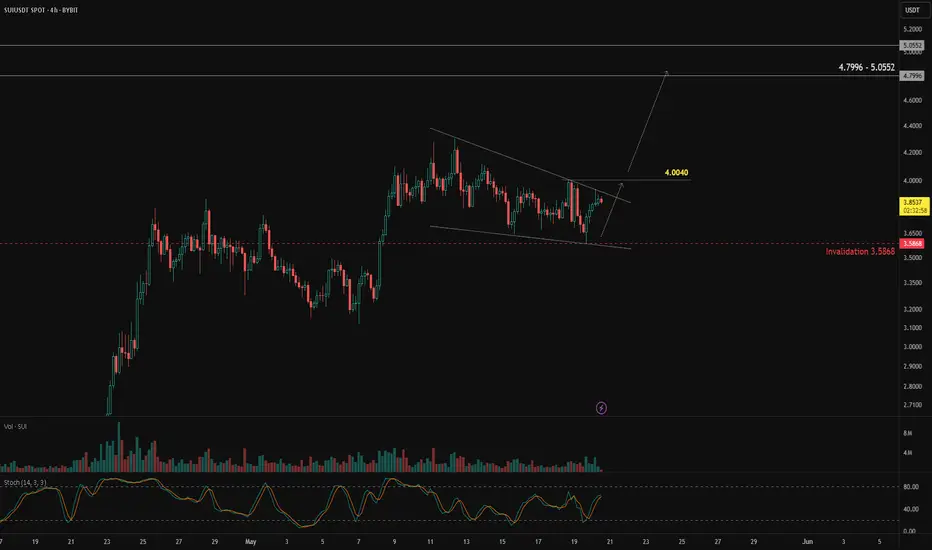
Coiling for a Breakout – Watch This LevelAfter a strong upward move, BYBIT:SUIUSDT is currently consolidating in a sideways range, forming what appears to be a falling wedge pattern — a classic bullish continuation setup.
If this pattern plays out, there's a good chance the price will resume its uptrend, supported by a bullish divergence forming within the wedge. The key level to watch is the resistance at 4.0040. A clean breakout above this level should be backed by strong momentum. However, if the price breaks above but quickly drops back below 4.0040, it could signal a lack of buying pressure — increasing the risk of a failed breakout.
This bullish scenario remains valid as long as the price holds above 3.5868. The next potential upside targets are 4.7996 and 5.0552.
Keep an eye out for a high-volume breakout and a strong candle close above 4.0040 to confirm the move.
What’s your take on BINANCE:SUIUSDT ?
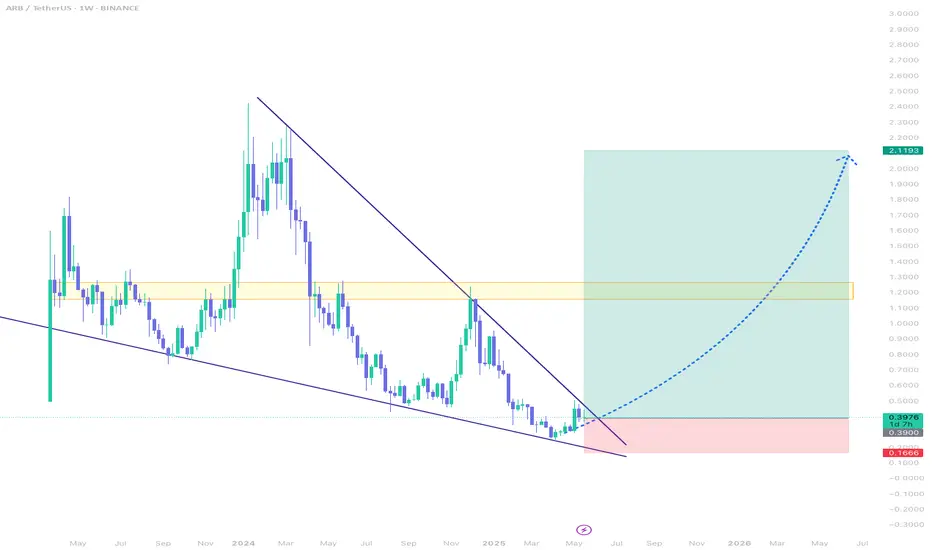
ARB - Beautiful Falling Wedge Pattern---------------------------------------------------------------
Description
---------------------------------------------------------------
+ Perfect falling wedge pattern has formed for ARB, a clear breakout from this falling wedge pattern is imminent.
+ breakout from this falling wedge pattern could push the price to previous All time high.
---------------------------------------------------------------
VectorAlgo Trade Details
------------------------------
Entry Price: 0.39
Stop Loss: 0.16
------------------------------
Target 1: 0.6229
Target 2: 0.9196
Target 3: 1.1430
Target 4: 1.6343
Target 5: 2.1129
------------------------------
Timeframe: 1W
Capital: 1-2% of trading capital
Leverage: 5-10x
---------------------------------------------------------------
Enhance, Trade, Grow
---------------------------------------------------------------
Agree or Disagree with the ideas ? lets discuss in the comments.
Like and follow us for more ideas.
Best Regards,
VectorAlgo
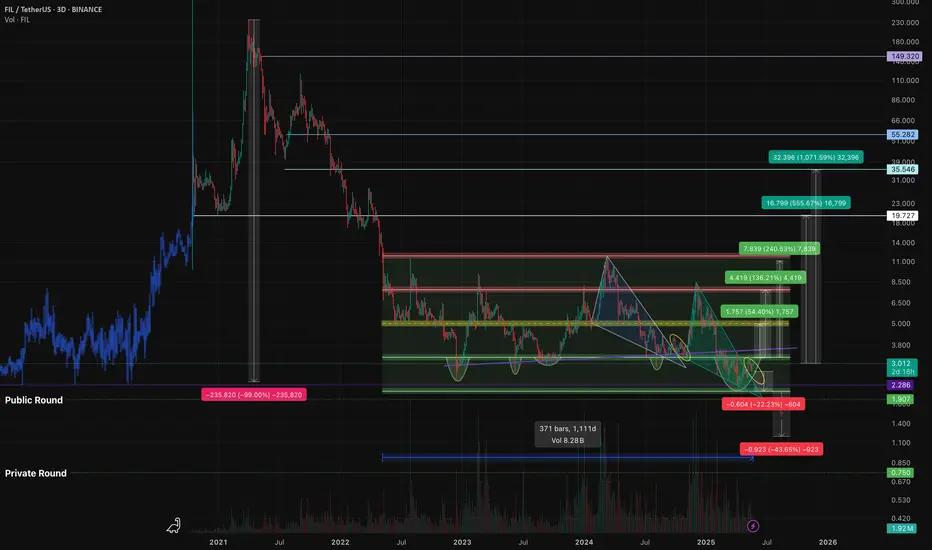
FILUSDT — the formation is repeating, the structure is familiar.Filecoin(FIL) - is a decentralized storage system with the goal of "storing humanity's most important information." During its initial coin offering (ICO) in 2017, the project raised $205 million. The launch was initially planned for mid-2019, but the mainnet launch date was postponed until block 148,888, which occurred on October 15, 2020.
📍 CoinMarketCap : #50
📍 Twitter(X) : 667.3K
🔍 What I observe:
I’ve added the full trading history to the chart for better understanding (the chart on exchanges is cut off). The coin is liquid. I also added the prices for the public and private offerings.
There’s a large horizontal channel, or more specifically, a channel within a channel, which has been active for about 1111 days.
After another drop, a descending wedge formed, and now we are witnessing a breakout of its resistance (a retest is possible).
These patterns are ones I regularly track and trade, based on personal experience accumulated over the years and my strategy.
📊 I’ve plotted the nearest resistances and target prices with movement percentage calculations.
💭 It’s quite possible that this formation in the lower part of the wedge, coinciding with the area of lows on the support of the outer channel, was used to gather liquidity and shake out weak hands.
I also want to point out the large wicks in this zone - a characteristic pattern for accumulation points and subsequent reversals.
______
📌 Not financial advice. Observing structure and recurring phases.
Operate within your strategy and with an awareness of risks.
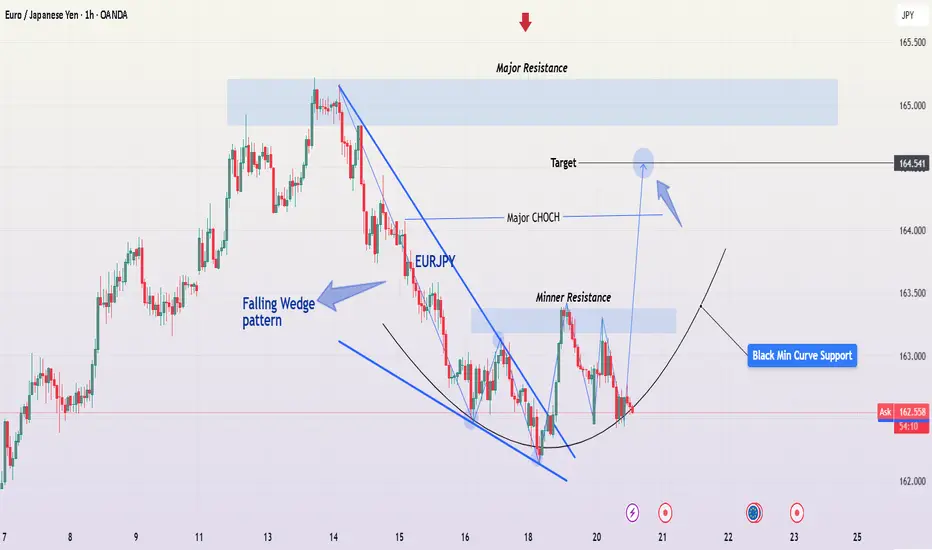
EUR/JPY 1H: Bullish Falling Wedge Breakout + Target 🧠 Overview of the Setup
The EUR/JPY currency pair has recently completed a Falling Wedge pattern, a classic and powerful bullish reversal formation. This chart structure typically signals the end of a downtrend and the potential beginning of a strong upward impulse.
In this setup, multiple confluences point toward a bullish move, including pattern breakout, structure shift, retest of a dynamic support level, and alignment with major supply/resistance zones.
🔍 Pattern Analysis: Falling Wedge
Definition: A falling wedge is a technical pattern formed by two downward-sloping trendlines — one representing resistance and the other support — that converge. It signals a slowdown in bearish momentum, often preceding a bullish reversal.
Chart Observation: The wedge is well-defined, spanning several trading sessions. As price action tightened toward the apex, bearish momentum began to weaken.
Breakout Trigger: Price broke convincingly above the upper wedge boundary, suggesting the start of a bullish reversal.
✅ Implication: The breakout confirms that buyers have taken control, especially as this move is supported by a structural Change of Character (CHOCH).
📈 Price Action Structure & Key Zones
1. Minor Resistance (Broken)
After the breakout, price encountered a minor resistance zone just above the wedge. This area is now likely to flip into support (a classic breakout retest).
2. Major CHOCH (Change of Character)
A CHOCH indicates a break in market structure — from lower highs and lower lows to higher highs and higher lows.
The break above this level confirms a shift from bearish to bullish sentiment.
3. Curved Support (Black Min Curve)
A rising curved trendline has formed below current price, acting as a parabolic support structure.
This suggests not just a trend reversal, but increasing bullish momentum, as buyers step in at higher levels with each correction.
4. Major Resistance Zone (Target Area)
Price Target: ~164.50 – 165.50
This zone has historically acted as strong supply and is marked for potential take-profit or observation for reversal signals.
The target is derived from both horizontal resistance and the projected height of the wedge pattern.
🎯 Trading Strategy
Component Details
Entry Zone 162.50 – 162.60 (retest of minor resistance + curve support)
Stop Loss Below 162.00 (beneath wedge and curve)
Take Profit 164.50 – 165.50 (major resistance)
Risk/Reward Approx. 1:2.5 to 1:3
🔸 Conservative Entry: Wait for bullish confirmation (bullish engulfing candle or pin bar) on the support retest.
🔸 Aggressive Entry: Market buy after confirmation of curve bounce or on lower timeframe bullish signals.
📊 Volume & Momentum Consideration
Although volume isn’t shown on this chart, volume confirmation on the breakout would significantly strengthen the bullish bias. Look for:
Increasing buy volume on breakout
Lower sell volume on pullbacks
Bullish divergence (if using RSI or MACD)
⚠️ Risk Management & Event Awareness
Be cautious of unexpected JPY-related economic releases (e.g., BOJ announcements, inflation data) that may cause volatility.
If the curved support is broken decisively, this could invalidate the setup, suggesting further consolidation or downside risk.
🧠 Psychological Perspective
The Falling Wedge reflects a market where sellers are gradually losing control — pushing price lower, but with less conviction. As the wedge tightens, bulls prepare to step in. The breakout confirms that sentiment has shifted, and many traders use such setups as entry points for swing or momentum trades.
The curved support line suggests a transition from accumulation to markup phase, which typically leads to faster price expansion as confidence in the uptrend grows.
✅ Summary
✅ Pattern: Falling Wedge (Bullish)
✅ Breakout: Confirmed with CHOCH
✅ Support: Curve trendline acting as dynamic support
✅ Target: 164.50 – 165.50 major resistance
✅ Bias: Bullish (until curve support is broken)
📣 Final Thoughts
This is a high-probability bullish continuation setup backed by price structure, pattern breakout, and support alignment. The risk is well-defined, and reward potential is strong — making this a favorable setup for swing traders or short-term position traders.
💬 Let me know what you think in the comments — are you going long EUR/JPY?
👍 Like and Follow for more setups and breakdowns.
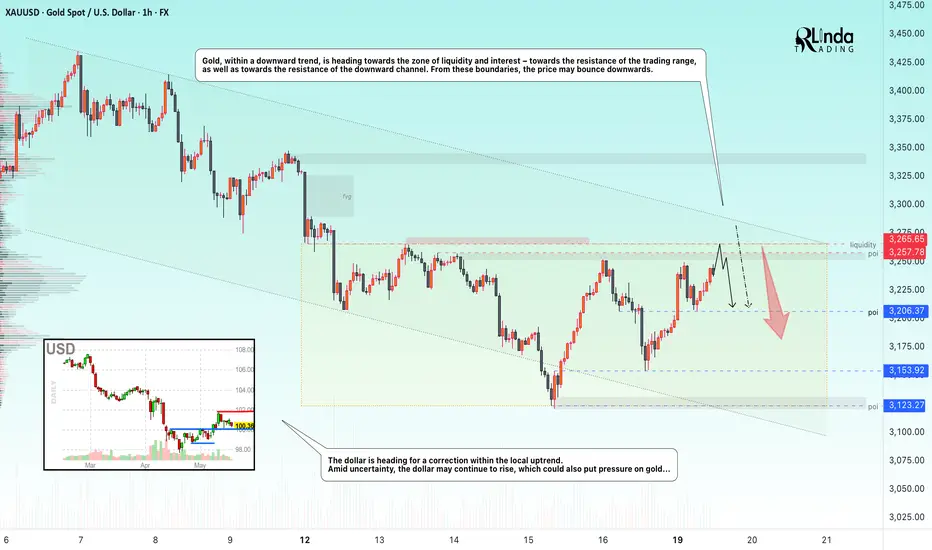
GOLD → Short squeeze before a drop to 3150?FX:XAUUSD is consolidating. The market needs a driver, but due to the unstable fundamental background, traders have switched to a wait-and-see mode. Consolidation could turn into strong movement at any moment. But in which direction?
Gold under pressure: the market is waiting for signals from the Fed and negotiations. The dollar is putting pressure on the market amid expectations of trade negotiations with India, South Korea, and Japan, as well as statements from the Fed.Earlier, the metal was supported by the weak dollar after Moody's downgraded the US credit rating, but growing interest in risky assets and hopes for peace between Russia and Ukraine reduced demand for gold. Key factors — negotiations and comments from the Fed — will continue to influence the dynamics of the dollar and gold.
Technically, the price is in a downtrend and within consolidation. A breakout from consolidation could be accompanied by strong momentum, but I believe that there will be no countertrend movement and that a retest of resistance could end in a decline...
Resistance levels: 3265.5, channel resistance
Support levels: 3206, 3153
The most likely scenario within the bearish trend is a short squeeze and a downward breakdown from the triangle (the fundamental background and economic risks are slowly but surely declining, and gold may lose value). A false breakout of 3250-3265 could trigger a continuation of the trend towards 3150-3120.
Best regards, R. Linda!

PENDLEUSDT → Resistance retest. One step away from distributionBINANCE:PENDLEUSDT is preparing for distribution after a prolonged consolidation. The price is testing a key resistance level, which, if broken, will trigger a rally...
The coin is breaking through the flat resistance and consolidating above the upper border of the range. The key level is 4.400. If the bulls hold their ground above this level, the growth may continue.
Bitcoin is showing bullish dynamics, which supports the altcoin market. The bullish trend may continue in altcoins as well. Pendle may move from consolidation to distribution.
Resistance levels: 4.32, 4.400
Support levels: 4.024, 3.622
If the coin manages to consolidate above the key resistance level, thereby confirming the breakout, the price may move to aggressive growth. In this case, the target could be 4.800.
Best regards, R. Linda!

GOLD → Retest of trend resistance before declineFX:XAUUSD is recovering amid uncertainty, but there is a fairly strong resistance zone ahead that could hold back growth and trigger a decline...
Since the opening of the session, the price has recovered slightly after a week-long decline. Growth is being held back by two-sided risks: on the one hand, pressure on the dollar and Moody's downgrade of the US credit rating are supporting the metal, while on the other hand, high bond yields and possible US trade agreements are limiting growth.
Investors are awaiting new statements from the Fed and are monitoring US negotiations with key partners. Amid concerns about fiscal stability and weak economic data, gold may remain in positive territory, but positive trade news could turn it down again.
Resistance levels: 3257, 3265
Support levels: 3206, 3153
A false breakout of the specified resistance will confirm the inability to continue growth. Consolidation after a false breakout of 3257 - 3265 below 3257 could trigger a reversal and a fall to areas of interest...
Best regards, R. Linda!
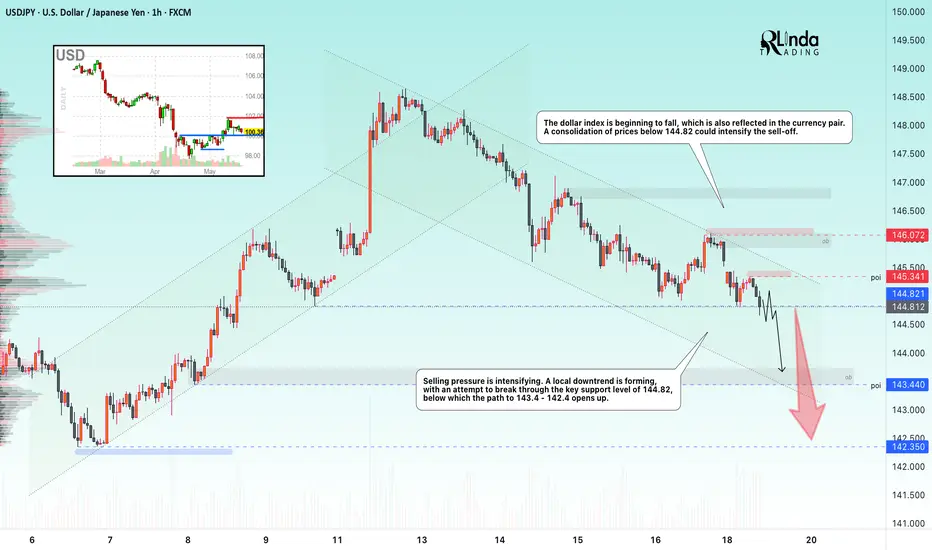
USDJPY → Support retest. Is the trend continuing?FX:USDJPY is storming key support within the local downtrend. Pressure is intensifying the dollar's decline...
The dollar index is beginning to fall, which is also reflected in the currency pair.
Selling pressure is intensifying. A local downtrend is forming, with an attempt to break through key support at 144.82, below which the path to 143.4 - 142 opens up. Consolidation of the price below 144.82 could intensify the sell-off.
Resistance levels: 145.34, 146.07
Support levels: 144.82, 143.44, 142.35
Global and local trends are downward, and the fall of the dollar can only provide additional resistance, which will intensify the sell-off. A break of key support and consolidation of prices below 144.82 will trigger further sell-offs.
Best regards, R. Linda!
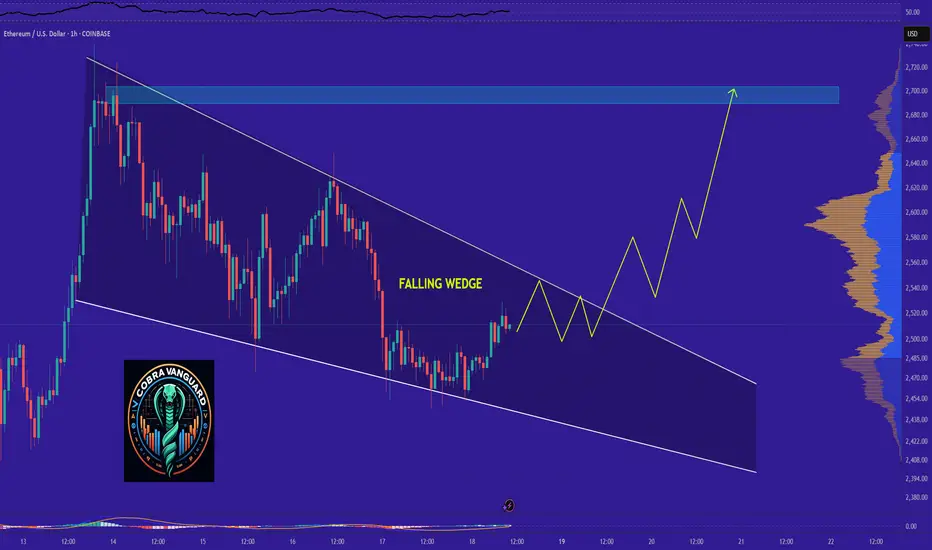
ETH's situation+ Target PredictionThe COINBASE:ETHUSD is in a Bullish phase by a Falling Wedge Pattern.
A falling wedge indicates the potential for price to reach to $2750.
Note if the Wedge Pattern is broken downwards with the strength of Bearish candles , this analysis of ours will be failed.
Give me some energy !!
✨We spend hours finding potential opportunities and writing useful ideas, we would be happy if you support us.
Best regards CobraVanguard.💚
_ _ _ _ __ _ _ _ _ _ _ _ _ _ _ _ _ _ _ _ _ _ _ _ _ _ _ _ _ _ _ _
✅Thank you, and for more ideas, hit ❤️Like❤️ and 🌟Follow🌟!
⚠️Things can change...
The markets are always changing and even with all these signals, the market changes tend to be strong and fast!!
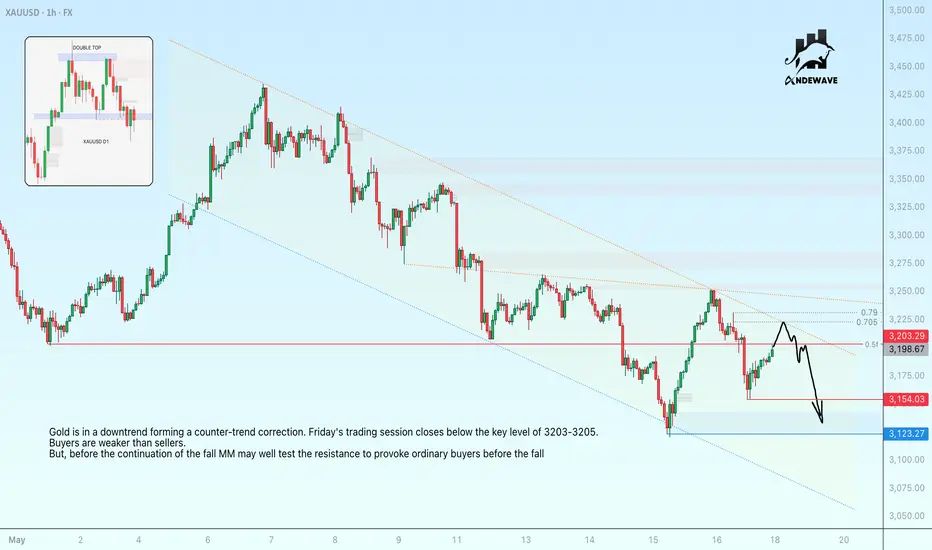
GOLD consolidated below a key level on FridayGold is in a downtrend forming a counter-trend correction. Friday's trading session closes below the key level of 3203-3205. Buyers are weaker than sellers.
But, before the continuation of the fall MM is quite likely to test the resistance to provoke ordinary buyers before the fall
Scenario: the growth attempt may turn out to be false. A retest of 3203 resistance, a false breakout and price consolidation below 3203 is a sell signal.
Additional scenario: MM trap to provoke buyers to buy. A retest of the far resistance 3230, a false breakout and a price fixing below 3223 could start a decline
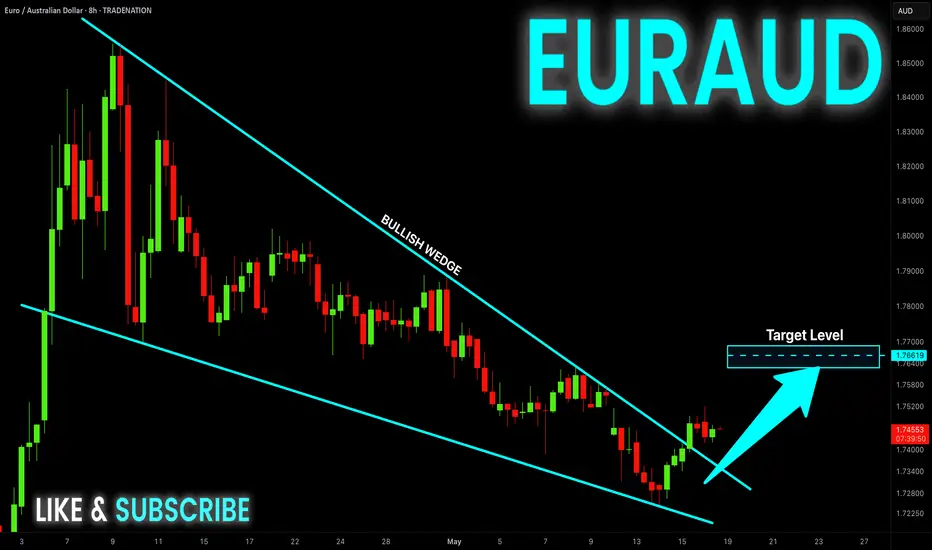
EUR-AUD Bullish Breakout! Buy!
Hello,Traders!
EUR-AUD has formed a bullish
Wedge pattern and now we are
Seeing a bullish breakout which
Is confirmed so we are bullish
Biased and we will be expecting
A further bullish move up
Buy!
Comment and subscribe to help us grow!
Check out other forecasts below too!
Disclosure: I am part of Trade Nation's Influencer program and receive a monthly fee for using their TradingView charts in my analysis.
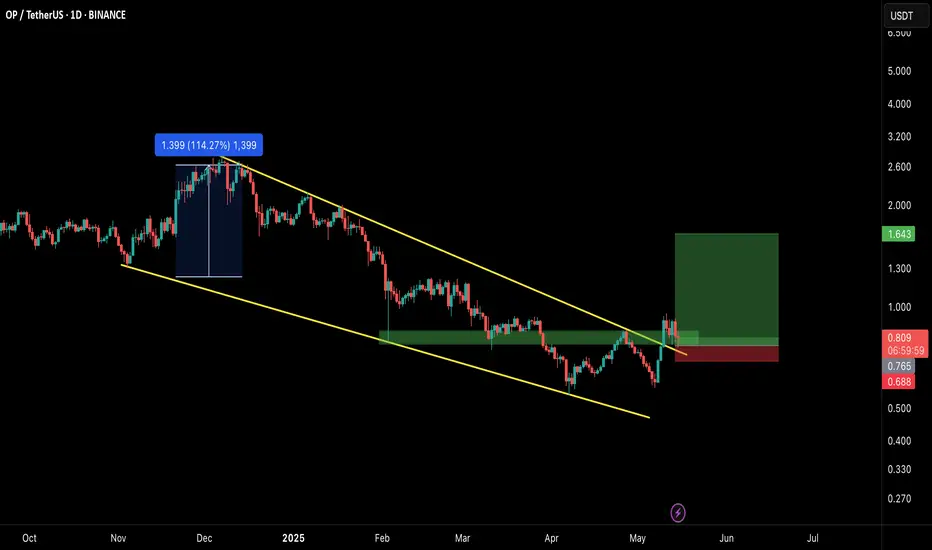
OP/USDT Breakout Alert!!🚀 OP Breakout Alert – 100% Potential Incoming?! 👀🔥
Hey Traders! If you're all about high-conviction plays and real alpha, smash that 👍 and tap Follow for more setups that actually deliver! 💹💯
OP has successfully broken out from the falling wedge pattern on the daily timeframe, which historically signals a strong trend reversal. After retesting the breakout zone, price action looks ready for a fresh upside move!
🔹 Entry: CMP and add more up to $0.76
🎯 Targets:
→ $0.98
→ $1.21
→ $1.43
→ Final Target: $1.64
🛑 SL: $0.688
⚙️ Leverage: Low leverage (Max 5x)
📊 Structure:
Falling wedge breakout ✅
Retest holding strong ✅
Volume starting to pick up 📈
We’re watching closely—this setup has the potential to mimic the last 114% rally. Let's see how it unfolds! 🚀
💬 What’s your take on OP from here?
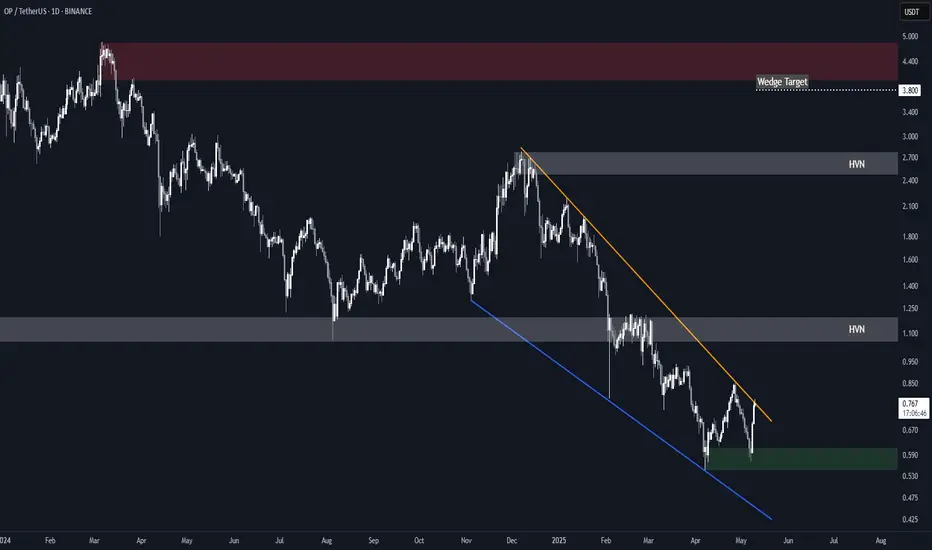
Optimism (OP) Falling WedgeBINANCE:OPUSDT is attempting a breakout from a 14 months long falling wedge.
A sustained break above the resistance in the near term would set the target at $3.80, just shy of the main $4.00-$4.80 supply zone.
Key Levels to Watch
• $0.55-$0.60: Main demand zone and invalidation point for the setup
• $1.00-$1.20: High Volume Node and key S/R dating back to June 2023.*
• $2.50-$2.80: High Volume Node and wedge high point.*
• $4.00-$4.80: Main supply zone.
* These could offer resistance and represent good levels for partial TPs.
SUIUSDT → False breakdown of support before growthBINANCE:SUIUSDT has entered a consolidation phase within a bullish trend. The chart shows a zone of interest and a trigger area that are worth paying attention to...
The coin looks quite positive. An upward trend is forming, which is also supported by the growth of Bitcoin and a relatively positive fundamental background.
Technically, SUI is consolidating between 4.110 and 3.811. Below the support level, a huge liquidity pool has formed, which has not yet been tested. There is a high probability of a false breakdown before the growth continues, but if the market turns out to be more aggressive, buyers may not let the price fall to 3.811, in which case we can consider a breakout of the resistance at 4.11-4.275 and consolidation of the price above these levels with the aim of continuing growth.
Support levels: 3.811, 3.667
Resistance levels: 4.11, 4.275
The movement of Bitcoin shows that the market is gathering liquidity as part of a local correction against the backdrop of a bullish trend. Yesterday, we all witnessed a local liquidation, but there are no reasons for a decline yet. SUI, in an ideal scenario, may test support at 3.811 and form a false breakdown before continuing to grow.
Best regards, R. Linda!

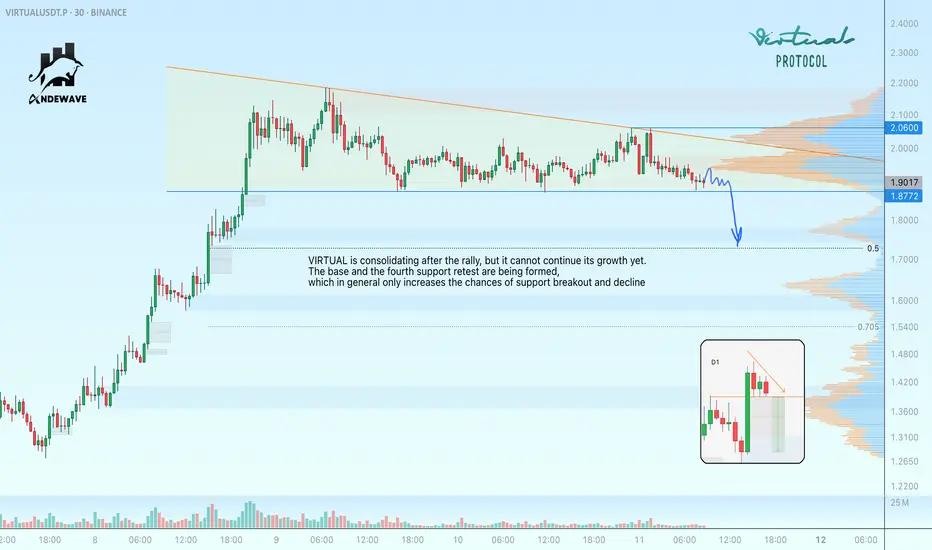
VIRTUALUSDT can derail support with momentumVIRTUAL is consolidating after the rally, but it cannot continue its growth yet. A descending triangle with a clear base support and a fourth retest relative to 1.877 is being formed, which in general only increases the chances of support breakout and decline
Scenario: if the compression of this format (within the descending triangle) continues and the price continues to compress to the support at 1.877, then in this case it will be possible to catch a breakout through a limit order. A sharp impulse is possible. As the first target I will wait for a decline to 0.5 fibo (1.73)
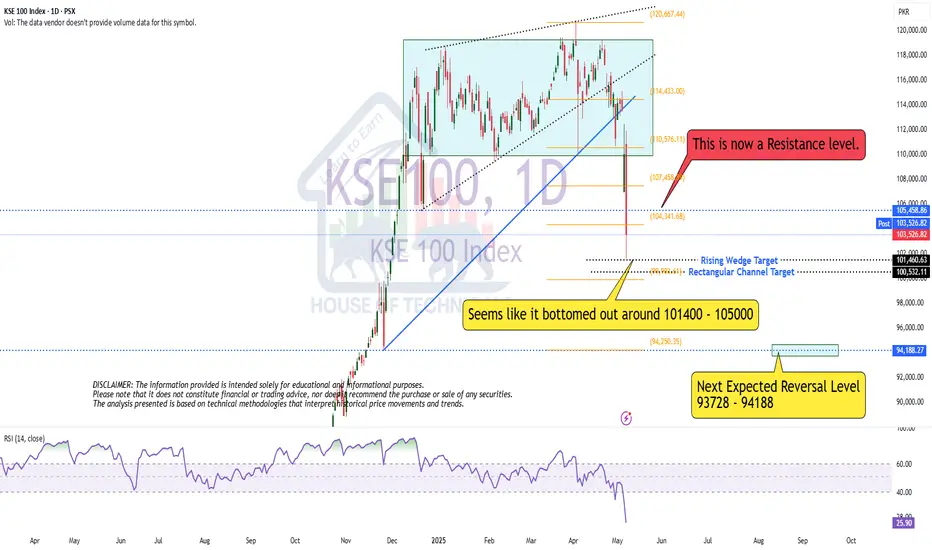
Has it Bottomed Out or Bottom yet to come?Seems like it bottomed out around 101400 - 105000
Next Expected Reversal Level
93728 - 94188
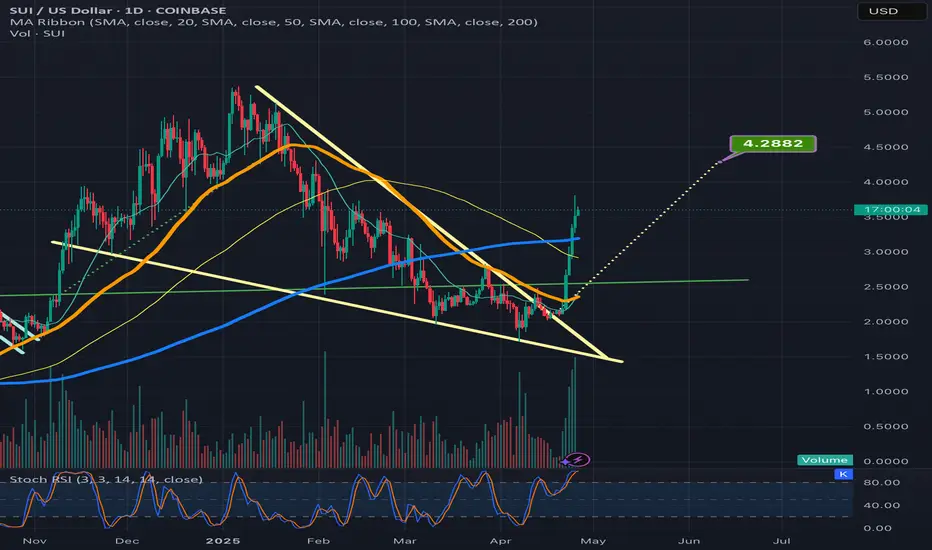
Sui broke above the wedge & is already over halfway 2 the targetSUUSD has had a very notable pump on this uptrend which hopefully will end up being the beginning of confirming a real sustained uptrend in the alt market. *not financial advice*
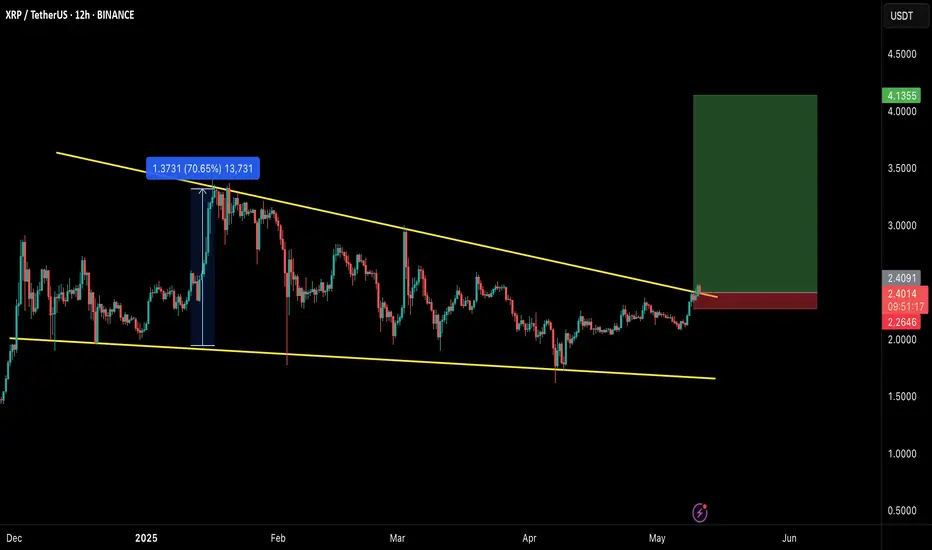
Breakout Confirmed: XRP on the Move Toward $4+🚀 XRP Breakout Alert – 70% Potential Incoming?! 👀🔥
Hey Traders! If you're all about high-conviction plays and real alpha, smash that 👍 and tap Follow for more setups that actually deliver! 💹💯
📈 XRP/USDT – Breakout Alert! 🚀
XRP is breaking out from a long-term falling wedge pattern on the 12H timeframe, signaling the potential for a strong bullish move ahead!
🔹 Entry: CMP $2.39 – Add more up to $2.32
🔹 Targets:
• TP1: $2.85
• TP2: $3.32
• TP3: $3.78
• TP4: $4.13
🔻 Stop-Loss: $2.09
⚙️ Leverage: Up to 5x (Trade responsibly)
This structure mirrors the previous 70%+ pump from the same wedge formation. History might just be ready to repeat. 👀
Let’s ride this breakout with tight risk management! 💥
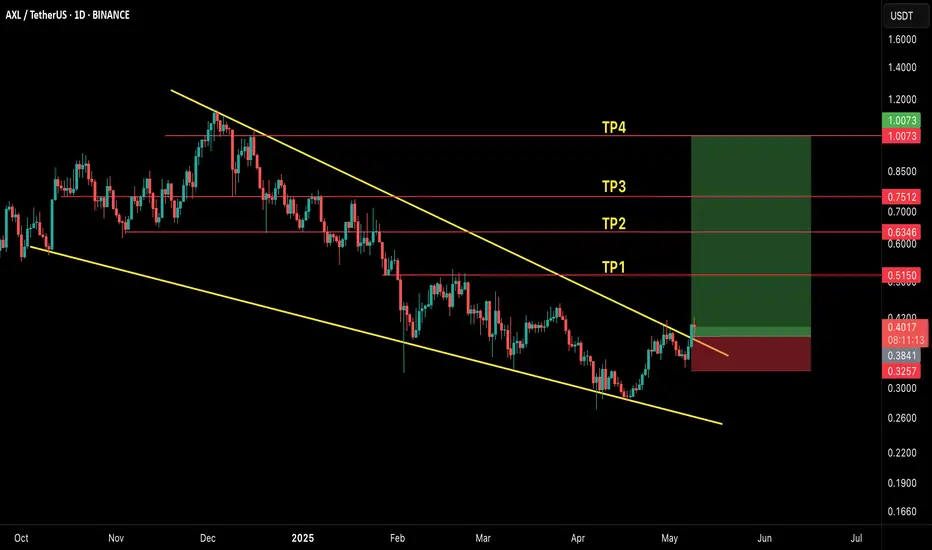
AXL/USDT – Falling Wedge Breakout! Time to Ride the Wave!!🚀 AXL Breakout Alert – 100% Potential Incoming?! 👀🔥
Hey Traders! If you're all about high-conviction plays and real alpha, smash that 👍 and tap Follow for more setups that actually deliver! 💹💯
AXL has broken out of its long-term falling wedge pattern on the daily timeframe—this is a strong reversal signal and could set the stage for a big move ahead! 🔥
🟢 Entry Zone:
CMP (Current Market Price)
Add more up to: $0.38
🎯 Targets:
🎯 TP1: $0.515
🎯 TP2: $0.634
🎯 TP3: $0.751
🎯 TP4: $1.007+
🛡️ Stop Loss: $0.325 (below wedge support)
💡 Insight:
This breakout is aligning with the overall bullish momentum we're seeing in the altcoin market. Watch for a healthy retest of the breakout zone to confirm strength. 🚀
📊 Risk Management Tip: Start taking partial profits at each target and trail your SL to lock in gains.
Let’s ride this breakout smartly! 🔥