Opening A Small Position In FARTCOIN HereGood Morning Trading Family,
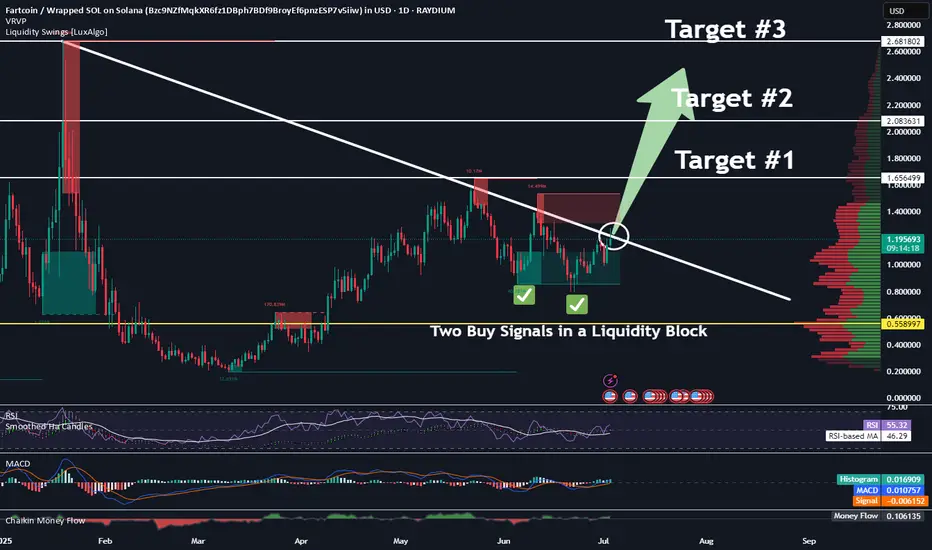
I may be a little early here, but at $1.00, I can't resist. I am picking up a small position in FARTCOIN here. I have three targets above. Each will eventually be hit IMO, but for now, I will only be shooting for TARGET #1. I may sell half at that point and let the rest ride.
Now, here are the technical reasons for making my entry here without waiting for my indicator to signal.
First of all, there are three trendlines, all significant, all converging at this one particular point, making this a powerful area of confluence!
Secondly, we broke to the topside of that descending trendline but never really came back to kiss mamma goodbye. Today we are doing that! This is a patent technical move that indicates healthy price fluctuation and is exactly what I have been waiting for.
Third, the VRVP indicates a ton of volume in this area (mostly buyer), which will be tough to break below without significant FUD, which, of course, is always a possibility.
Finally, all of my lower indicators show this thing is starting to get oversold: RSI, MACD, Chalkin MF, HA.
If we do dip lower, I will simply increase my position unless I hit my SL first. My SL is around .78 with my projected first target at 1.66 for a nice 1:3 rrr.
Good luck, all!
✌️Stew
Fartcoin

$FARTCOIN – Third Time's the Charm?
Back at a solid bid zone—third test of this level, so grabbing a small position here.
A move above $1.60 could trigger a push toward the range high, where I’ll look to offload some as first TP.
Let’s see how this one unfolds. MEXC:FARTCOINUSDT

Silent and Mega FartsSo silent farts will fall and go back and mega will directly blow the top off hahahaha
Eat Fibre and FART moreSo yes fiber food makes you fart this is virtual fart you just need to eat at the right time and blow the gas at the green momentum, ya understand sirr?
Fart Ichimoku Breakout Test📈 Checking bullish signals on the chart
✅ Positive signs:
- The price is stable above the cloud and the candles show the strength of buyers.
- Indicators such as RSI and trading volume are in a good position.
- The cloud broke with the body
First profit limit 1/451
Second profit limit 1/551
Limit of loss 1/320

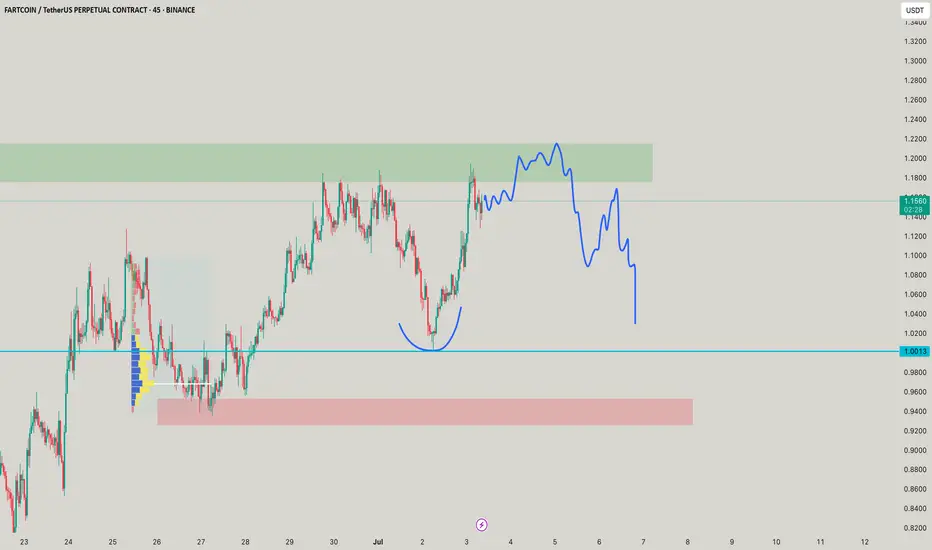
What’s Next? 🚨 $FARTCOIN Cup & Handle Pattern Forming – What’s Next? 📈
$FARTCOIN has formed a bullish Cup & Handle pattern — but is it over?
❌ Not yet. $FARTCOIN hasn’t shown any strong bearish signals for now.
🔍 We’re watching two key green line levels below.
📉 If the price drops toward these zones, we may see buyers step back in — creating a potential entry, but only with confirmation.
✅ Stay patient — no rush to jump in without a setup. Let the chart guide us.

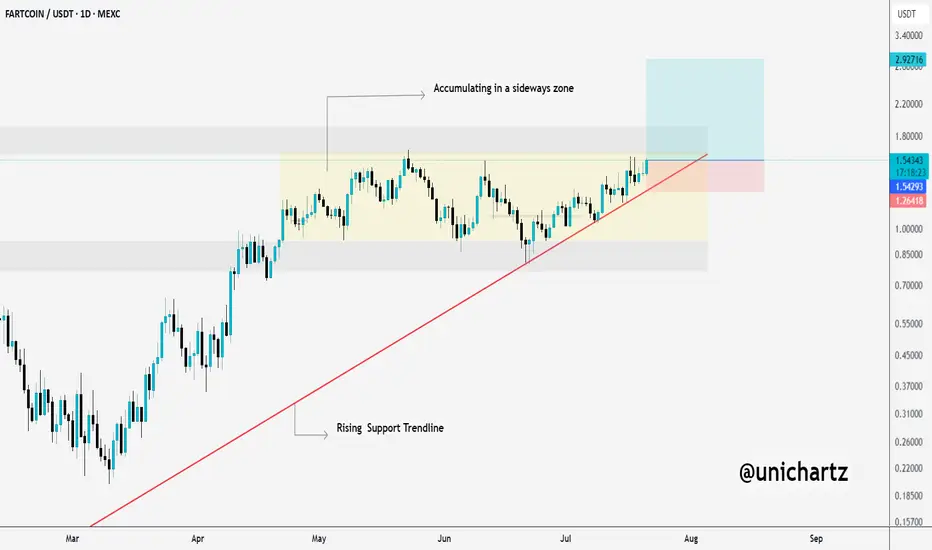
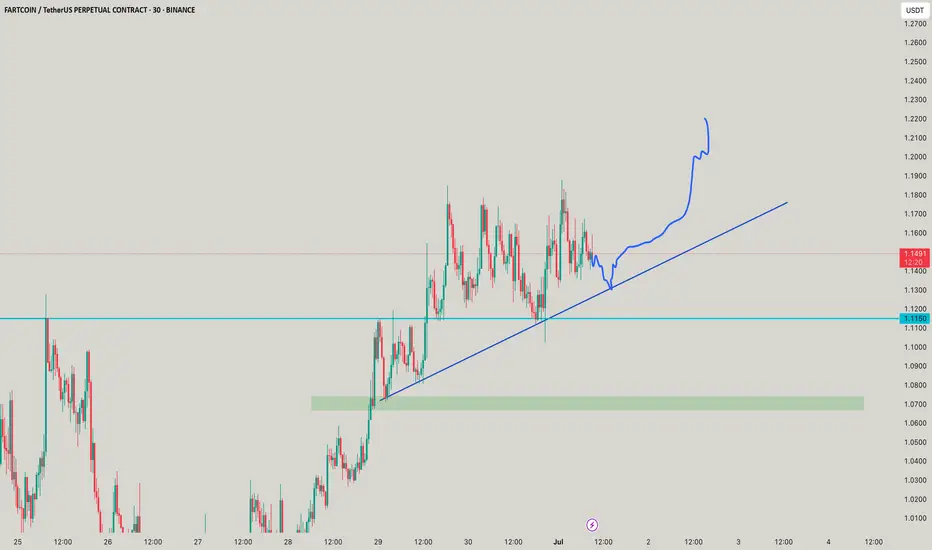
Fartcoin Coiling Up for a Parabolic Move$FARTCOIN is bouncing perfectly from the rising trendline and continuing to accumulate within the sideways range.
If it manages to break above the marked resistance zone, we could see a parabolic move ahead.
The structure looks strong, and momentum is building, keep a close watch on this one, things could get explosive soon.
DYOR, NFA
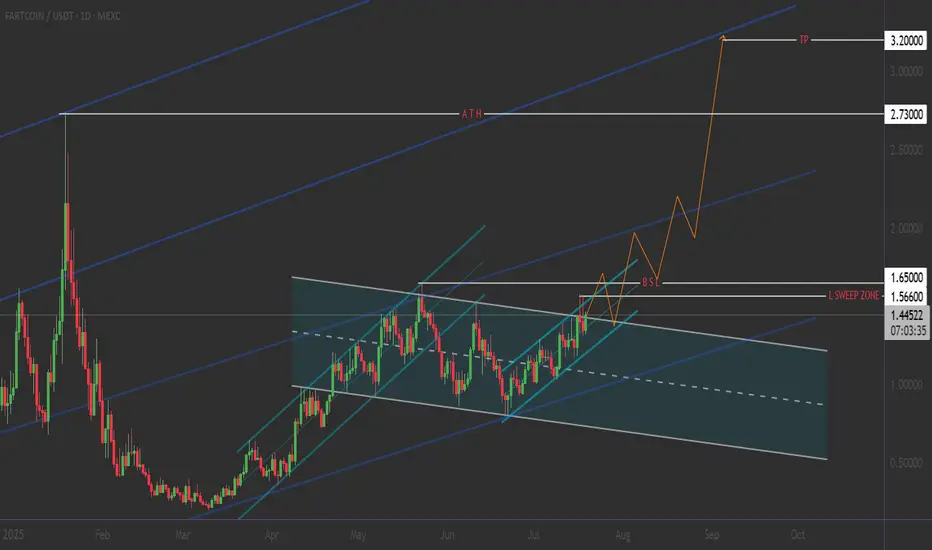
FANTCOIN: The Perfect Storm - Bullish Breakout Analysis💡 CREATIVE TRADING STRATEGY: "The Triangle Rocket :
4-month ascending triangle = BREAKOUT TIME!
___________________
🟢 BULLISH SCENARIO (High Probability)
ENTRY ZONES📈
🛡️ Conservative: $1.30-$1.35 (Pullback to support)
TARGETS:
🎯 Target 1: $1.85 (+28% from current)
🎯 Target 2: $2.30 (+60% from current) : L S S
🎯 Target 3: $2.73 (+88% from current) : ATH
🚀 Moon Shot: $3.20 (+120% from current) & EXIT ZONE ⏰
STOP LOSS:
❌ $1.15 (Below ascending support)
____________ NOTE __________
⚠️ RISK MANAGEMENT
⚠️ DYOR
Remember: No setup is guaranteed. Always manage risk and never invest more than you can afford to lose.
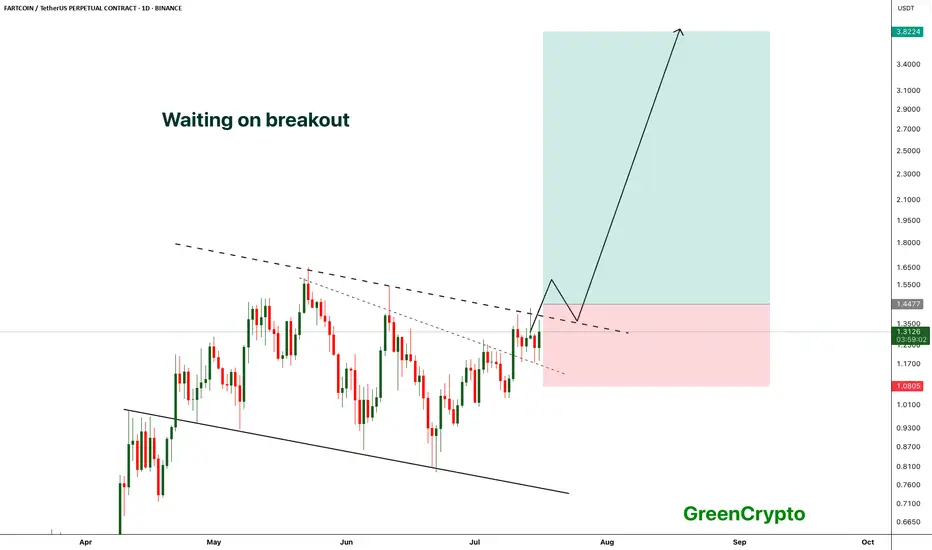
FARTCOIN - Breakout from the channel- FARTCOIN is waiting to breakout from the channel, a confirmed breakout would push the price to new all time high
- we have long trade opportunity once the price breaks above the resistance trendline
Entry Price: above 1.44
Stop Loss: Below 1.08
TP1: 1.6464
TP2: 1.8923
TP3: 2.2450
TP4: 2.9973
TP5: 3.8224
Max Leverage: 5x
Don't forget to keep stoploss
Cheers
GreenCrypto
FARTCOIN Holding the Trendline Like a ChampFARTCOIN is currently consolidating in a sideways range, forming a clean accumulation zone just above the rising trendline support. This kind of structure often builds energy for the next leg up.
As long as the price respects the rising trendline, the bulls remain in control. A breakout above the sideways zone could trigger a strong move toward the upper resistance levels.
Keep an eye on this one — it’s showing strength and gearing up for a potential breakout.

GOODBAY FARTCOIN-USDT ..💨 FARTCOINUSDT: The Gas That Could Ignite!
📊 Current Market Snapshot
- Price: $1.2446 (-2.85%)
- Volume: $351.81K (Medium liquidity)
- Key Levels:
- Support: $1.22
- Resistance: $1.28
- Psychological Level:** $1.30
🎯 Trading Strategy
- Long Setup:
- Entry: $0.67 - $0.72
- Targets: $1.2 → $1.35 → $1.60
- Stop Loss: $0.64
- QUICK TRADE
- Entry: $0.94
- Targets: $1.15 → $1.10
- Stop Loss: $0.90 - close 4h
⚠️ Risk Warning
1. Extreme volatility expected
2. Low liquidity can cause slippage
3. Monitor BTC dominance for market trends
📌 The Opportunity
FARTCOIN offers:
- High-risk, high-reward potential
- Perfect for quick scalps
- Clear technical levels
---
📊 | Not financial advice - DYOR
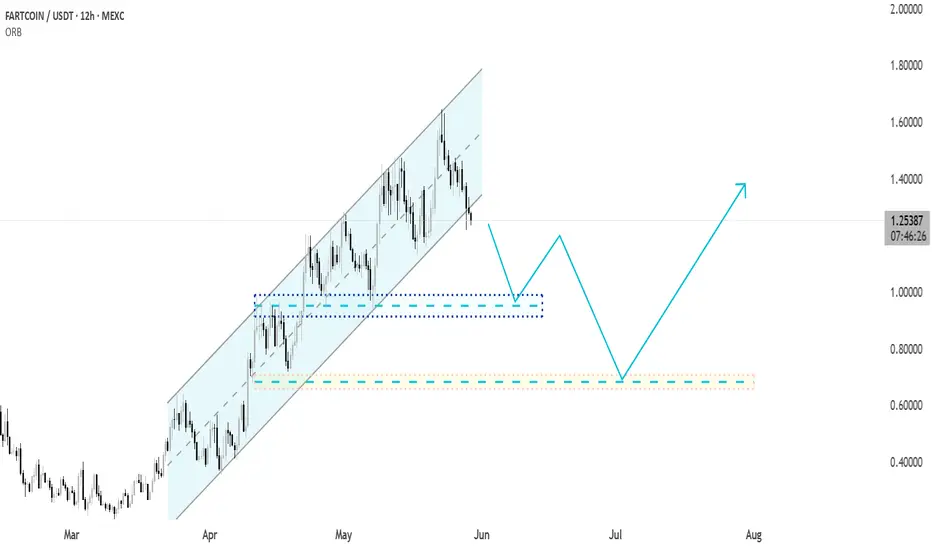
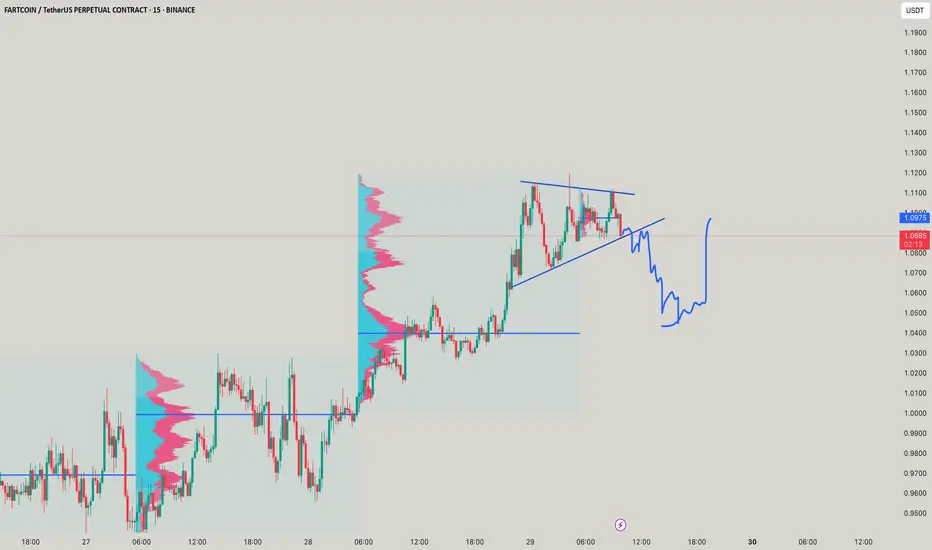
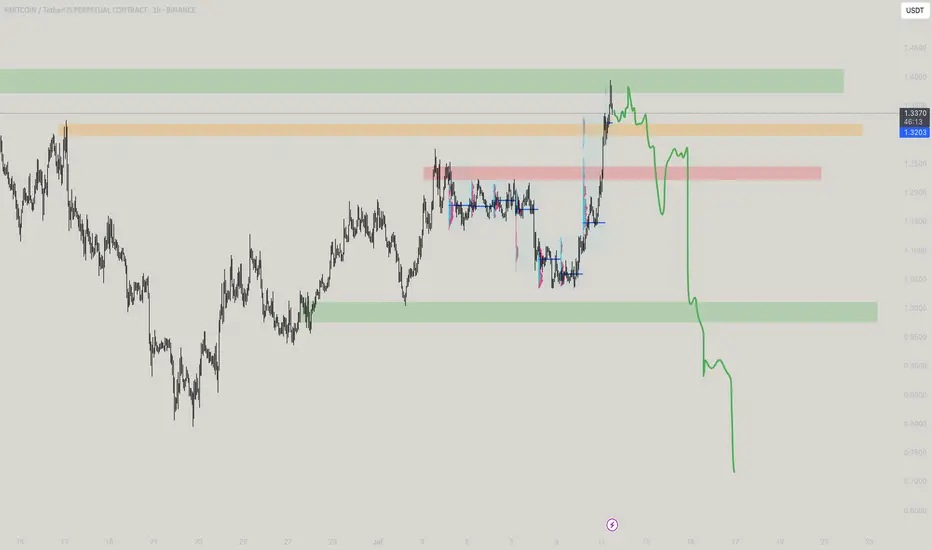
Fartcoin - Rangebound repeat? A BTC makes new highs attention has turned towards altcoins to play catch up.
FARTCOIN has been a top performer of the last month and currently on the 1D timeframe finds itself in a rangebound environment capped between $1.1923 - $1.3945. The end of last week price trended down in a bearish channel from top to bottom and it looks to be doing the same currently. As the supply zone above the range high got swept, price printed a SFP getting back inside the range and began trending down, for me there are two actionable long entries here:
- A range low bounce + breakout of trend channel would be an ideal long entry. An area of clear support coupled with a breakout is a historically strong setup with a clear invalidation if price breaks below the range and gets accepted.
- A more aggressive but potentially less ideal setup would be a breakout of the downtrend before hitting range lows. Higher risk as the level of support is not as defined but in the more risk-on environment crypto is currently in, the chance of major support levels being front run does go up as buyers become more impatient when FOMO grows.
The midpoint is key level to look out for too as a reclaim would mean a run at the highs, rejection opens the door to retest the lows.

FART ~ Just fart once more?He is just holding is farts because he out of beans, but yes ive given him beans to consume and then yes, thats what you want!
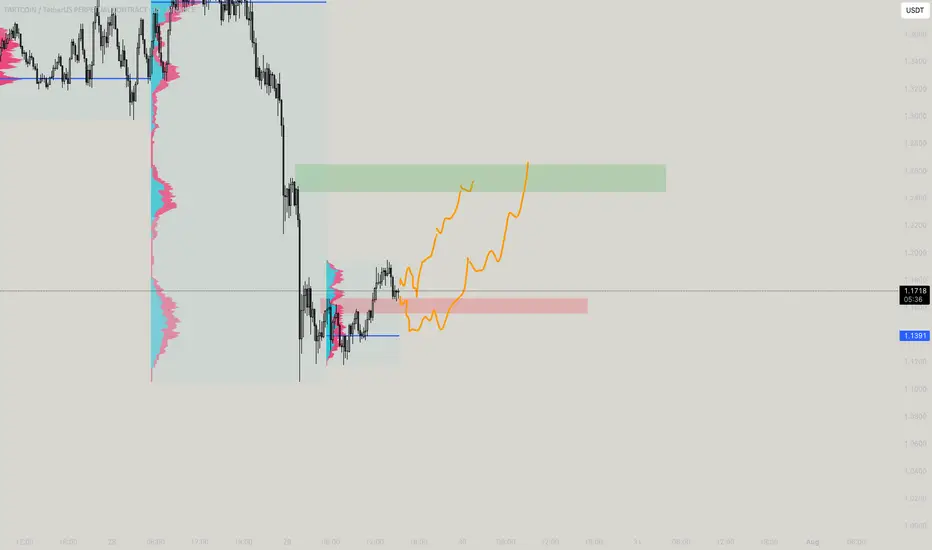
FARTS to SHARTSOkay so as I see this happening, What i have learnt, this is best way to catch all the buyers!
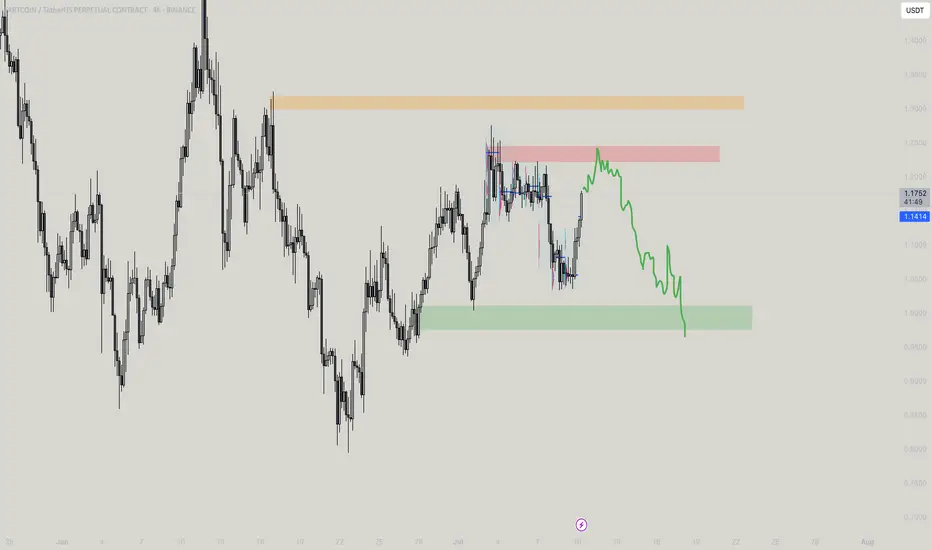
The MEGA FART SHOWYEs its a fartshow! Okay so got so many DM for ALT's, I am going to write something what I see, As per move, ETH looks strong till $3,200 and except for that all just moved without any heavy institutional moves means volume is just based on Future OI which isnt a perfect move, So i wont comment unless full OB forms, but seeing this - You get another huge short oppurtuunity- this fartcoin is having the range marked, it would be a positional short/ and a hold trade as stated if you create position in the red and if it briefly touches the orange box, dont exit! Its the plan you know now!
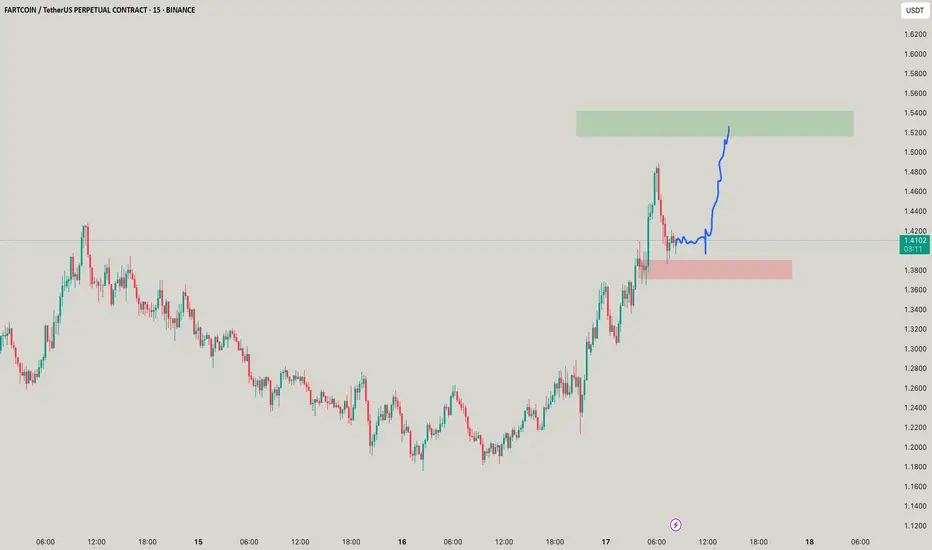
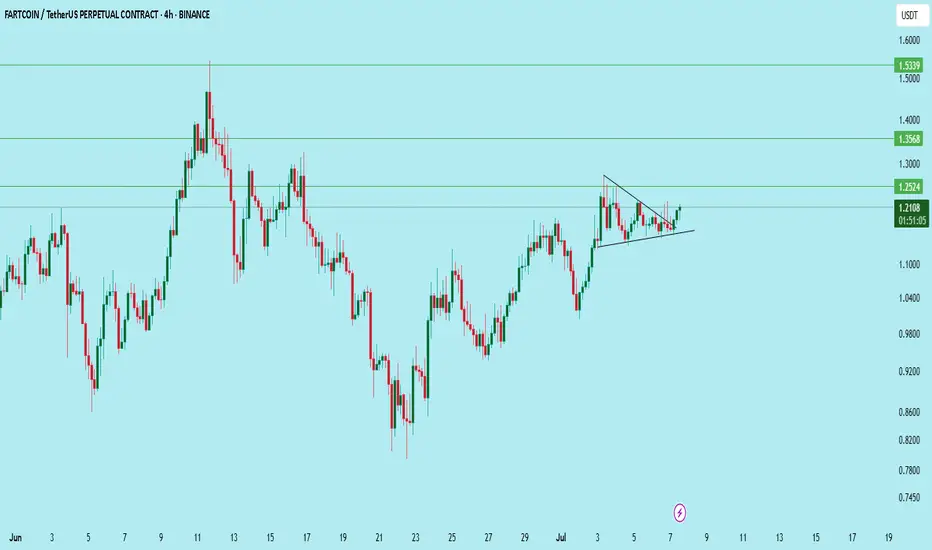
FARTCOIN/USDT – 4H Chart Analysis$FARTCOIN is showing strong structure and has broken out of a bullish flag formation on the 4H timeframe. The price is currently holding above the breakout zone, which increases the probability of continuation.
Setup:
Entry: Buy on retest of breakout (~1.20–1.21 zone)
Stop Loss: Below 1.15
Targets:
TP1: 1.25
TP2: 1.35
TP3: 1.53
Support: 1.15
Resistance levels ahead: 1.25 | 1.35 | 1.53
Watch for the retest — it may provide a great second entry opportunity if missed.
DYOR. Not financial advice
#FARTCOIN #CryptoTrading
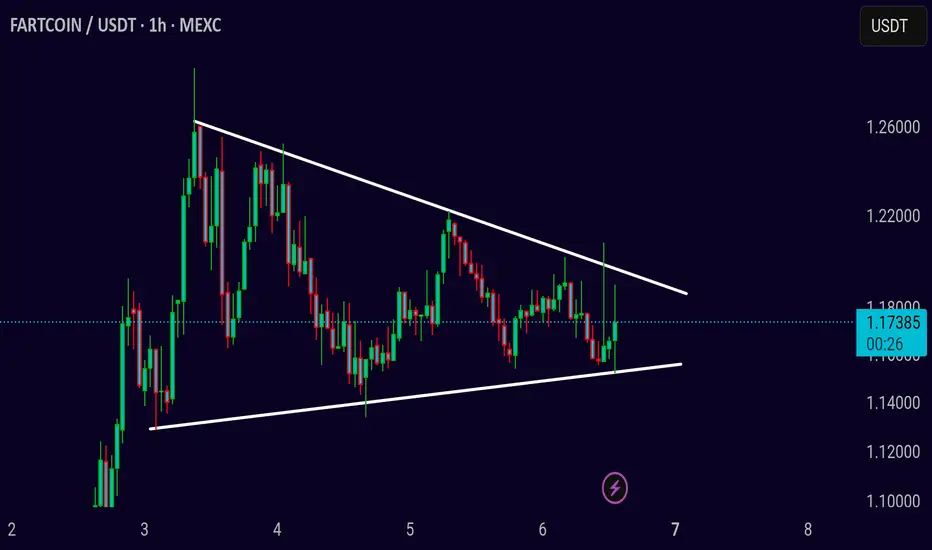
FARTCOIN – Triangle Pattern Setting Up for a Break
**Pair:** FARTCOIN/USDT
**Timeframe:** 1H
**Pattern:** Symmetrical Triangle
FARTCOIN is consolidating around 1.1820 within a symmetrical triangle on the 1H chart. This structure usually signals a breakout is near — but the direction remains uncertain.
**Bullish Case:**
If the price breaks above the upper trendline with strong momentum, we could see a short-term bullish move.
**Bearish Case:**
If the triangle support breaks down, expect bearish continuation in the short term.
No confirmed move yet. Wait for a clear breakout before entering.
Get Ready! Hot Air Rises. Fartcoin About To Break Wind.Trading Fam,
Our national debt is a meme. The buying power of our dollar is a meme. Our monetary system is a meme. The Fed is a ponzi scheme and a meme. Everything related to geopolitical economics has become a meme. We can't take any of this stuff seriously anymore. So, why not make a profit on the best memes of the day? Enter pungeant FARTCOIN. AI-created and managed, FARTCOIN is cutting loose with no reservations. And it looks like it is about to break wind again. They say hot air rises. Let's see how far this stink can go.
Let her rip!
Stew
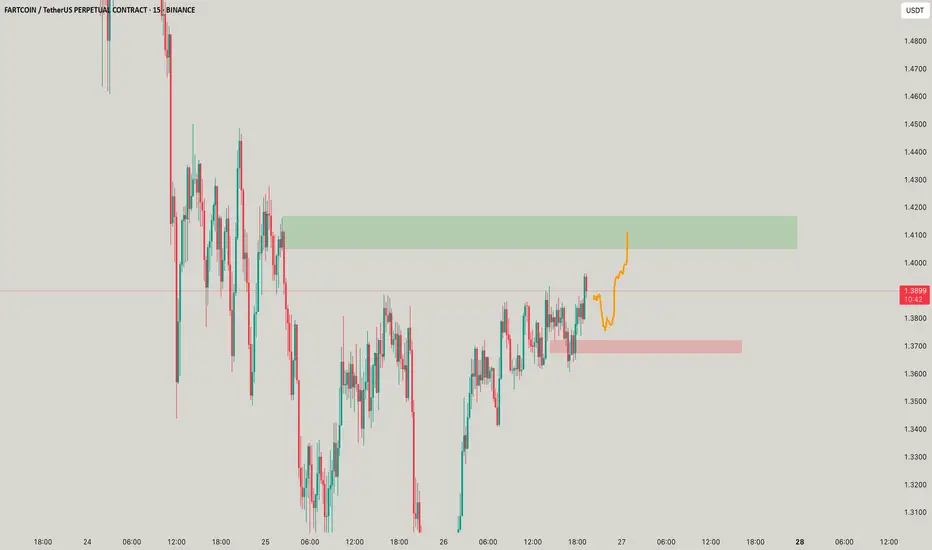
FART _ You dont realise he farts on us? All day?If you look at this Farts - Comes two perspective here - One - This is retracement, i.e it took all sellers wrecked - took buyers on top and would break the skyblue line and eventually come to the red one - But the fact is - if we see another prespective - We see it can just go up at 1.26 also -- For me I would follow this what I have learnt, And am pretty sure it would retrace back the red box as well in full
Dribble Farts - Smell like rosee!So this fart smells like rose i sniffed! Just let the move come down, hodl it, look after the caution line!
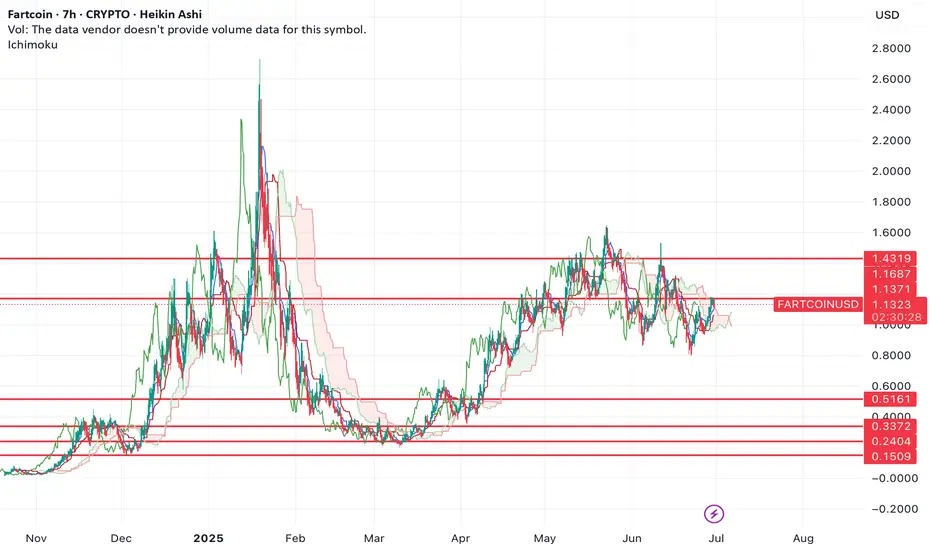
Letting gas out of the fartcoin trade, back under $1Fart coin looks like shit. Looks to me like the gas has run out of this trade.
If we look at the chart, we can see that price has rejected resistance here and Heikin Ashi candles starting to show the bearish trend starting.
On top of that you have a massive head and shoulders top forming, which would be confirmed under $.88.
I think it's likely that we see the bottom supports get tagged from here.
Invalidation would be a break of $1.53.
Have you heard a trumpet FARTS?So yeah that would sound amazing, but this sound is like he boasts yeah man come i am giving you free money LOLOLOL
Fart isnt deadly anymore!Just a smol notion on how things work! This can make or break though shall break up, but for me ideal is break down and up!