Gas ready? for FARTSFARTS is having a lot of beans and this coin you see with all fall rise like a beast! 4H 1H loooks very very strong, LIKE VERY!!!
FARTCOINUSDT

Breaking: $FARTCOIN Gearing For A Breakout To 1 Bln Market CapThe price of fartcoin has been surging consecutively, but failed to break the $1 pivot or resistant point withholding the asset from breaking the $1 billion market threshold.
The memecoin was created on the Solana blockchain through pump.fun, shortly after the community took over the project making it graduate to Raydium- a DEX on Solana ecosystem. Gaining momentum, the asset was listed on few CEX like Kucoin, GateIo, BingX, etc.
Fartcoin ($FARTCOIN) has made 3 attempts to break pass the $1 resistant but each move was denied making the asset to form a short-term head and shoulder pattern. while the asset is consolidating after the recent fit, failure to break the $1 resistant for $FARTCOIN might resort to a retracement to the $0.60 support point before picking liquidity up for a reversal.
Fartcoin Price Data
The Fartcoin price today is $0.760227 USD with a 24-hour trading volume of $292,550,722 USD. Fartcoin is down 15.66% in the last 24 hours. The current CoinMarketCap ranking is #77, with a market cap of $760,225,448 USD. It has a circulating supply of 999,998,256 FARTCOIN coins and a max. supply of 1,000,000,000 FARTCOIN coins.

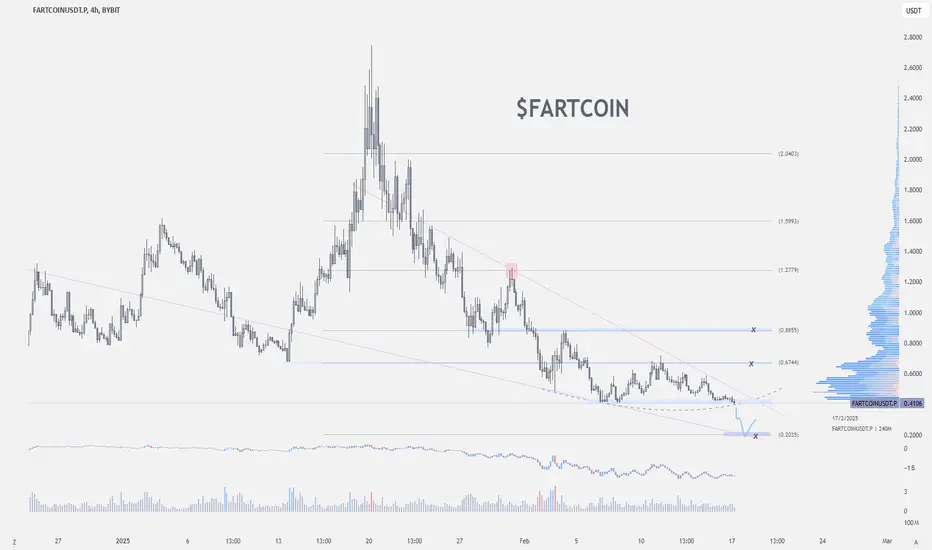
#FARTCOINUSDT is set for a bearish scenario📉 SHORT # BYBIT:FARTCOINUSDT.P from $0.7376
🛡 Stop loss: $0.7830
🕒 Timeframes: 1H + 4H
✅ Overview:
➡️ On the 4H chart BYBIT:FARTCOINUSDT.P , price broke down from the Bullish Flag, thereby invalidating the bullish scenario.
➡️ The Top 2 formation failed to break the previous high, confirming a bearish structure.
➡️ The $0.7822 level was broken and now acts as resistance — currently being retested.
➡️ The current entry at $0.7376 is optimal after a weak bounce, with high downside potential.
➡️ Volume increased on the red candles, confirming that sellers are in control.
➡️ Support levels are at $0.7172, $0.6970, and $0.6765. The main target lies near the volume-based POC at $0.5269 (in the next stage).
🎯 TP Targets:
💎 TP 1: $0.7172
💎 TP 2: $0.6970
💎 TP 3: $0.6765
📢 The bearish scenario is confirmed. A continuation of the downtrend is expected.
📢 The channel breakdown and weak bounce with declining volume are strong confirmation signals for entry.
📢 Stop-loss is placed above the rejection zone.
📢 Local VPVR and price structure confirm seller pressure in this area.
🚫 Long positions are not valid at the moment — no reversal patterns or confirmations above volume resistances.
🚀 BYBIT:FARTCOINUSDT.P is set for a bearish scenario — downward movement is the priority! Watch price action and manage your levels carefully!

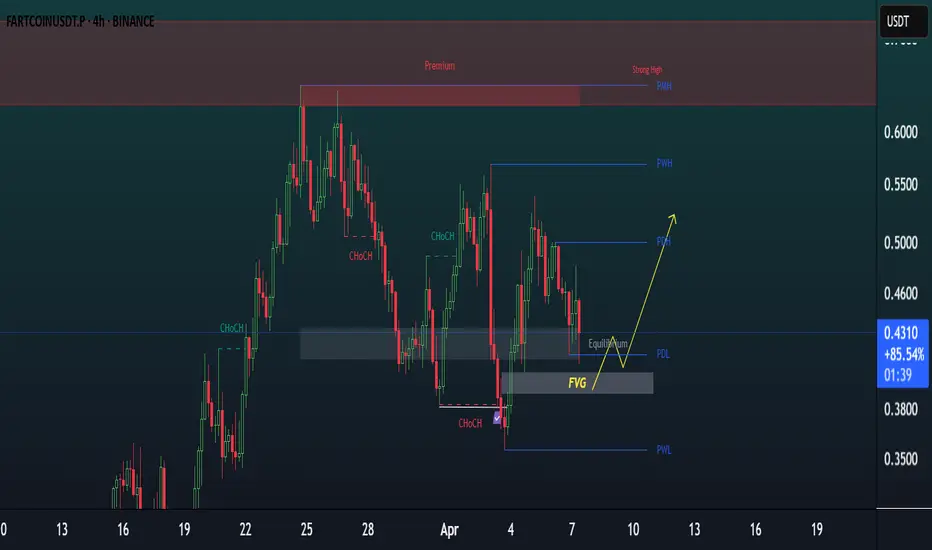
FARTCOIN/USDT – HIGH PROBABILITY SHORT FROM PREMIUM ZONEMarket structure shift confirmed with CHoCH, signaling bearish intent.
Price is retracing to fill the Fair Value Gap (FVG) — a premium zone where institutions are likely to re-enter shorts.
Entry: 0.8971 – 0.9010
Target: 0.8571 – 0.8264 – 0.7689
Stop: 0.9254
This is a high-RR setup with clean structure, imbalance, and trend alignment.
Entry in FVG with confirmation = sniper entry.
Targeting downside liquidity zones with ~1:3.5 RR.
Always do your own research, manage your risk, and use proper confirmation before entering any position. Trade responsibly.

A Not so smelly Fart by Fartcoin!So parabolic move where one more move is left, enjoy the farts enjoy the move!
$FARTCOIN Short-Term OutlookHello Friend!
Let's have and take a look on Fartcoin
The relative strength and volume here are unreal. Can we hit $1 before a pullback?

FARTCOIN Is About to Make or Break—Massive Correction Incoming ?Yello Paradisers — have you seen what’s brewing on #FARTCOINUSDT? After our spot-on predictions in previous waves, this might be the final shakeout before the real show begins. But one wrong move here… and it all falls apart.
💎#FARTCOIN has recently shown aggressive movement, completing the third wave of a classic Elliott Wave impulse. Waves 1 and 2 are in place, and with the third now printed, there's a strong probability of entering an ABC corrective phase — forming the 4th wave — which could retest areas near the previous resistance-turned-support.
💎Zooming out, the asset has been shaping a long-term Cup and Handle formation, and while we’ve seen a breakout above the neckline, a retest is highly likely before any continuation. This aligns with a potential ABC structure, adding confluence to a possible pullback scenario.
💎On top of that, FARTCOIN is flashing signs of strength within a bullish inverted Head and Shoulders pattern, with a neckline around 0.6273. A retest of this key level is probable and would further validate buyer interest in this zone.
💎Additional confluence comes from Holding the multi-timeframe EMA 20 as dynamic support. A visible order block at the 0.618 Fibonacci golden pocket (0.5217), which could act as a magnet for price during the correction.
💎If this area holds, the bullish case remains intact, with probable targets at 0.8913, and an extended move into the 1.0542–1.1361 zone. However, this structure would be invalidated on a candle close below the right shoulder, or a breakdown below the 2nd Elliott Wave low.
This is the point where the weak hands get shaken out and smart money reloads. If you're aiming for long-term success, wait for high-probability setups and protect your capital. Strive for consistency, not quick profits. Treat the market as a businessman, not as a gambler, Paradisers.
MyCryptoParadise
iFeel the success🌴

FARTCOON BUY TIMEFARTCOIN is trading above big buy bullish FVG. After diving into this liquidity area we are expecting bounce because previous low liquidity has been sweept.
FARTCOIN - Quick SIlent FartsSo quick farts and silents are deadly, hence a small trade for short defying orderblock shall be taken into consideration, I repeat defying OB!
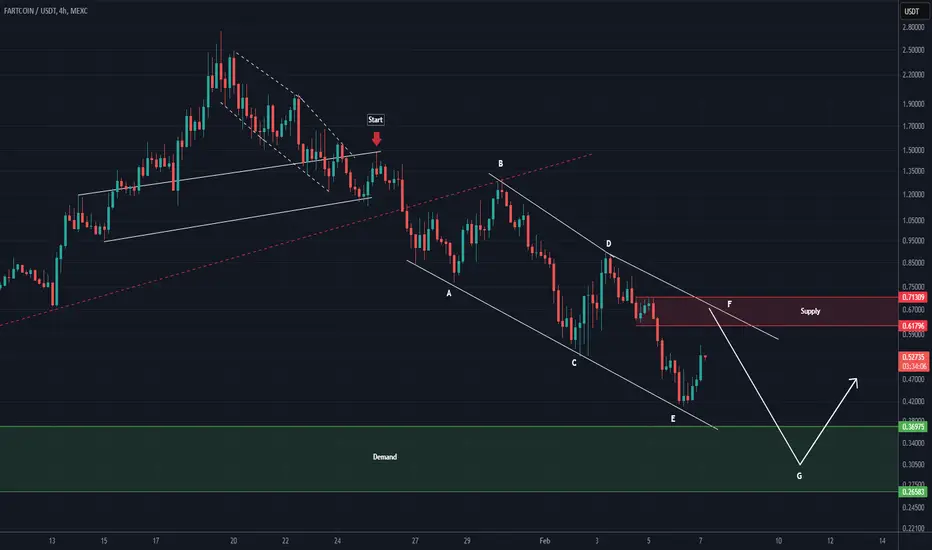
FARTCOIN Is Still Bullish (4H)From the point where we placed the red arrow on the chart, the correction of FartCoin has begun.
This correction appears to be symmetrical and now seems to be complete.
Since a strong bullish wave has not yet formed and the retracement wave is small, it is expected to move from nearby support levels toward the main supply zone.
We are looking for buy/long positions in the demand zone.
A daily candle closing below the invalidation level will invalidate this analysis.
For risk management, please don't forget stop loss and capital management
Comment if you have any questions
Thank You

Phemex Analysis #69: Pro Tips for Trading FARTCOIN. FARTCOIN ( PHEMEX:FARTCOINUSDT.P ), once a highly sought-after AI meme coin, experienced a meteoric rise of over 500%, reaching an all-time high of $2.75 following its listing on Phemex. The euphoria was palpable, with investors reveling in their newfound gains.
However, as is often the case in the volatile crypto market, the winds changed. A broader market downturn ensued, and FARTCOIN was not spared. Its price plummeted by more than 92%, hitting a low of $0.1987. The once-celebrated coin seemed to be gasping for air, leaving many to wonder if it would ever regain its former glory.
But in the world of cryptocurrencies, narratives can shift rapidly. FARTCOIN began showing signs of life, bouncing back from the $0.19 area and forming higher lows and higher highs—a classic indicator of a potential bullish run. The community buzzed with speculation: Was this the dawn of a new era for FARTCOIN?
Possible Scenarios and Pro Tips
1. Bullish Reversal
The recent price movements suggested that FARTCOIN might be gearing up for a resurgence. If it could sustain levels above key resistance points, it would signal renewed investor confidence and an upward trend.
Pro Tips:
Breakout Entry: Should the price break above the $0.42 resistance level with substantial trading volume, traders might consider entering long positions, targeting subsequent resistance levels at $0.59, $0.88, and $1.29.
Accumulate Gradually: For those wary of immediate market volatility, employing Phemex's scaled orders to build a position between $2.00 and $4.00 could be a prudent strategy.
2. Continued Downtrend
Yet, the crypto seas are unpredictable. If FARTCOIN failed to maintain its support levels, it could test lower price points, especially if broader market sentiments turned sour.
Pro Tips:
Short Positions: Seasoned traders might explore short-selling opportunities, particularly if the price dips below established support levels at $0.26 or $0.23 with high trading volume.
Buying at Support Levels: Conversely, if the price drops below these support levels with low volume, long-term investors might see this as an opportunity to accumulate FARTCOIN near strong support zones, such as $0.20.
3. Consolidation Phase
There was also the possibility that FARTCOIN would enter a consolidation phase, trading within a defined range as the market sought direction. This sideways movement could persist until new catalysts emerged.
Pro Tips:
Range Trading: Identifying key support levels at $2.6, $2.3, and $2.0, and resistance levels at $0.42 and $0.59, could enable traders to execute buy and sell orders effectively within this range.
Grid Trading: Utilizing Phemex's Grid Bot could allow traders to automatically capitalize on small price movements within the trading range, optimizing gains during periods of consolidation.
Conclusion
FARTCOIN's journey reflects the dynamic nature of the cryptocurrency market. From its rapid ascent to its subsequent decline and potential recovery, FARTCOIN exemplifies the volatility inherent in digital assets. By staying informed, employing strategic trading approaches, and exercising prudent risk management, traders can better navigate the opportunities and challenges presented by such assets.
Tips:
🔥 Break free from "buy low, sell high"! Our new Pilot Contract empowers you to profit from ANY market direction on DEX coins with up to 3x leverage. Go long, go short, go further!
Check out Phemex - Pilot Contract today!
Disclaimer: This is NOT financial or investment advice. Please conduct your own research (DYOR). Phemex is not responsible, directly or indirectly, for any damage or loss incurred or claimed to be caused by or in association with the use of or reliance on any content, goods, or services mentioned in this article.

#FARTCOINUSDT is showing bullish momentum📈LONG BYBIT:FARTCOINUSDT.P from $0.3590
🛡 Stop Loss: $0.3465
🕒 Timeframe: 1H
⚡️ Overview:
➡️ BYBIT:FARTCOINUSDT.P is showing bullish momentum on the 1-hour timeframe.
➡️ The price has recently broken through the resistance zone at $0.3590, which could serve as an entry point for a long position.
➡️ The chart shows an accumulation zone in the $0.3374–$0.3590 range, where volumes (visible on the volume profile to the left) indicate strong buyer interest.
➡️ The POC (Point of Control) is at $0.3462, confirming support below the current price.
➡️ The price is maintaining an uptrend structure: higher lows and highs are forming, and the breakout at $0.3590 is accompanied by increasing volumes, signaling bullish activity.
➡️ The #RSI (14) indicator on the 1H timeframe is at 65, indicating bullish momentum without being overbought, leaving room for further growth.
🚀 Plan:
➡️ Entry: Buy above $0.3590 after the 1-hour candle closes above this level to confirm the breakout.
➡️ Stop Loss: Set at $0.3465 (below the support zone and POC), which provides a 3.5% risk from the entry point and protects against false breakouts.
➡️ Risk/Reward Ratio: From 1:2 (for TP1) to 1:5.5 (for TP3), making this trade attractive from a risk management perspective.
🎯 Take Profit Targets:
💎 TP1: $0.3660
(nearest resistance level, +1.9% from entry)
💎 TP2: $0.3730
(zone of previous highs, +3.9%)
💎 TP3: $0.3790
(key growth target, +5.6%)
📢 A price consolidation above $0.3590 with sustained volume increases the likelihood of reaching the targets. The $0.3660 and $0.3730 levels may act as profit-taking zones, so monitor price action in these areas.
📢 Risks: If the price drops below $0.3465, it could signal a false breakout and a return to the consolidation zone of $0.3374–$0.3465. In this case, consider reassessing the position.
📢 Market Context: The rise of BYBIT:FARTCOINUSDT.P may be supported by the overall positive sentiment in the crypto market. As of March 19, 2025, BYBIT:BTCUSDT.P is trading steadily above $90,000, creating a favorable backdrop for altcoins.
BYBIT:FARTCOINUSDT.P is showing strength and potential for growth on the 1H timeframe. A confirmed breakout above $0.3590 is your signal to act! We expect a move toward the $0.3660–$0.3790 levels.

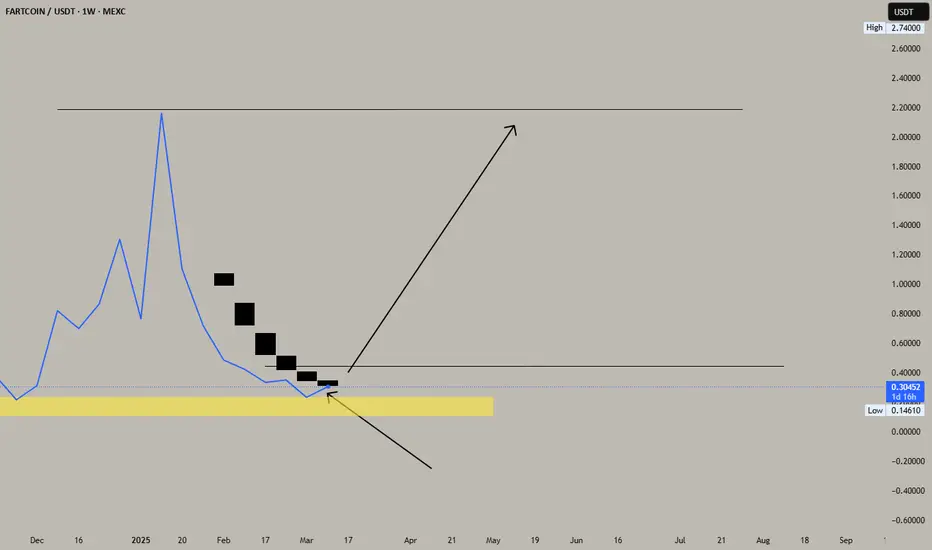
FARTCOIN, cheap ticket for a 10x prospect, a doable bet!Warning. This is a Meme. You know how this works.
Don't call me out. This is for cheap ticket play only. :)
Fartcoin is a meme coin on the Solana blockchain designed to combine humor, community engagement, and cryptocurrency. Pretty much not something to take seriously except for a novelty, passionate community and most importantly a possible lottery ticket play which could pay off big if played right.
Like with any newly launched meme -- and with the hype power of a community it can launched it to stratosphere in a few days. And this coin did just that, go to skies 10x -- then as we would all expect with a parabolic move, a drop thereafter, HUGE DROP, and 10x drop at that.
Unfortunately the Market Gravity has resurfaced with so much magnet and pulled everything down on its path and memes are much prone to this due to there high volatility nature. Fartcoin slashed 10x of its valuation from the top.
Now based on recent long term metrics, Fartcoin is back on solid footing again but this time with lighter MCAP and less baggages to worry about. We are seeing some basing price movement from the current levels - conveying a massive shift in trend structure.
Ideal entry at current range at 0.30.
Target, back at peak at 10x (speculatively).
Again, play smart. cheap ticket bet only.
TAYOR. trade safely.
$FARTCOIN - Long Trade IdeaFARTCOIN hit its penta wave at .20
Longing at cmp, dca if it dips around .24
Stoploss below .215 or below the low
Targets:
tp1 .30 - .32
tp2 .42 - .44
tp2 .60 - .62

FARTCOIN: Breakout Alert! 200-300% Move Incoming?🚀 Hey Traders! Ready to Catch the FARTCOIN Explosion? 👋💨
If you’re pumped for this setup, smash that 👍 and hit Follow for elite trade ideas that actually deliver! 💹🔥
💎 FARTCOIN is breaking out! It's blasting out of a falling wedge pattern on the 4H time frame, signaling a potential 200-300% surge! Now’s the time to grab some and ride the wave! 📈
📌 Entry Range: CMP – Add more up to $0.36
🎯 Target: 200-300% upside!
🛑 Stop Loss: $0.324
⚡ Leverage: Spot or low leverage (Max 5x)
💬 What’s Your Take?
Are you bullish on FARTCOIN’s breakout potential? Drop your analysis, predictions, or strategies in the comments! Let’s secure those gains together! 💰🔥

$FARTCOIN - Descending Triangle$FARTCOIN | 4h
Fartcoin is currently trading within a descending triangle pattern, and it still looks weak.
A new low is plausible if the support at $0.40 is breached.
The bottom is not yet in, but it's close.
If Bitcoin pulls back to $95k-$93500, we could see Fartcoin dropping to the $0.20s or even the $0.18s
FARTCOIN ANALYSIS (4H)From the point where we placed the red arrow on the chart, it seems that the correction of FARTCOIN has begun.
The correction is either a diametric or symmetrical pattern.
Once again, there is potential for rejection and a drop from the red zone down to the green box.
In the green zone, after spotting a reversal pattern or getting a trigger, buy/long positions should be considered
For risk management, please don't forget stop loss and capital management
Comment if you have any questions
Thank You
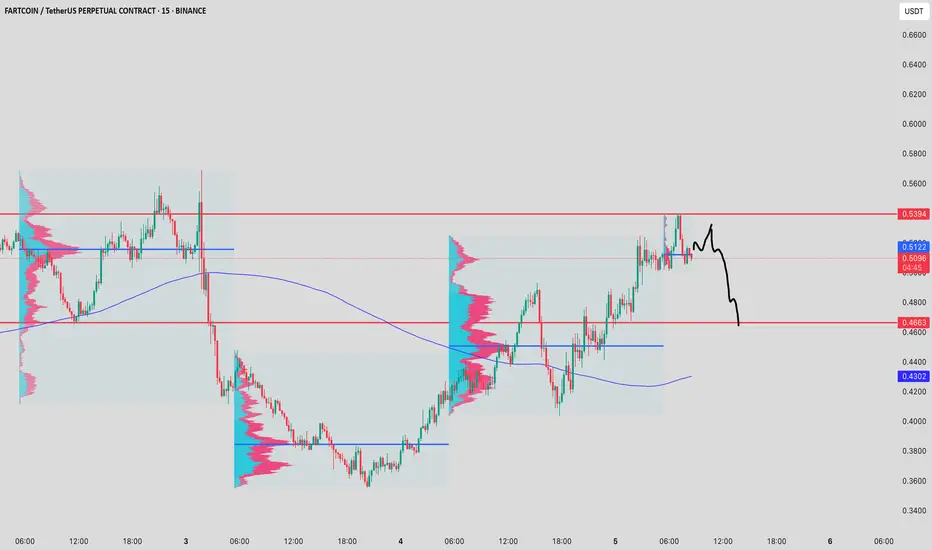
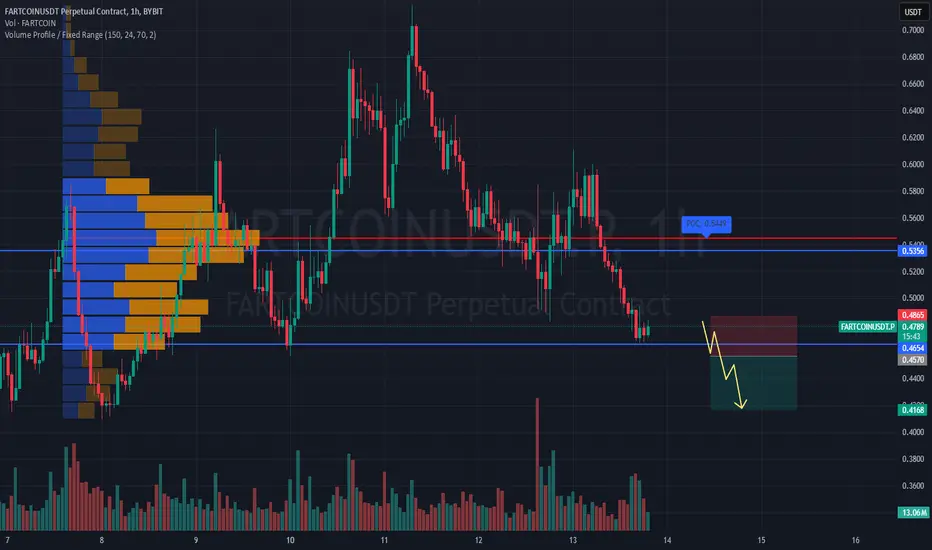
#FARTCOINUSDT remains weak — expecting further downside📉 SHORT BYBIT:FARTCOINUSDT.P from $0.4570
🛡 Stop Loss: $0.4865
⏱ 1H Timeframe
✅ Overview:
➡️ BYBIT:FARTCOINUSDT.P remains under selling pressure, forming a downtrend. The price is testing the $0.4570 level, which previously acted as support, but the market remains weak.
➡️ POC (Point of Control) at $0.5449 indicates the main liquidity zone, far above the current price. This suggests seller dominance, with major trading activity still at higher levels.
➡️ A breakdown of $0.4570 would trigger further downside, opening the way to $0.4350 – $0.4168.
➡️ The $0.4168 level is a key support, where buyers previously showed interest.
⚡ Plan:
➡️ Enter SHORT from $0.4570 after confirming a breakdown.
➡️ Stop-Loss at $0.4865, placed above the nearest resistance.
➡️ Key downside targets: $0.4350 and $0.4168.
🎯 TP Targets:
💎 TP 1: $0.4350
🔥 TP 2: $0.4168
🚀 BYBIT:FARTCOINUSDT.P remains weak — expecting further downside!
📢 The market structure remains bearish. Volume continues to decline, confirming the weakening buying interest.
📢 However, a short-term bounce at $0.4168 is possible. If significant volume appears at this level, a brief return to $0.4350 could occur, but the overall movement remains downward.
📢 BYBIT:FARTCOINUSDT.P is in a bearish structure, and unless $0.4570 is reclaimed, we are likely to see further downside movement. A short-term bounce at $0.4168 is possible, but the overall trend remains weak.
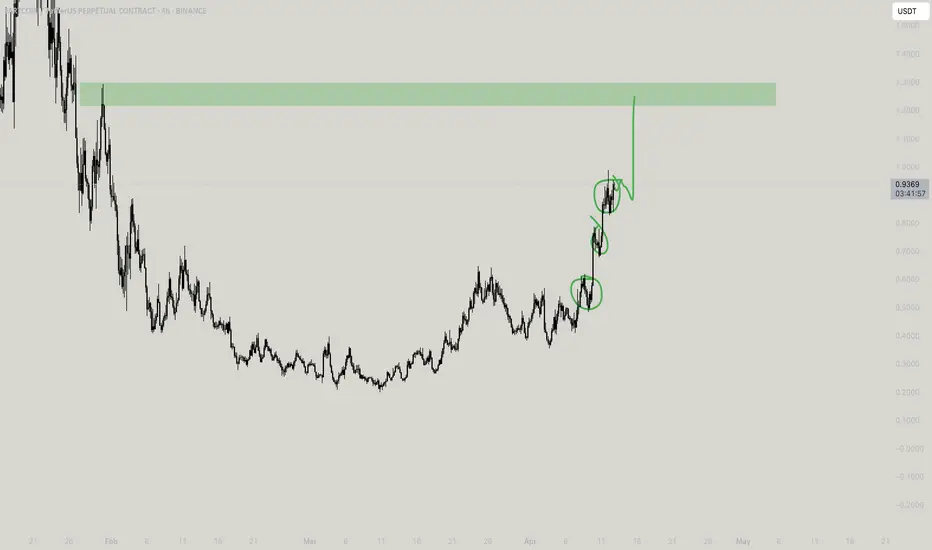
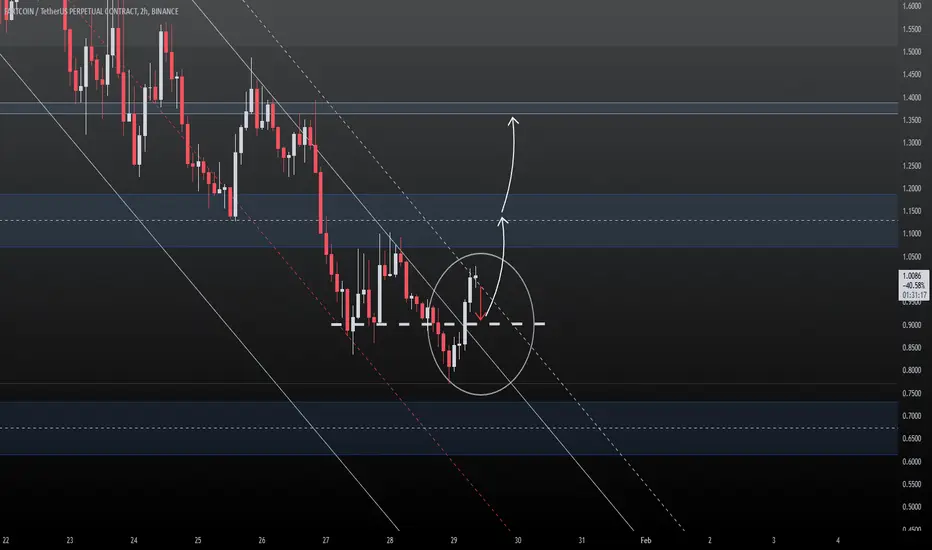
Fartcoin is ready for bullish rallyFartcoin has swept previous liquidity with a daily candle sweep and closed above as green candle, now we need confirmation of 2nd candle closing above this liquidity sweep line as green then its a very good potential buying oppertnity.
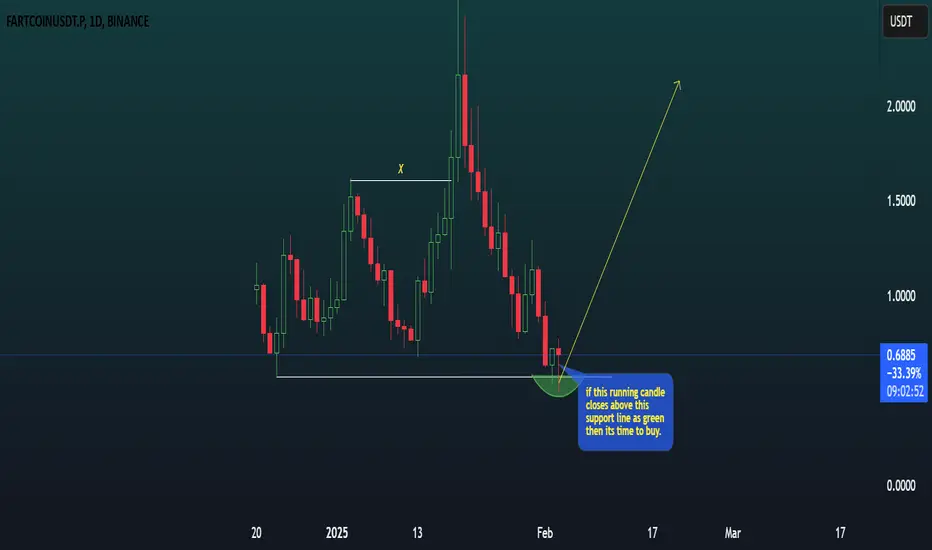
Buy soon There is one major trendline that is gently sloping up in the daily chart. The price seems that it always comes down to the trendline like a magnet and is making higher high.
All momentum indicators in the daily chart show hidden divergence which supports the continuation of the trend.
Daily stochastic has reset and now is moving to the upside from the oversold territory. So, my plan is when MACD enters the bull zone in the 4H chart, I am going to add more to my existing position.
Fartcoin: Navigating the Pullback for a Long EntryGreetings, traders,
I'll forego an extensive analysis of Fartcoin's recent price surge and subsequent pullback. Instead, I'll offer a concise trading suggestion: Following a potential retracement to the $0.91000 area, prepare for a long position entry. Upon confirmation of a renewed uptrend after this correction, consider entering above the $0.96000 level.
Profit targets are set at:
$1.13000
and
$1.36000
Implement a stop-loss order at $0.785, equivalent to your first profit target's distance from your potential entry price, maintaining a 1:1 risk-reward ratio.
Happy trading!
Disclaimer: This analysis is for informational purposes only and should not be considered financial advice. Trading cryptocurrencies involves significant risk, and you could lose some or all of your investment. Conduct your own research and due diligence before making any trading decisions. I am not responsible for any losses incurred.
SHITCOIN - Solana Meme Token - Huge Pump#Shitcoin ( RAYDIUM:SHITCOINSOL_67ZSVE ) is a TRADENATION:SOLANA #Meme #Token.
Yeah, I know, the name says it all.
However, #Shitcoins have been trending lately, especially the ones deployed on the CRYPTOCAP:SOL #Blockchain.
That's why I looked into the mechanics of it...
Billions printed, coded, etc.
If I was gonna' trade #Memes, might as well go with the one that has the ticker: #Shitcoin.
So, by going down the rabbit hole, I became a part-time #Crypto #Degen.
#Chads were #Raiding and I watched RAYDIUM:SHITCOINSOL_67ZSVE.USD #Pump to 24 Mil #MarketCap (MC) in 2 days.
This literally blew my mind.
After all that, it tanked back to 500K MC, but that's quite normal with these #Memes.
People cashed in, sold at the tops, reentering at the bottoms again.
Friendly Warning on CRYPTOCAP:SOL #Memes
DYOR is a must in the CRYPTOCAP:SOL #Meme Ecosystem, so I did my due diligence.
Many #Rugs, a lot of uncertainty, scams all over bro...
* this idea is not advice, trading #SOL #Memes is dangerous!
What ticked my boxes for #Shitcoin ( RAYDIUM:SHITCOINSOL_67ZSVE.USD )
- 10K+ Holders
- Active X & TG Community
- Token Functionality
* Main aspect:
Same Developer (DEV) as the infamous MEXC:FARTCOINUSDT , #ATH at 2.6 Billion.
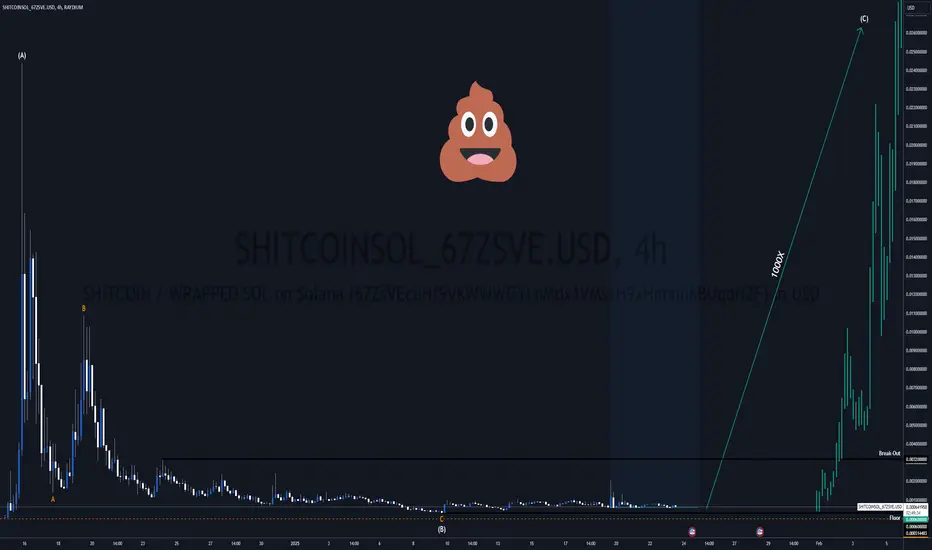
#Shitcoin #TechnicalAnalysis
- Intermediate Wave (B) (white): Complete
- #ElliottWave #Impulse: Wave 1 Complete
- #EndingDiagonal: Complete
- #Oversold with #BullishDivergence
- Fractal Pattern
Expectations:
Intermediate Impulse Wave (C) (white) to commence.
That is because the #Altseaon and #Altcoins are about to start booming.
CRYPTOCAP:BTC.D shall make the #Correction, while CRYPTOCAP:TOTAL3 will spike.
* more details about this in the related ideas below.
My RAYDIUM:SHITCOINSOL_67ZSVE.USD #HODL Levels
- Entry @ 600K MC (0.0006 USD)
- TP1 @ 10 mil MC (0.01 USD)
- TP2 @ 20 mil MC (0.02 USD)
- TP3 @ 30 mil MC (0.03 USD)
- TP4 @ 40 mil MC (0.04 USD)
- TP5 @ 50 mil MC (0.05 USD)
Good luck Chad!
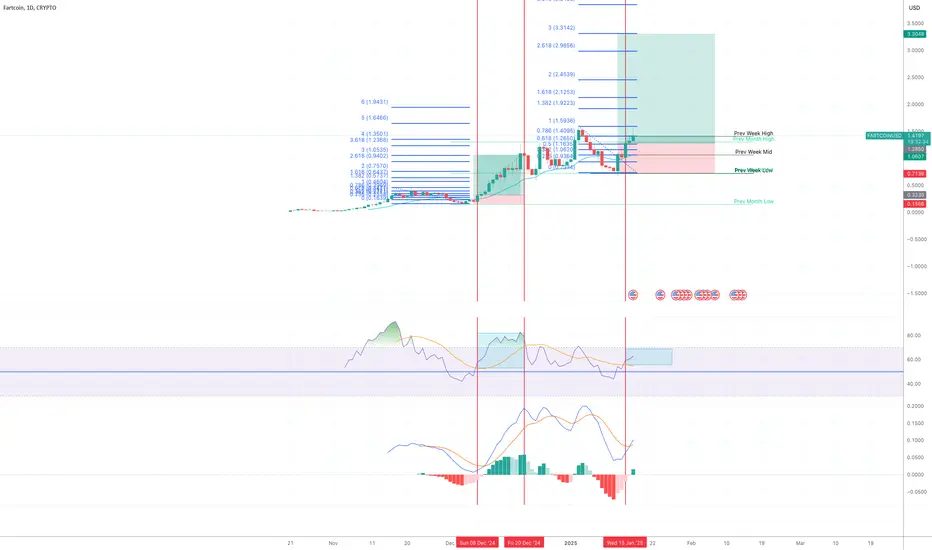
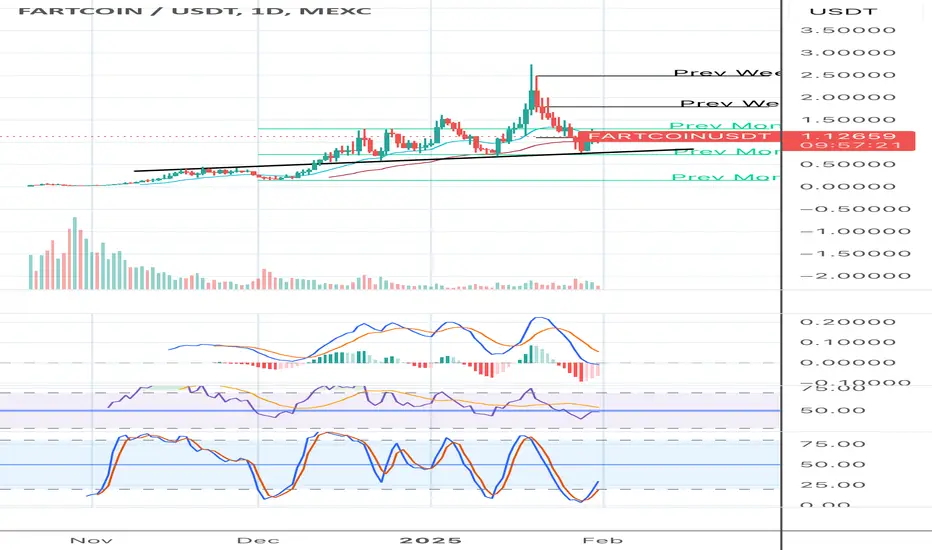
Simple trading idea for long position with RSI and FibI have a bag of Fartcoin. I am planning to hold it for a while, but there is one possible trade idea using RSI in the daily chart.
On Dec 8th, RSI lines cross to the upside in the bull zone and the price continue to go up until RSI lines reached the overbought territory and crossed to the downside. If you opened a long position at the close of Dec 8th's candle and closed at the close of Dec 20th's candle, the risk reward ratio was 1:3.
The same set up just appeared two days ago. RSI lines crossed in the bullzone. MACD lines have also crossed and the first green histogram appeared as well, which is pretty bullish.
If you are interested in swing trading it, you can open a long position now with stop loss just below the previous week low and profit target at $2.97. It will be a risk reward ratio of 1:3. You can also take profit in stages according to the Fib extension levels - 1.618, 2, 2.618 and 3.
It is just an idea.