FB- how can they guide higher? I say they cannotFacebook is not cool anymore, the next generation isn't interested in anything their parents and grandparents are part of. TikTok has been eating Youtube, FB, IG, Reels lunch. Russia blocked FB 71 million and IG over 80 million accounts. AAPL's tracking software has hindered Facebooks ability to target advertising. The metaverse, whatever that will become is eating up billions of FB profit on something we don't know how they can monetize. Inflation is squeezing the middle class which will cause business income to fall, which means less advertising on platforms like Facebook. Puchased 25 May 27th $170 puts. I know the stock is down a lot already, but, so was NFLX which stil hasn't found a bottom. FB is at support, I doubt it will hold. GL
FB

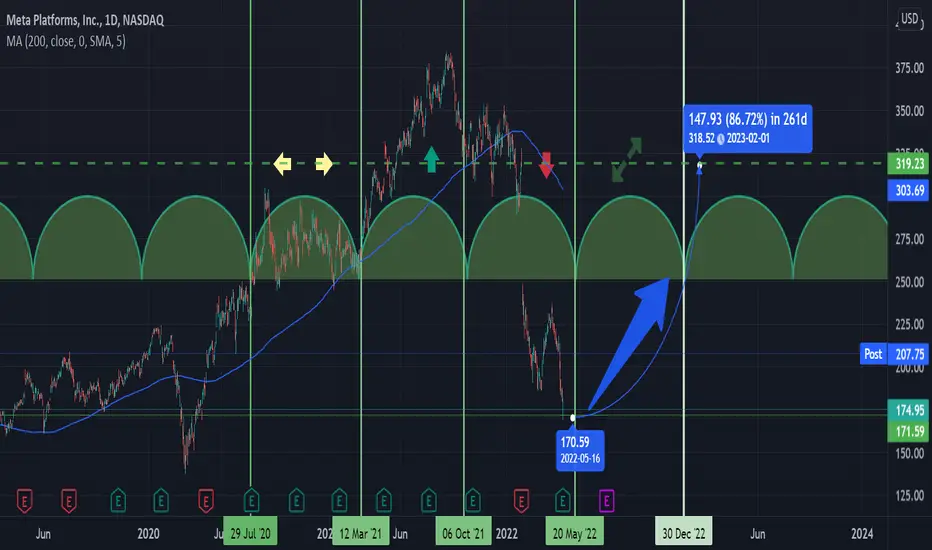
FB-Huge upside move comingNASDAQ:FB
Meta Quarterly Results Beat On Earnings But Short On Revenue
Meta Platforms stock jumped as the social media company reported first-quarter results after the market close that beat earnings estimates, but missed on revenue . Facebook’s main social network added more users than projected in the first quarter, potentially staving off concerns that the company is losing momentum as a new generation flocks to younger sites like TikTok.
And when they own 80% of the world's internet population you are pretty saturated, so the temporary decline in the active users shouldn't be treated as a big thread and the 170-200 diapason is a fair value to buy a piece of this giant with possibly more than 50% upside move to the path which can be reached within a year. And the big investment they made into Metaverse still needs time as it is not something that is going to develop in the next quarter or next year. It is a five to ten-year evolution and when this investment starts finally bring revenue it will be a unique asset to the company just as Warren Buffett says successful investments are often companies that are low-cost producers or that own powerful brands.
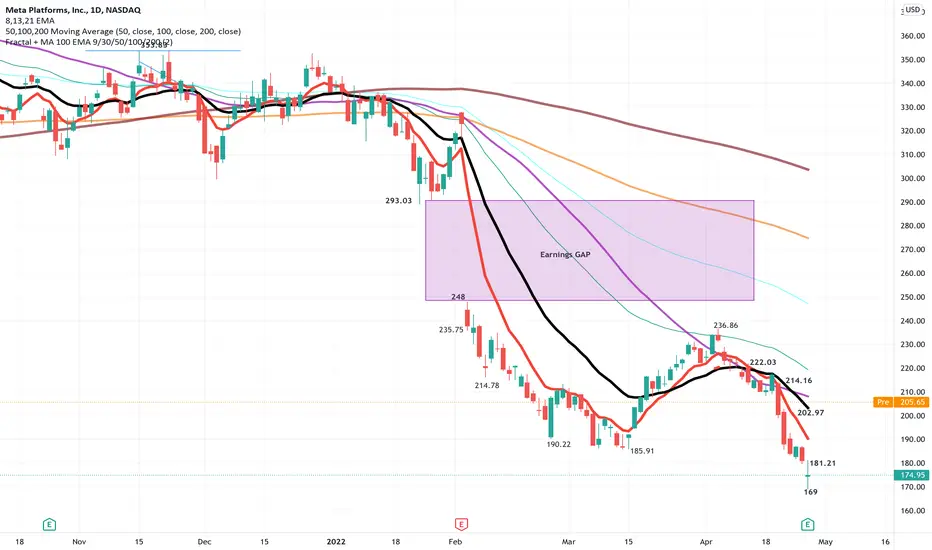
$FB post earnings$FB posted its worst growth since the IPO but managed to beat on revenue as it cut costs during the quarter. Revenue came in lighter than expected. Shares got a boost after hours and our $190 calls will be a big winner. For the next period see if it can stabilize above $200. Next resistance area $214-220
Sell FaceBook I am selling shares on Facebook for several reasons.
We have a good level of repulsion.
We have a breakthrough to the previous bottom
We can collect from $ 20 to $ 40 per share
Beginning of an End - E.3This is not what you invest on for long-term (not even short-term).
"Gas" price and people returning to "restaurants" left no future for Uber, the chart proves.
Expected 33% Gains for FB - Meta Platforms - 4H Analysis
Fb Looking like going long after breaking structure Facebook will going back to sell zone as red rectangle - don't miss this gain on Meta platforms
Let Me Know In The Comment Section Below If You Have Any Questions & Also Looking forward to read your opinion about it

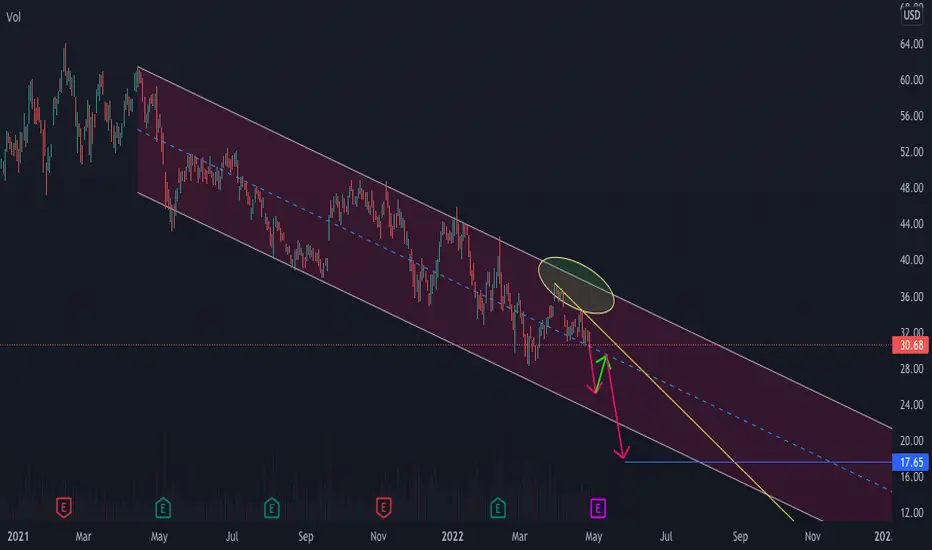
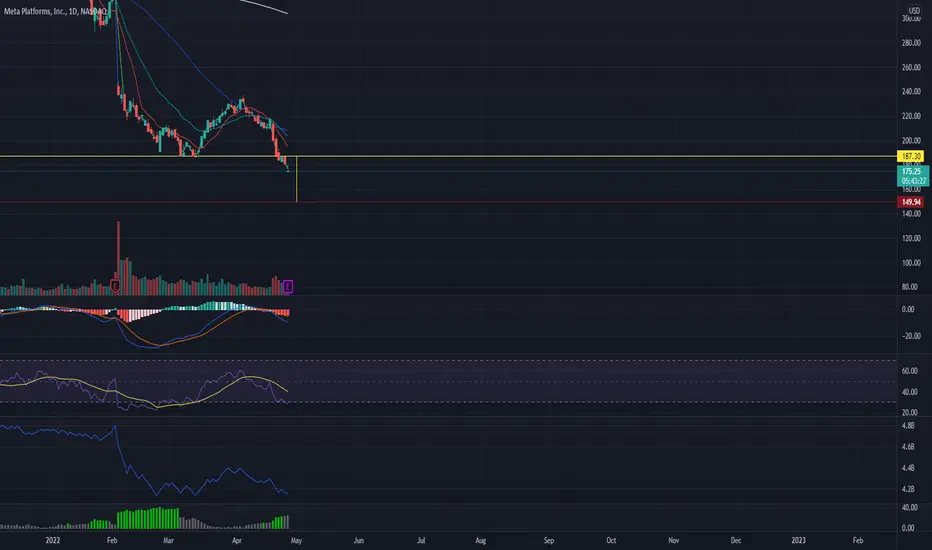
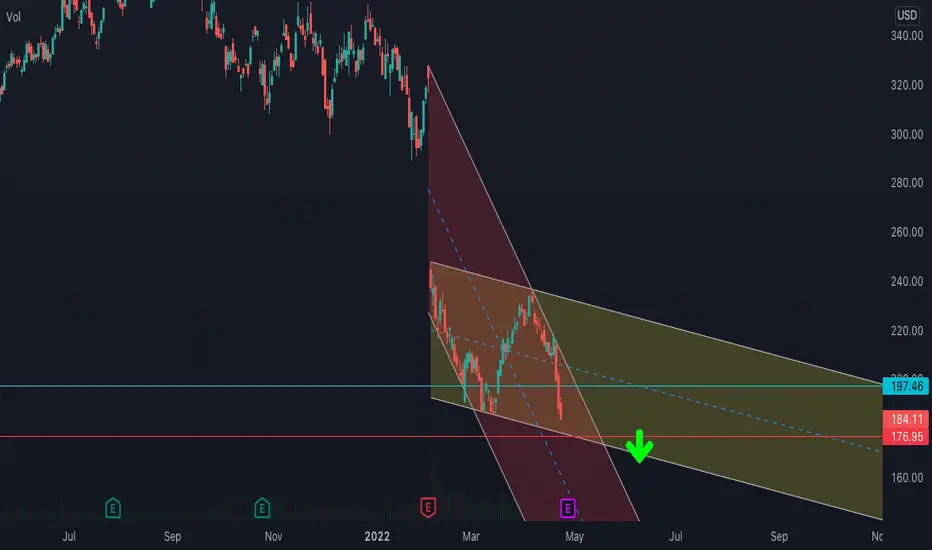
Update of FBIt's gone, this chart won't return upward again, crossed down lower bond of yellow channel and keeps falling until the middle of red channel. No entry at above 150.

Time to go against the grain of the general public with FacebookTime to go against the grain of the general public with Facebook #FB. I’ve been sharing my bullishness on Facebook and Metaverse on Twitter and through some of my videos. Many are focusing on Facebook through an advertising vehicle, but there is much more than what meets the eye. Just like the bullishness we shared on MSFT yesterday in trade alerts and recapping in our videos last night and this morning with the 282 targets - it was the evolution of Azure and the Mesh applications that we focused on. With Facebook, we carry the same principles of focusing on what many are not – expansion of services and areas least understood or passed to the side. I expect Facebook to expand on the Metaverse conversation and provide highlights into potential partnerships, service capabilities. Etc.
At the end of the day it matters how the markets react and not what the earning and call is all about. Nevertheless, I expect the markets to reward Facebook. There are significant comparisons of Facebook to Google and I believe that is a mistake by analysts.
In any case….
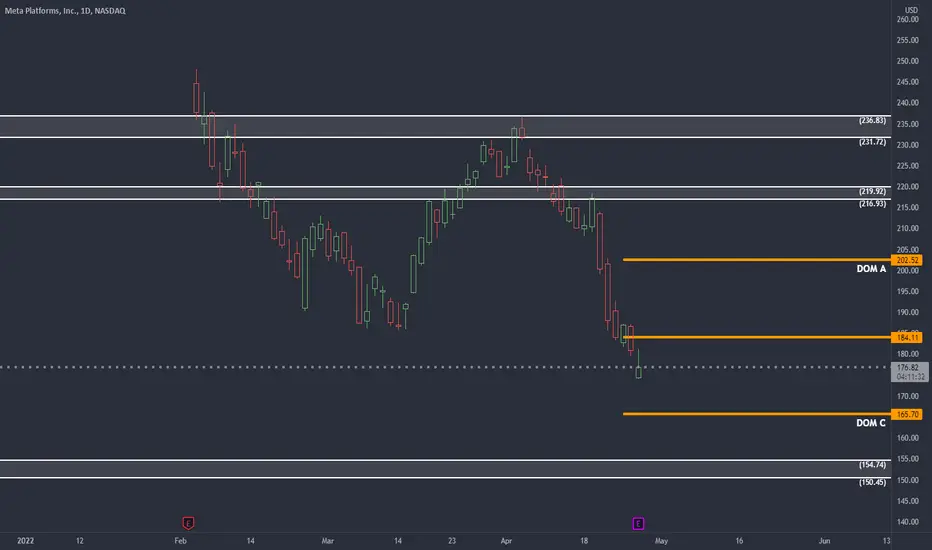
Bullish Target 1 is 216.93 to 219.92; Target 2 is 231.72 to 236.83
Bearish Target is 150.45 to 154.75
If the bottom is breached (bearish target) we would expect the price to close above 165.70 before the end of the week and back up towards 184.11.
Facebook $150 SupportFacebook has gap fill at $150 per share.
Disclaimer: Stratford Research newsletters reflect the research and opinions of only the authors who are associated persons of Stratford Consulting Ltd. The newsletters are for informational purposes only and are not a recommendation of an investment strategy or recommendation to buy or sell any security or digital asset (cryptocurrency, etc.) in any account. The information provided within the newsletters is not intended to serve as the basis for any investment decision. Any third-party information provided therein does not reflect the views of Stratford Consulting Ltd. or any of its subsidiaries or affiliates. All investments involve risk including the loss of principal and past performance does not guarantee future results.
Beginning of an End / UpdateAs forecasted, Tesla crossed down the resistance bond (in post market). It may fall below 850 by the end of this week.
Late May at around $730 is good for buying (short-term view).

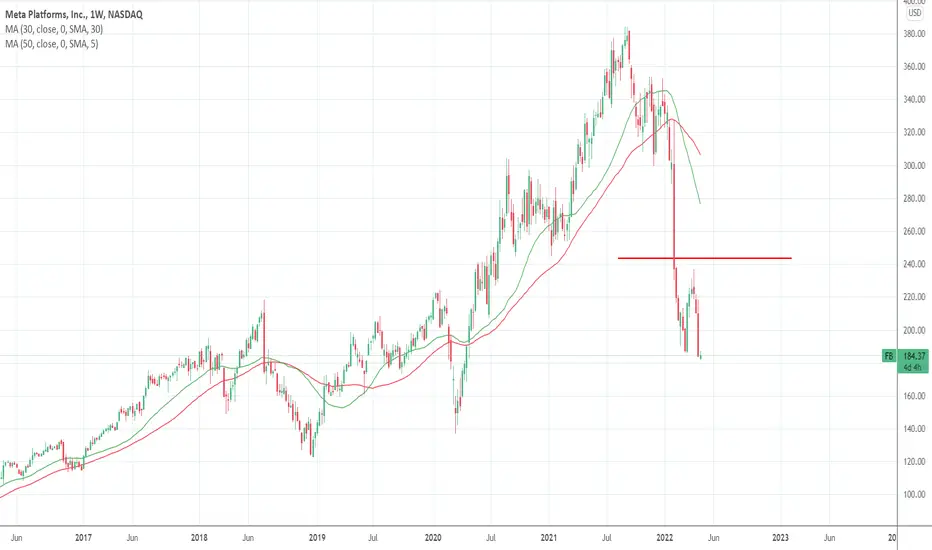
FACEBOOK FORCAST - on the weekly chart : the price reaches a very strong support level
- on the daily chart : yestrday candle was green and today the price shows a slight rejection from underneath that could make a good wick and gives a buying opportunity
- personal opinion : we gonna have a perfect opportunity to entre as buyers due to that very strong support level that we saw previosly massive effects on the price
- best move : wait a little longer for the price to climb above the level and give us a confirmation candle

More than %50 in one month!A dramatic sharp increase is expected, recommended for mid-term, growing up to around 30-35.

What Next?They say it's gonna be a private company BUT here is how I foresee its future:
Twitter has a landmark position between $55 - $58. I don't think it can cross $58. It probably return downward at after $56, if it happens then it will be another "Beginning of an End"; But if it crosses $58 then congrats to whoever bought it!
#pessimistic .

FB sitting right on support -I am looking to see how Price reacts around this support at open and then will make a decision to either wait for a solid pull back or to play the break right away
-We most likely will see a little bit of a pullback it depends on how huge the selling pressure is

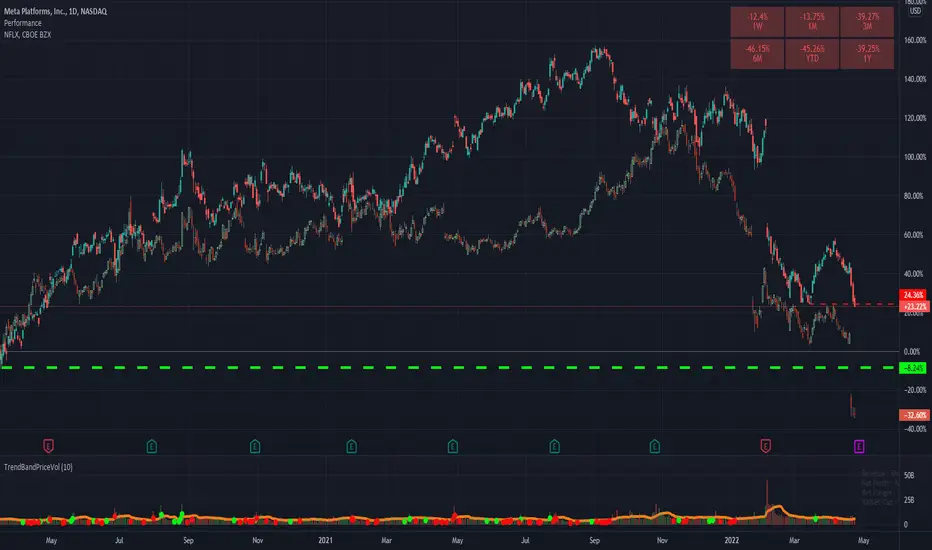
p-value 0.0005The positive correlation between these 2 charts is so high to ignore in the post-pandemic era..!
Although predicting the outcome of earnings and market reaction to that is very hard, Meta (Facebook) could follow Netflix and disappoint the shareholders..!
From a statistical point of view P-value of 0.0005 in the past 529 trading days means, you are looking at the same chart..!
Education:
"A p-value is a statistical measurement used to validate a hypothesis against observed data. A p-value measures the probability of obtaining the observed results, assuming that the null hypothesis is true. The lower the p-value, the greater the statistical significance of the observed difference."(Investopedia)
Best,
Dr. Moshkelgosha M.D
DISCLAIMER
I’m not a certified financial planner/advisor, a certified financial analyst, an economist, a CPA, an accountant, or a lawyer. I’m not a finance professional through formal education. The contents on this site are for informational purposes only and do not constitute financial, accounting, or legal advice. I can’t promise that the information shared on my posts is appropriate for you or anyone else. By using this site, you agree to hold me harmless from any ramifications, financial or otherwise, that occur to you as a result of acting on information found on this site.
Beginning of an End E.2Wait for Facebook to dive below 176. Once that happen just sell and run away, this chart never goes up again.
Facebook 5-0 harmonic pattern Facebook maybe make 5-0 bullish harmonic pattern
we will see next week

Will Facebook surprise investors?$FB has been battered and bruised in the past 6 months as its stock price almost halved. The company reports earnings next week and the stock just broke below the recent yearly lows. It is still one of the cheapest big tech stocks on the market. In case of favorable results and guidance a bounce to $210-220 is in play given how oversold this stock has been. If it does a move a la $NFLX, the next big support area is $135-40

SPX Daily CloudSPX daily bouncing on a massive cloud. This is an absolute must hold for the market...


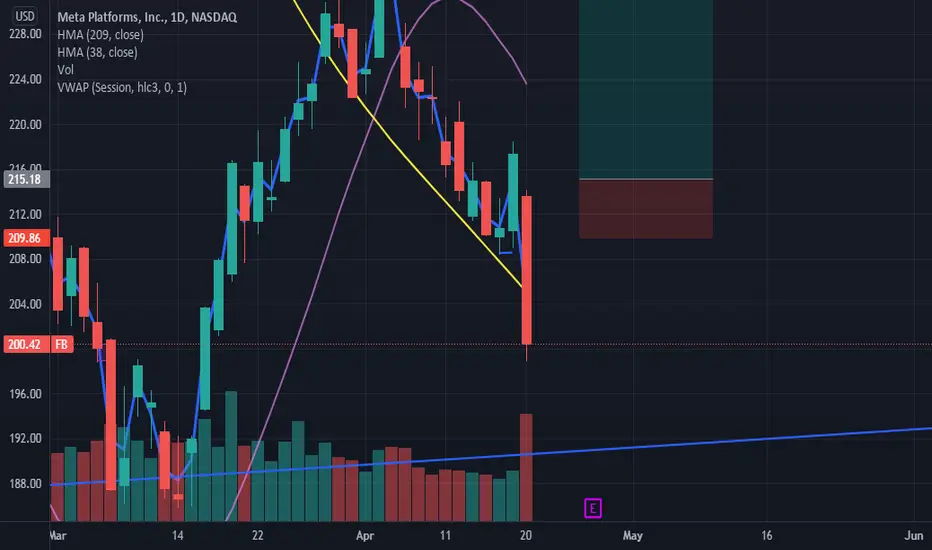
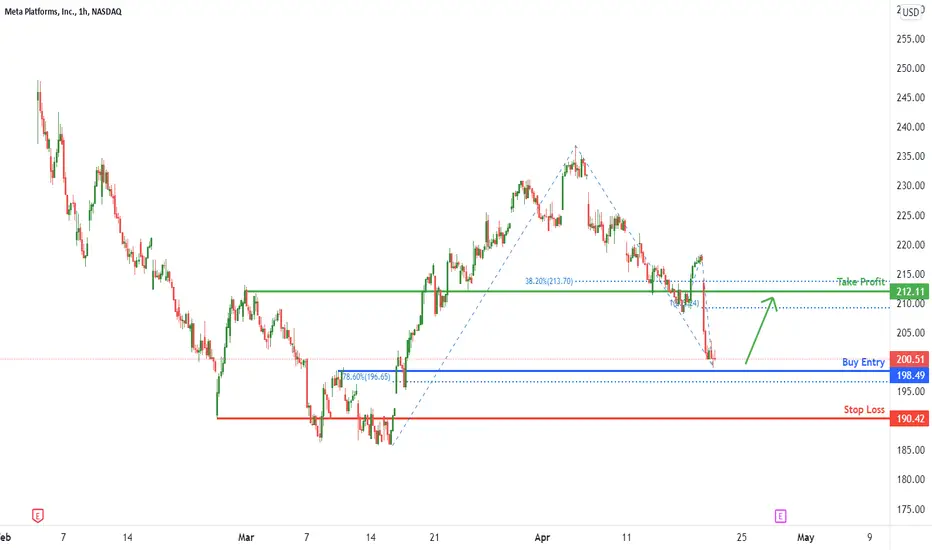
FB Potential For Bullish Bounce | 21st April 2022Price is near to the key pivot level. We can see a potential for bullish bounce from buy entry level of 198.49 which lines up with 78.6% Fibonacci retracement towards the take profit level of 212.11 which lines up with 38.2% Fibonacci retracement and 100% Fibonacci projection . Otherwise, price might break through key pivot structure and head towards the stop loss level of 190.42 which is a previous horizontal swing low support.
Any opinions, news, research, analyses, prices, other information, or links to third-party sites contained on this website are provided on an "as-is" basis, as general market commentary, and do not constitute investment advice. The market commentary has not been prepared in accordance with legal requirements designed to promote the independence of investment research, and it is therefore not subject to any prohibition on dealing ahead of dissemination. Although this commentary is not produced by an independent source, FXCM takes all sufficient steps to eliminate or prevent any conflicts of interest arising out of the production and dissemination of this communication. The employees of FXCM commit to acting in the clients' best interests and represent their views without misleading, deceiving, or otherwise impairing the clients' ability to make informed investment decisions. For more information about the FXCM's internal organizational and administrative arrangements for the prevention of conflicts, please refer to the Firms' Managing Conflicts Policy. Please ensure that you read and understand our Full Disclaimer and Liability provision concerning the foregoing Information, which can be accessed on the website.
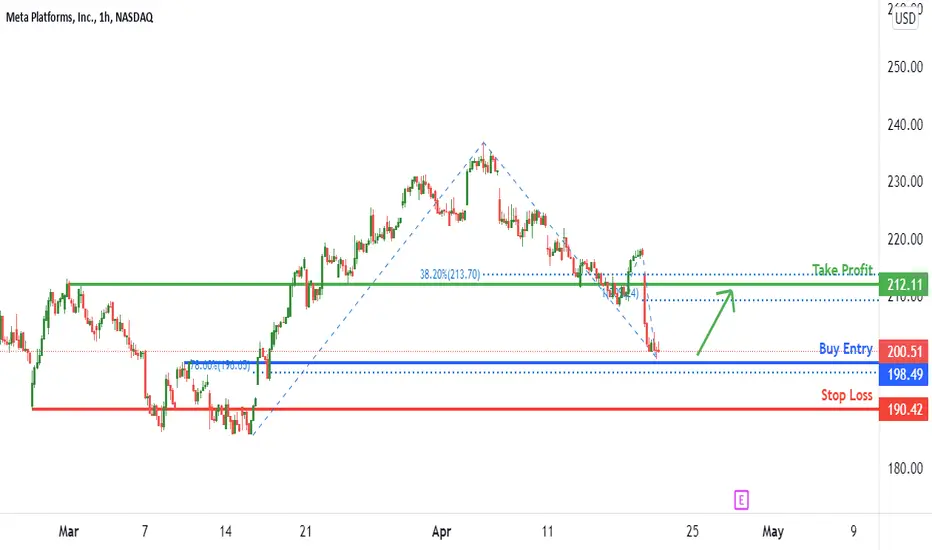
FB Potential For Bullish Bounce | 21st April 2022Price is near to the key pivot level. We can see a potential for bullish bounce from buy entry level of 198.49 which lines up with 78.6% Fibonacci retracement towards the take profit level of 212.11 which lines up with 38.2% Fibonacci retracement and 100% Fibonacci projection. Otherwise, price might break through key pivot structure and head towards the stop loss level of 190.42 which is a previous horizontal swing low support.
Any opinions, news, research, analyses, prices, other information, or links to third-party sites contained on this website are provided on an "as-is" basis, as general market commentary, and do not constitute investment advice. The market commentary has not been prepared in accordance with legal requirements designed to promote the independence of investment research, and it is therefore not subject to any prohibition on dealing ahead of dissemination. Although this commentary is not produced by an independent source, FXCM takes all sufficient steps to eliminate or prevent any conflicts of interest arising out of the production and dissemination of this communication. The employees of FXCM commit to acting in the clients' best interests and represent their views without misleading, deceiving, or otherwise impairing the clients' ability to make informed investment decisions. For more information about the FXCM's internal organizational and administrative arrangements for the prevention of conflicts, please refer to the Firms' Managing Conflicts Policy. Please ensure that you read and understand our Full Disclaimer and Liability provision concerning the foregoing Information, which can be accessed on the website.
FACEBOOK UPDATE- one the daily chart : a catastrophic day , the price made a massive dive hits the stop loss after giving us good signal of buying
- personnal opinion : the massive red candle with a big volume could be a signs that the buyers from before took their profits and a new uptrend will start
- best move : dont do anthing until the outcume of the dive becme clear