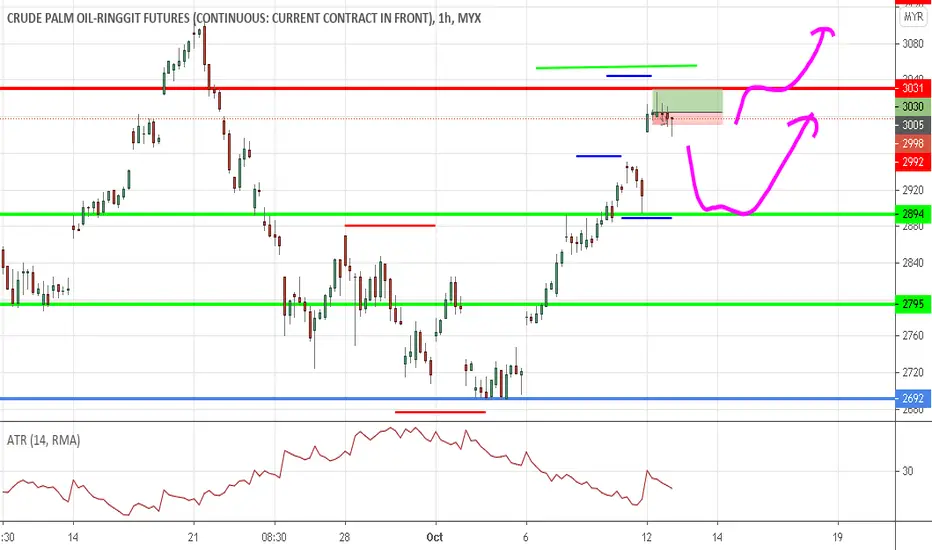
FCPO TRADING : 204) uptrend, long on retracementthis is haidojo and the number is 204 ...
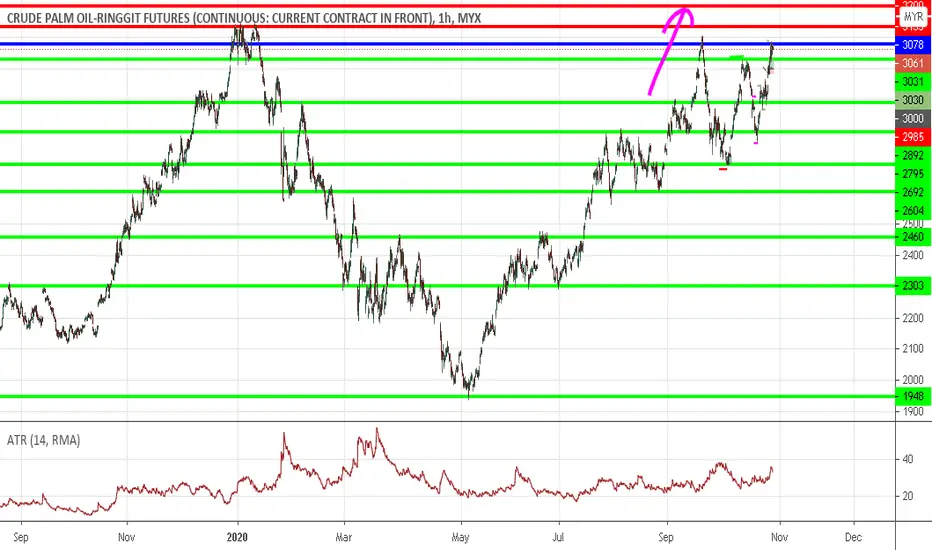
fcpo-jan has broken into new structure high and higher low...so it is easy to identify this as a signal of uptrend persists...
so the best strategy is to long on retracement...but beware of the retracement...could fall below some support...
higher resistance : 3200
strong resistance : 3100-3130 (abv this level is fastlane; crazy bull)
immediate support : 3030
lower support : 2900
WARNING!
RISK DISCLAIMER : this is juz a trading idea...trading stocks, futures or forex might incur a huge risk to your account/funds… DON’T LOSE MONEY THAT YOU CANNOT AFFORD …any idea(s) of trading in this episode SHALL NOT be regarded as a hint of BUYING or SELLING . It is MERELY a trading journal and it has been used for educational purpose only… trade at your own risk!
**your "LIKE" and "FOLLOW" are my main source of motivation to continue posting more valuable contents...TQ
Fcpo
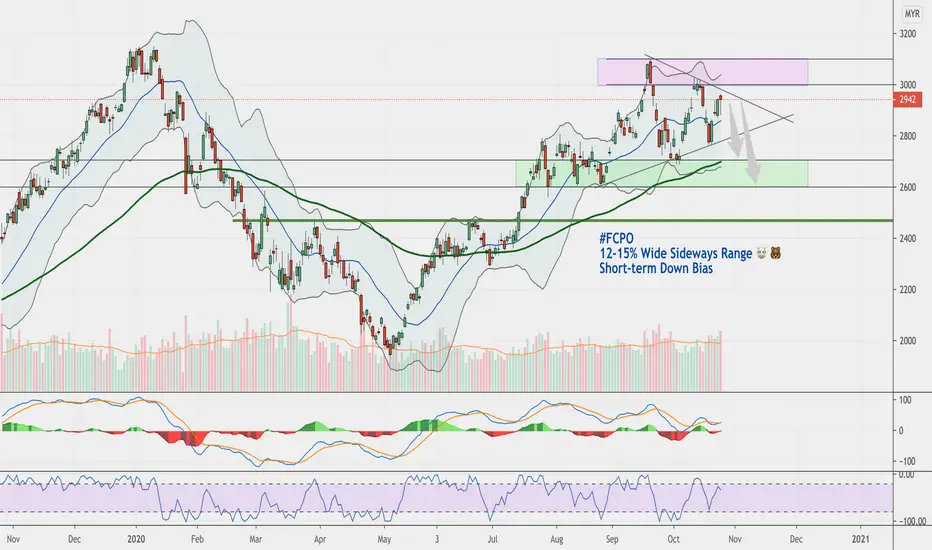
Oct26: FCPO (1D) Wide Sideways, Bear to Test Range Lows 2700..📉Price oscillating within wide 12-15% flat sideways range. 🐻🐮
From here, more likely to retest range lows: 2700 ; 2600... 📉
Watch for potential breakouts from range❗️
Happy Hunting! 🥂🚀
-jk-
Live FCPO Trade - 26 Oct'20- Market opened on widespread downbar on VSI with no gaps before continue its Sideway move.
- After 3:00pm, we see some activity with price breakthrough the Resistance (which was the old Support @ 2995) on VSI and also on Green Pentagon. We expect price to do a Pullback before moving up further.
- I placed my EP at 2995 and was triggered within less than 1 minute.
- After that, I set my TP @ 12pts and SL @ 6pts. As a precautionary measure, I also draw a line @ 3003 as a safety line for me to take profit should the price failed to move higher than that.
- Price shoot up the next bar and eventually hit my TP of 12pts.

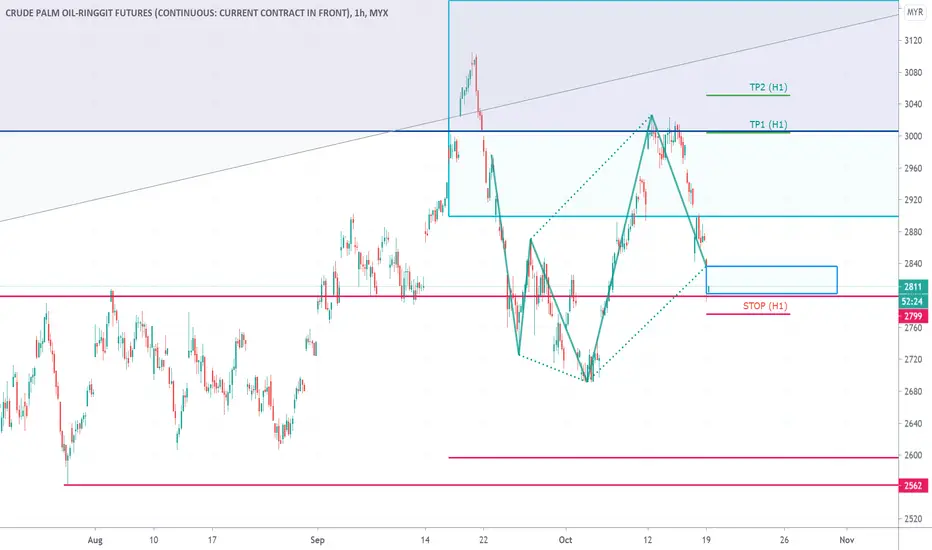
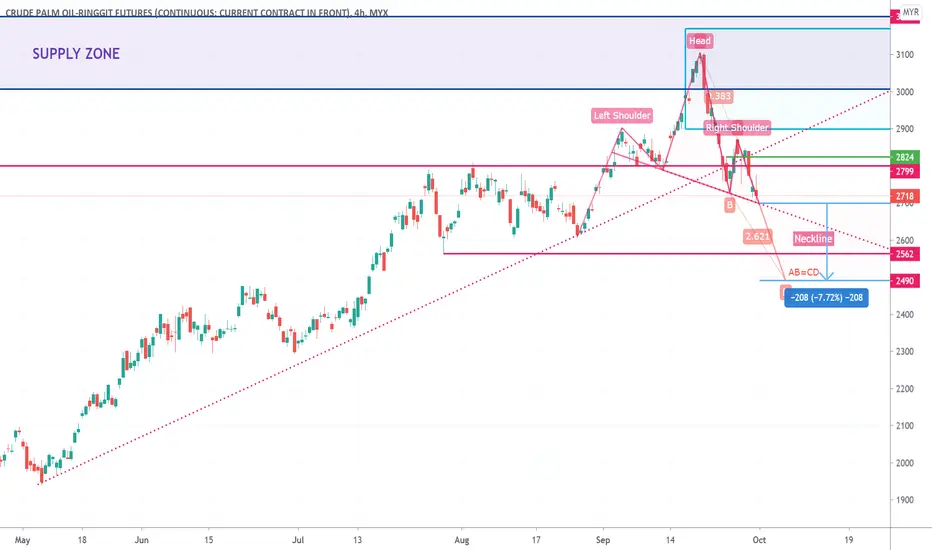
FCPO - The deck of 2800 The price of FCPO climbed above 3000 after it failed to establish the reciprocal head & shoulder from the previous call. Price touched the supply zone (violet box) again. However price rejected and fell to 2800 psychology level.
In a short term view, the price may hovering with a bullish 5-0 harmonic pattern identified supported on the level of 2800. A potential to go for a long order if the price action tested the stop and reversal toward the range of 2800 - 2836 (Smaller blue box) with a first target price of 3004 and second of 3051.
FCPO TRADING : 203) uptrend, shoot-up or advanced patt4rn?this is haidojo and the number is 203 ...
based on the recent reaction, I bet fcpo-jan will shoot-up, hehe...of course, that is my biased view and opinion...
the correct way to deal with prediction is actually...if your prediction hits the bull, go ride on it...if you are correct, make some money,
get away...if it doesn't, make sure to cut your loss and make it small...
REMEMBER, ALL BIG LOSES START WITH SMALL ONES...! cut them off before they turn big...
forget abt being RIGHT ALL THE TIME! this magic isn't exist! I know how many marketers/gurus out there are going to tell you that they have magical wand that is going to make winning trades as high as 90% or more...! it is your choice to believe that...I used to believe that too...until...
HAIZ...the point is, dun get too carried away by the sense of right or wrong, make sure you can make some money in the market if you are right,
if you are wrong, dun lose it all...survive until you can ride on the next streaks of winners...
so happy trading, gud luck!
strong resistance : 3030-3130 (abv this level is fastlane; crazy bull)
immediate support : 2870-2900
lower support : 2764-2800
WARNING!
RISK DISCLAIMER : this is juz a trading idea...trading stocks, futures or forex might incur a huge risk to your account/funds… DON’T LOSE MONEY THAT YOU CANNOT AFFORD …any idea(s) of trading in this episode SHALL NOT be regarded as a hint of BUYING or SELLING . It is MERELY a trading journal and it has been used for educational purpose only… trade at your own risk!
**your "LIKE" and "FOLLOW" are my main source of motivation to continue posting more valuable contents...TQ

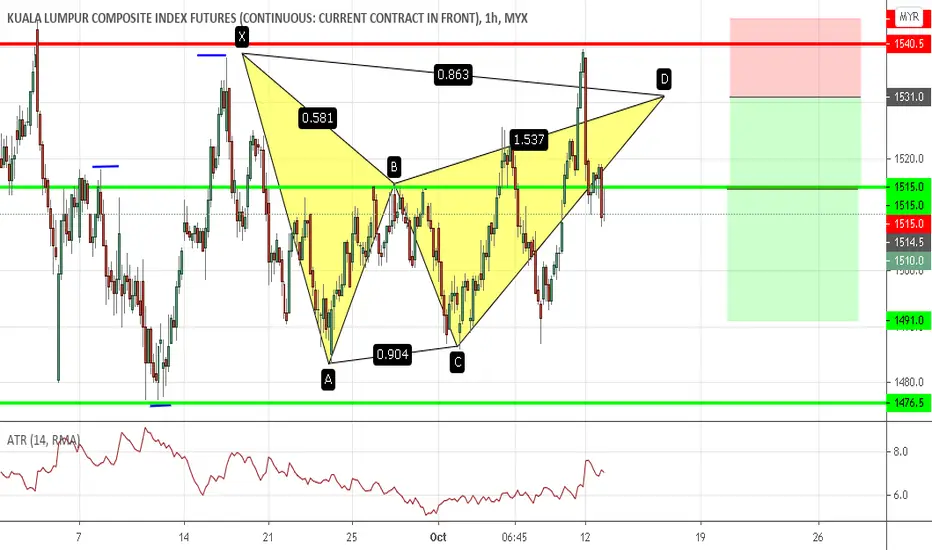
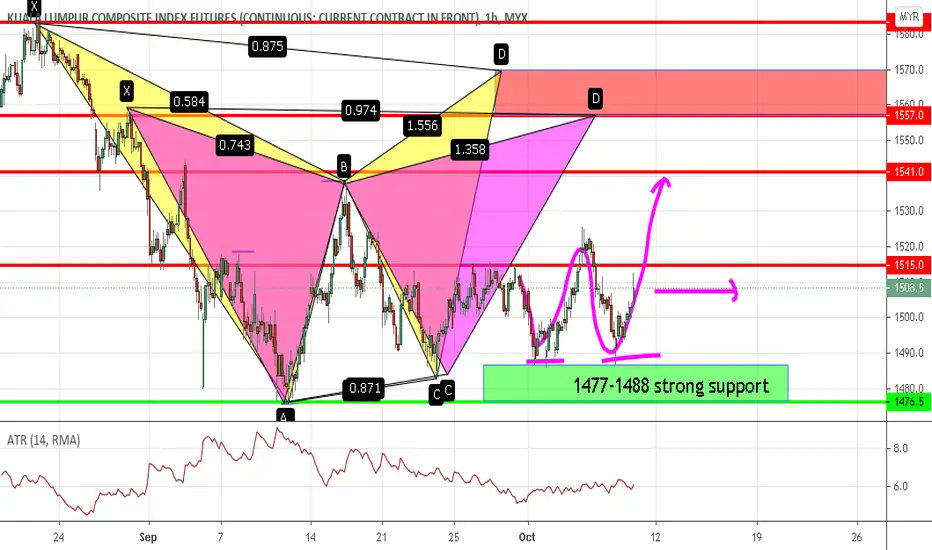
FKLI TRADING : 202) bat pattern hits tp after a long 2 weeksthis is trade 202 frm haidojo trading...
I have been holding a position since 9th Oct 2020...an advanced pattern and bearish bat pattern...
this bat pattern finally reaches its tp tdy...that is one of the longest hold ever...period...
now, I am expecting the market to push further downward to the critical support and also our neckline-1477...
with the covid-19 cases rebound and further mco activation...I bet the market might slide lower below the neckline...
higher-resistance : 1557-1570 ( bearish bat and gartley patterns)
resistance : 1531-1540
immediate resistance : 1500-1515
support : 1477-1488 (below this is confirmation of Downtrend)
lower support : 1446-1413
WARNING!
RISK DISCLAIMER : this is juz a trading idea...trading stocks, futures or forex might incur a huge risk to your account/funds… DON’T LOSE MONEY THAT YOU CANNOT AFFORD …any idea(s) of trading in this episode SHALL NOT be regarded as a hint of BUYING or SELLING . It is MERELY a trading journal and it has been used for educational purpose only… trade at your own risk!
**your "LIKE" and "FOLLOW" are my main source of motivation to continue posting more valuable contents...TQ*

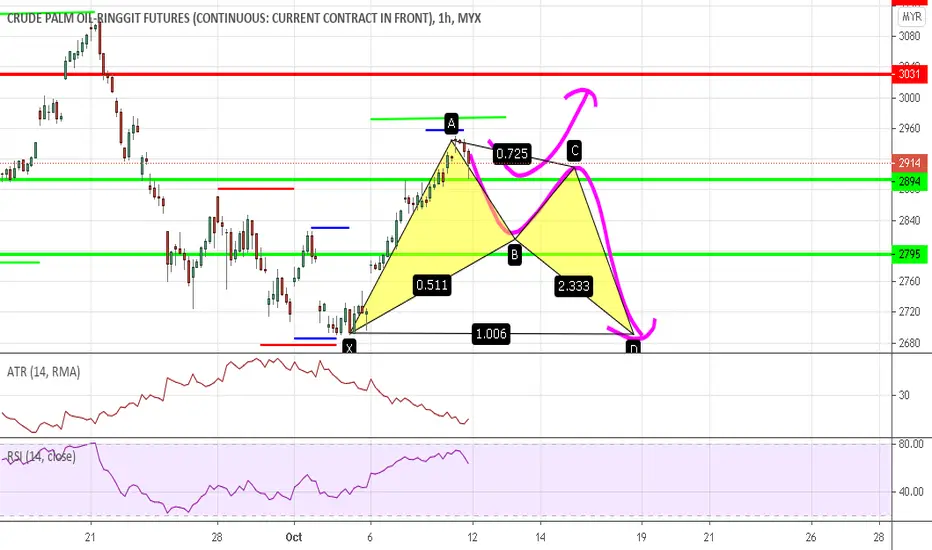
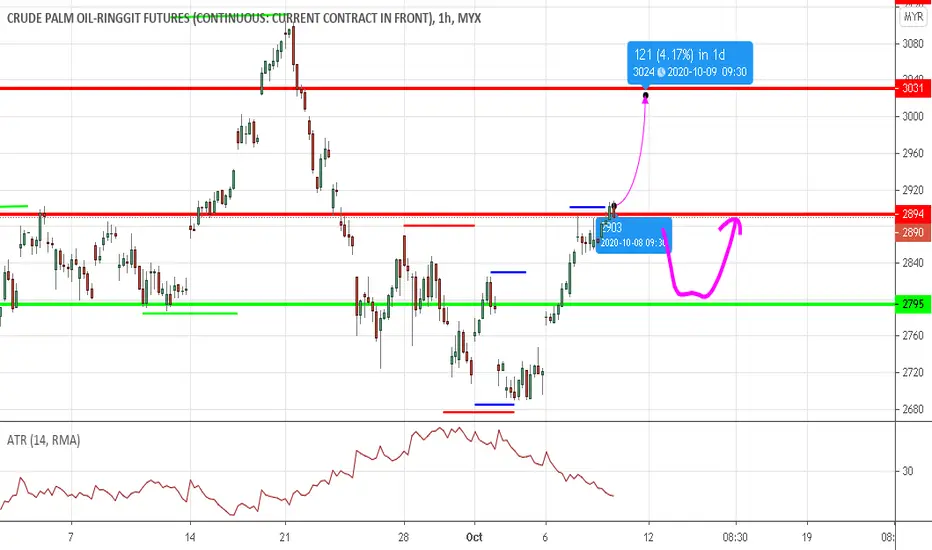
FCPO TRADING : 201) uptrend, shoot-up or advanced patt4rn?this is haidojo and the number is 201 ...
seems like our fcpo-jan has regained its momentum in the uptrend...
so, whether it will slowly glide upward with some advanced patterns formation or shoot-up straight away is unknown...
if u are trading on breakout...keep your eyes open...
i revise the strong resistance frm the current 3030-3100 to 3030-3130...because that is the limit in its previous challenge...
strong resistance : 3030-3130 (abv this level is fastlane; crazy bull)
immediate support : 2870-2900
lower support : 2764-2800
WARNING!
RISK DISCLAIMER : this is juz a trading idea...trading stocks, futures or forex might incur a huge risk to your account/funds… DON’T LOSE MONEY THAT YOU CANNOT AFFORD …any idea(s) of trading in this episode SHALL NOT be regarded as a hint of BUYING or SELLING . It is MERELY a trading journal and it has been used for educational purpose only… trade at your own risk!
**your "LIKE" and "FOLLOW" are my main source of motivation to continue posting more valuable contents...TQ

FCPO TRADING : 199) short on reboundthis is haidojo and the number is 199 ...
the number is closing to 200...i am still bound at home...fractured-ribs because of motorcycle accident...
fcpo-jan now...it has turned into a sideway market...waiting for new breakout...or advanced patterns formation...
strong resistance : 3030-3100 (abv this level is fastlane; crazy bull)
immediate resistance : 2894-2900
support : 2770-2795
WARNING!
RISK DISCLAIMER : this is juz a trading idea...trading stocks, futures or forex might incur a huge risk to your account/funds… DON’T LOSE MONEY THAT YOU CANNOT AFFORD …any idea(s) of trading in this episode SHALL NOT be regarded as a hint of BUYING or SELLING . It is MERELY a trading journal and it has been used for educational purpose only… trade at your own risk!
**your "LIKE" and "FOLLOW" are my main source of motivation to continue posting more valuable contents...TQ

Weekend Update – 18 Oct 20 | FCPO, Soybean, Soybean Oil, FXWeekend Market Update – 18 Oct 2020 | FCPO, Soybean, Soybean Oil, Currencies and Others
Take note that the updates here are 2 days late. If you would like the latest updates, please visit palmanalysis dot com
Review
Let’s start the report with a review of the past 2 weeks.
1) In my last update on the 4th Oct, I expected:
On Soybean
i. On Point 13 ii, I favored slightly higher Soybean prices due to the relative strength, and we did see higher prices in the 3rd week of Oct, and prices had a pullback last week.
On Soybean Oil
ii. On Point 46 ii, for Soybean oil to complete its second leg down and if the support at 31-29 holds and to see the strength in the subsequent bounce
iia. Price found support at 31.50 and had a good bounce. It then had a slight pullback last week.
On FCPO
iii. On Point 46 iii, To see FCPO 2 legged pullback to 2800-2650-00, and then a re-test higher, and would want to see if the re-test of the highs is strong or weak .
iiia. Price found support at 2690, and the first leg of the re-test was quite strong going back up to 3000 by the 12/13th of Oct. It has pulled back slightly since then.
On RMB and INR
iv. On Point 46 iv, I want to see RMB and INR strengthen – We have that in RMB but INR is Flat
On Dollar Index
v. I expected the Dollar Index to find support around 93-93.50 – Price found support at 93 and had a bounce last week.
You can refer to the Weekend Updates – 4 Oct 2020 | CPO, Soybean, Soybean Oil & Currencies here.
What’s up ahead?
Soybean Monthly
2) In my last update On Point 6, I said that price would attempt to break above the highs of Sept and test the top of the trading range around 1080-1100.
i. Price tested very close with a high in Oct at 1079. Price has pulled back since and price is currently trading in the middle of the month’s range with another half a month to go.
3. i. Bears wants price to close below the middle of the month or as low as possible and to have a candle with a bear body.
ii. Bull on the other hand wants a strong retest of the 1080-1100 top of the multiyear trading range and break strongly above it to test the highs of 2016 around 1170-1200.
Let’s look at the weekly chart.
Soybean Weekly
4) So far prices is still in a tight bull channel which is strength in the buyers.
i. It looks to me that we are forming a spike and channel bull trend, and in the process of forming a wedge push up – with second Oct week push being the second push up in the wedge.
ii. If this is true, we could see another push up in the next 1-2 weeks – the bulls wants a strong close above the 1080 top of the multiyear trading range;
iii. The bears on the other hand wants price to fail at the top of the trading range and reverse down instead.
iv. The current bar is a bear bar but with a big tail below, which is a weak sell signal bar. If price trade below last week’s low, we may see more buyers than sellers below.
5) I do feel the overall global picture is a bit murky at this moment due the the following factors
i. If we have dollar start strengthening in the next 1-2 weeks, it is generally bad for equities and commodities.
ii. However we have to take note that in Sept, the Dollar strengthened and equities fell, but Soybean bucked the trend and went up instead, which is showing relative strength. The story behind the up move was strong demand from China.
iii. So we have to monitor whether a) Dollar continue to strengthen or weaken (weaken is good for commodities like Soybean/ Soybean Oil / Palm) or Strengthen, and b) if strengthen, will Soybean follow into weakness or buck the trend yet again like Sept?
6) For now, as price is still in a tight bull channel, I suspect we may see a little bit more pull back, and then a 3rd leg up to form for the wedge pattern.
Daily Soybean
7) On the Daily chart, we see price consolidating in a small sideways trading range between 1030-1080 in the last 1 and half week.
i. This potentially sets up a final bull flag – which if true, means there should be another small sideways to up leg from here.
8) We do see some bear bar, but no significant selling pressure as there were no consecutive bear bears since Oct started.
i. We will have to monitor on this point to see if selling pressure develops next week.
Soybean Oil Monthly
9) So far Oct is the first pullback following a 5 month micro bull channel. The monthly chart so far is a doji bar which means the bulls and bears are currently in balance around these prices.
i. Notice last month was also a doji bar which means balance around these prices of 32.70-33.30 range.
ii. The bulls wants the monthly bar to close above the middle of the bar, as high as possible, while the bear on the other hand wants prices to close below the middle of the bar and as low as possible.
iii. With 2 more weeks to go, the bars can look very different by the end of the month.
Soybean Oil Weekly
10. Last week closed as a bear bar, which is a sell signal bar for the bears.
i. I think it is fair to say we will see bears attempt to push prices below the low of last week to attempt the second leg down for Soybean Oil which started in Sept. Will they succeed? We have to look at a few other factors such as:
ia. The Dollar
1b. How strong soybean is holding up
ii. If the bears get their way, we may see SBO test back the 31.50.
iii. The bulls on the other hand wants to see the breakout below last week’s low to fail, and then reverse up for a second leg up which started in the second week of Oct.
Soybean Oil Daily
11) So far on the daily chart, it looks to me that the whole of last week was a 2 legged pullback against the stronger 2 legged bull leg which started in Oct 5 to Oct 9.
i. Price is currently consolidating around the 20ema area, which is the average price traders are looking at. Notice that the bounce during the end of Sept also tested this area of 33.
12) Both the bulls and bears look like they each have credible setup.
i. The bears have a double top second leg down sell setup, while;
ii. The bulls have a second leg up from the Oct 5-9 bull leg.
iii. With credible setup for both the bulls and bears, this is classic indication for trading range price action. Neither the bulls nor the bears have a strong edge at the moment.
iv. We will have to look at other factors to give us slightly more information which we will cover below.
Dalian Palm Olein Monthly
13) On the Dalian Palm Olein Chart, so far the monthly chart, price is trading near the lows after gaping up after the long holiday break.
i. Price has a prominent tail above, which also indicates profit taking towards the higher prices traded. Notice last month also had a prominent tail above. It indicates that prices are finding sellers near the high of the multiyear trading range.
ii. With 2 weeks to go, the monthly chart could still look very different from now.
iii. The bears wants price to trade lower and for prices to close with a bear body and a big tail above. That would setup a strong sell for Nov.
iv. Then bulls on the other hand wants the trend which started in May to continue as price is still trading in a bull micro channel.
Let’s look at the weekly chart.
Dalian Palm Olein Weekly
14) Last week closed as a doji looking bar with a small bear body with prominent tails above and below the bar.
i. So far, the bull channel is quite tight, but prices are trading near the top of the multi year trading range.
ii. Price is currently trading near in the middle of the 4-5 weeks sideways trading range which is a sign of balance.
iii. When prices are in a trading range, traders reverse from buying to selling every few days, and credible setup tends to disappoint both the bull and bears.
Not much clarity on the weekly chart too. Let’s see what’s up on the Daily Chart.
Dalian Palm Olein Daily
15) On the daily chart, last Friday traded lower, then back up and closed the day with a prominent tail below.
i. The bulls will be asking if this is the pullback from the Oct leg up, which will be followed by another leg up?
ii. While the bears on the other hand are asking if this is the continuation down for the second leg which started at 22 Sept?
16) I think we need another few more days price action to have more clarity on this.
i. Should price trade back up from here, traders will assume that the sell off from last week was simply a pullback which will be followed with a second leg up.
ii. If price continue to trade lower, then traders will assume that the second leg down from the Sept sell off is resuming.
17) With both a credible buy and sell setup, this is classic trading range price action – the price action disappoint the bulls and bears every few days.
i. I am slightly more leaning towards the bullish case due to the lower palm production this month.
Not much clarity here either. Let’s look at FCPO below.
FCPO Monthly
18) So far on the monthly chart, Oct traded below the low of Sept early in the month and found buyers there.
i. Price is still trading above its middle of the bar, and has a bull body with a tail above. Currently price still slightly favors the bulls.
ii. With 2 more weeks to go, the bar could look very different by the end of the month.
iii. Price still remained in a tight bull channel for now which is a sign of strength for the buyers.
Weekly FCPO
19) Price closed this week as a bear bar, which is a sell signal bar for next week.
i. The bears are looking at last week’s bear bar as the sell signal bar for a second leg down from a double top with Sept’s high.
ii. The bulls on the other hand sees last week’s pullback as the pullback for a second leg up.
iii. Both the bulls and the bears have a credible setup, which is classic trading range price action.
Daily FCPO
20) Price closed as a small bull bar with a prominent tail above.
i. The bears see the 15 Oct sell of as the start of the second leg down from the end of Sept sell off. Another few more day’s price action should give us the clarity we need to see if this second leg fails.
ii. The bulls on the other hand sees last week’s sell of as the pullback from the strong Oct 5 to Oct 12 leg up, and should the bears fail to resume their second leg down next week, the bull will assume their case has more merits and will buy the pullback for a second leg up to retest the highs of the trading range.
Other issues effecting Palm Oil.
21 i. Production trend looks like it is heading lower this month between the range of -5% to -10% or more. This is a bullish factor for the bulls.
ii. Exports for the first 15 days shows slightly down -2% to -3% against Sept, but you have to remember, Sept was up 12-13% against Aug. This means, the exports for Oct is not that bad if compared to Aug levels, just slightly lower than last month.
iii. So far, no significant rain nor flood effecting palm.
Let’s look at the currencies.
Dollar Index – DXY
22) So far the Dollar continued its pullback to 93-93.50 as we have expected. It then bounce last week, trading slightly above 93.50.
i. As I have said previously, a strong dollar is bad for commodities such as SB, SBO, Palm.
ii. Price is currently trading at the bear trend line and I will be monitoring if there is another leg down to test 93 again, before we have a big strong bounce up to 95-96 area, or,
iii. If prices continue to trade up from here. Remember, a strong Dollar is bad for SB, SBO, Palm.
23) In my last update on Point 47) I wrote that – is it possible where we see the Dollar Index strengthen but Palm prices still holds and not drop much?
Answer is yes, its possible. Why?
i. What if production levels drops off significantly? This is good for bulls.
ii. What if it starts to rain at any moment, we see severe flooding in ffb production states and disrupts harvest? This is good for bulls. (though there are no signs of this right now)
iii. What if exports figures are good? This is good for bulls. (So far exports are slightly lower than Sept, but still much higher than Aug)
iv. What if the Dollar index strengthen against other currencies, but remains weak against RMB and INR? This is also good for SB/SBO/Palm.
iv. So a strengthening Dollar Index does not necessarily equals lower Palm Prices. We need to see it in relation to the RMB, INR, local productions, demand and related factors.
So I will be monitoring the Dollar in conjunction with Point 23 above.
USD/Chinese Yuan
24) Happy note for Chinese Soybean buyers. The RMB continues to strengthen against the Dollar. This is supportive for Soybean purchases.
i. I would like to see the RMB continue to strengthen or at least stays flat and not weaken against the USD.
Indian Rupee/USD
25) The Indian rupee mostly traded sideways – flat.
i. I would like to see an INR that is strengthening or at least flat and not weakening against the USD.
USD/MYR
26) The Ringgit was mostly flat in the month of Oct, it strengthened very slightly.
i. I would like to see a Ringgit that is weakening or at least stays flat against the Dollar.
ii. If the Ringgit is strengthening against the Dollar, then I would like to see the RMB & INR also strengthening as much or more relatively.
Other Factors to look at:
Crude Oil
27) In my last update, I said that I would like to see Crude start ticking higher after testing support around 36 – 34 area.
i. Price held around the 36.60 area and didn’t trade lower and bounce from there.
ii. Price is trading around the 41 area which is the high of the recent trading range area.
iii. Price attempted to sell off 2 times on last Thurs and Friday, but reversed back up, with large prominent tail below.
28) I would like to see crude continue to trade higher as it indicates a stronger overall world economic conditions – more cars on the road, more flying, more energy usage for economic output. A weaker crude oil is generally not supportive for commodities prices such as SBO and Palm.
Other, Other Factors to look at:
28) There is a presidential election in the USA in the 3rd Nov.
i. We have to keep this date in mind because it could move the Dollar in either direction which will effect commodities prices.
28a. On Covid Cases.
i. The western world in heading into the fall/winter months which experts believe Covid cases will increase due to people spending more time indoors.
ii. We are already seeing spikes in cases in France, Spain and other countries.
iii. Remember we had a state election in Sabah, and cases in Malaysia just boomed?
iv. Well, the USA election is on the 3rd Nov. What if it happened like Sabah, and the election in USA caused cases to spike uncontrollably to 100k to 200k or more daily cases? Something to watch out for.
Summary
29) So far from the charts, this week, prices are much more murky and unclear than previous few weeks.
i. There are credible buy and sell setup for the bulls and bears, with each not having a large edge against the other.
ii. This is classic trading range price action – in trading range, people sell high, and buy low of the trading ranges.
iii. The currencies offer slightly better picture because RMB is strengthening against the USD, and we will monitor if this will support SB prices next week.
iiia. We have to also monitor if RMB can continue to maintain these levels or if it weakens back against the USD. A weakening RMB I think will not be supportive of Soybean Prices.
iv. Not much to see from Indian Rupee as it has been trading Flat against the USD – just slightly higher
v. Ringgit strengthen slightly against the USD also – I prefer to see a weaker Ringgit in the next 1-2 weeks.
30) What I am monitoring:
i. If Dollar have another small leg down to create a double bottom at 93 before rallying – (if it rallies at all)
ii. FCPO – Whether the selling price action from last week was merely just a pullback before a second leg up.
iia. With production being so tight, there is a chance of this happening – even against a strengthening dollar.
iii. Soybean – If we see another leg up to complete the 3rd leg of the wedge pattern to retest the 1080-1100 top of the trading range.
iv. Soybean Oil – whether the sell of last week was merely just a 2 legged pullback, before the second leg up in Oct resumes.
We should have more clarity with a few more day’s price action.
I am slightly leaning towards the bulls case for a small sideways to up move in the next 1-2 weeks. With more information, I may change this stance and will update accordingly.
From the above, it should more or less give you some context to the current state of the market conditions.
Should there be no major changes from my analysis above, I will update again next weekend.
Trade safe, and I welcome any feedback from you.
Best Regards,
Tech Trader

FKLI TRADING : 200) possible formation head-and-shoulderthis is trade 200 frm haidojo trading...
I have been holding a position since 9th Oct 2020...an advanced pattern and bearish bat pattern...
it is neither touching the SL nor the tp...haiz...
so still holding until one of them is filled...
the latest discovery is possible formation of head-and-shoulder pattern in daily chart...if this happens, it is a huge one...
the neckline is at 1477 ...a critical support now...
higher-resistance : 1557-1570 ( bearish bat and gartley patterns)
resistance : 1531-1540 ( bearish bat pattern)
immediate resistance : 1500-1515
support : 1477-1488 (below this is confirmation of Downtrend)
lower support : 1446-1413
WARNING!
RISK DISCLAIMER : this is juz a trading idea...trading stocks, futures or forex might incur a huge risk to your account/funds… DON’T LOSE MONEY THAT YOU CANNOT AFFORD …any idea(s) of trading in this episode SHALL NOT be regarded as a hint of BUYING or SELLING . It is MERELY a trading journal and it has been used for educational purpose only… trade at your own risk!
**your "LIKE" and "FOLLOW" are my main source of motivation to continue posting more valuable contents...TQ*

FCPO Trade - 20 Oct'20 (Morning Session)- Price on slow and steady Uptrend; saw some Resistance at 2808 and price bar is small with average to low vol.
- Set Buy Stop at 2809; Entry Point triggered.
- Set Stop Loss (8pts) and Target Profit (12pts) and monitor trade.
- From Entry Point to the 5th bar, price slowly moving up but the vol. is getting lower and lower; decided to exit trade on the 6th bar with 4pts profit.

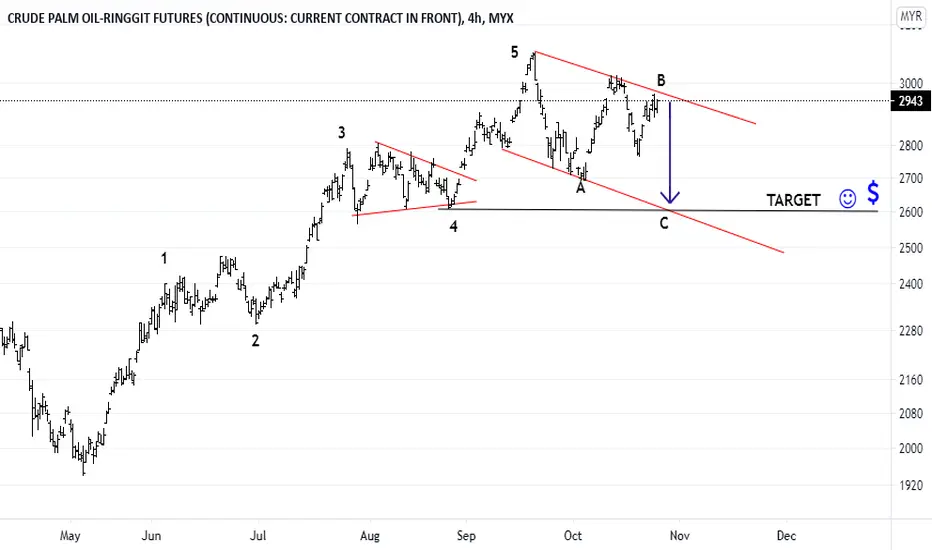
Oct20 - FCPO (1D) - Sideways, Retesting Range Low 2.6-2.7k 🐮🐻Bounce reached ~304x R-zone previously mentioned. Didnt manage to test the 3100 highs.
Didnt get to capitalise early on the current plunge from 30xx highs, tbh was expecting a milder retracement.
And we got a sharp plunge instead, thus potentially a large sideways range in play, before continuing the monthly bullishness.
Major Support: 2600-2700 ; ~244x
Happy Hunting! 🥂🚀
-jk-

FCPO - Bearish Reciprocal Head & ShoulderThe price of fcpo has been fall more than 300 points in the distribution event from the supply zone.
The psychology level of 2800 has been breach as well & a reciprocal harmonic Head & Shoulder identified.
We might witness some volatility of price action in 2700 level in the event of defending the neckline area.
A violation of the neckline could potential bringing price landed to 2490 level supported with reciprocal AB=CD in the H&S structure.
FCPO Trade - 19 Oct'20- There was a nice setup where we can see few downbars with increasing vol. We have SO bar on VSI vol. at 14:51. The next bar is a small body with low vol.
- Set a Buy Stop (middle of the trading range) and Sell Stop (just below the Support).
- Price hit Buy Stop. Follow the trade with Target Profit set.
- I did not use Stop Loss in place; instead I use my Sell Stop so that if the price decided to go the other way, it will close 1 Long contract and activate 1 Short contract (this is for advance method; for newbies, stick to Stop Loss).
Note: On the Stop Loss, why I wanted to put "-1" (before the my Target Profit got hit) was because that is the breakeven point should the market decided to go against my favor. As the market goes higher, I can raise my SL as well i.e. "-3" or "-5" and so on.

FCPO TRADING : 198) short on reboundthis is haidojo and the number is 198 ...
for a few days, I was hospitalized and unable to trade nor update the posts...so I would like to give my sincere apology for ppl
who are waiting for my updates...
abt fcpo-dec which ends today...both lower-high and lower-low are formed in lower timeframe...so it is the time to turn around the tide...
a reversal has happened...we should change to short on rebound and stop the previous long on retracement...
strong resistance : 3030-3100 (abv this level is fastlane; crazy bull)
immediate support : 2900
lower support : 2820-2800
WARNING!
RISK DISCLAIMER : this is juz a trading idea...trading stocks, futures or forex might incur a huge risk to your account/funds… DON’T LOSE MONEY THAT YOU CANNOT AFFORD …any idea(s) of trading in this episode SHALL NOT be regarded as a hint of BUYING or SELLING . It is MERELY a trading journal and it has been used for educational purpose only… trade at your own risk!
**your "LIKE" and "FOLLOW" are my main source of motivation to continue posting more valuable contents...TQ

FKLI TRADING : 197) bearish batthis is trade 197 frm haidojo trading...
entry at short 1531, SL 1545, 1st tp 1515, 2nd tp 1492...
the bat pattern is triggered...almost hit the SL 1545...then tdy it hits 1st tp 1515 and now going to probably 2nd tp...1492
fkli-oct is now basically led by news event...announcement of another round of mco (movement control order) on wednesday
has triggered another round of selling pressure...
higher-resistance : 1557-1570 ( bearish bat and gartley patterns)
resistance : 1531-1540 ( bearish bat pattern)
immediate resistance : 1500-1515
support : 1477-1488
lower support : 1446-1413
WARNING!
RISK DISCLAIMER : this is juz a trading idea...trading stocks, futures or forex might incur a huge risk to your account/funds… DON’T LOSE MONEY THAT YOU CANNOT AFFORD …any idea(s) of trading in this episode SHALL NOT be regarded as a hint of BUYING or SELLING . It is MERELY a trading journal and it has been used for educational purpose only… trade at your own risk!
**your "LIKE" and "FOLLOW" are my main source of motivation to continue posting more valuable contents...TQ*
FCPO TRADING : 196) long on pullback/retracementthis is haidojo and the number is 196 ...
today we have a huge gap up...and almost touching the expected 3030...missed it by a mere 4pts...
the strategy is still the same...long on retracement...until an initial structure low is formed...
strong resistance : 3030-3100 (abv this level is fastlane; crazy bull)
support : 2900
lower support : 2820-2800 (below this is the first sign of bear)
WARNING!
RISK DISCLAIMER : this is juz a trading idea...trading stocks, futures or forex might incur a huge risk to your account/funds… DON’T LOSE MONEY THAT YOU CANNOT AFFORD …any idea(s) of trading in this episode SHALL NOT be regarded as a hint of BUYING or SELLING . It is MERELY a trading journal and it has been used for educational purpose only… trade at your own risk!
**your "LIKE" and "FOLLOW" are my main source of motivation to continue posting more valuable contents...TQ
Oct12 - FCPO (Daily) - Likely Retest 304x-8x R-zone...🐮Did a video update, following up on previous CPO idea posted, check it out on my other social media accounts.
Meanwhile, we have turned Bullish since S@2700 holding last week.
Immediate R: 287x-9x taken, now turned support.
As long as price stays above both UTLs, we are likely to retest prev HH near R2: 304x-8x area.
Meanwhile, if we continue to stay above the weekly major level 2.8-3.1k, my new bull cycle call may be in progress ;)
Check out the Elliott Wave count post from Sept20, below. 👇🏻
Happy Hunting! 🥂🚀
-jk-

FCPO TRADING : 195) long on pullback/retracementthis is haidojo and the number is 195...
last Friday we had seen fcpo-dec formed yet another new structure high...
therefore, we are anticipating the market to move higher until initial structure low is formed...
either the price moves higher to challenge 3030-3100...or consolidates to build stronger base at 2900 before going higher...
it could also go sideway and produce some advanced patterns...
strong resistance : 3030-3100 (abv this level is fastlane; crazy bull)
immediate support : 2900
support : 2820-2800
critical support : 2700(below this is bear)
WARNING!
RISK DISCLAIMER : this is juz a trading idea...trading stocks, futures or forex might incur a huge risk to your account/funds… DON’T LOSE MONEY THAT YOU CANNOT AFFORD …any idea(s) of trading in this episode SHALL NOT be regarded as a hint of BUYING or SELLING . It is MERELY a trading journal and it has been used for educational purpose only… trade at your own risk!
**your "LIKE" and "FOLLOW" are my main source of motivation to continue posting more valuable contents...TQ
FKLI TRADING : 193) sideway market, slowly glide up?this is trade 193 frm haidojo trading...
not much update abt fkli-oct as the market is in uncertainty...
as the saying goes, " If curiosity can kill a cat, then uncertainty can kill the market"...
we can make money in both uptrend or downtrend market, but uncertain market is the hardest to ride on...
it is still bullish in daily chart, threfore, I presume the market will glide up slowly...or goes into a sideway market...
fkli-oct doesn't go back into 1477 but instead retest 1488 and rebound...so support level 1477-1488 is a strong support level to watch over...
higher-resistance : 1557-1570 ( bearish bat and gartley patterns)
resistance : 1540
immediate resistance : 1500-1515
support : 1477-1488
lower support : 1446-1413
WARNING!
RISK DISCLAIMER : this is juz a trading idea...trading stocks, futures or forex might incur a huge risk to your account/funds… DON’T LOSE MONEY THAT YOU CANNOT AFFORD …any idea(s) of trading in this episode SHALL NOT be regarded as a hint of BUYING or SELLING . It is MERELY a trading journal and it has been used for educational purpose only… trade at your own risk!
**your "LIKE" and "FOLLOW" are my main source of motivation to continue posting more valuable contents...TQ*
FCPO TRADING : 192) long on pullback/retracementthis is haidojo and the number is 192...
fcpo-dec still stuck at the current resistance 2890-2900...if the price breaks abv this, it will retest 3033-3100 ...
a level which were tested in Dec2016-Jan2017, Jan this year and also last month, mid-Sept...
level abv 3100 has not yet been reached ever since 2012...8 long years! so let's see what might happen next...
if this level (2890-2900) doesn't hold, then it will find support at 2820-2800...
unless 2700 level, which was the latest low is broken, if not, overall fcpo is still in bullish state...
so long on retracement is the strategy now...
strong resistance : 3030-3100 (abv this level is fastlane; crazy bull)
immediate resistance : 2900
support : 2820-2800
critical support : 2800(below this is bear)
WARNING!
RISK DISCLAIMER : this is juz a trading idea...trading stocks, futures or forex might incur a huge risk to your account/funds… DON’T LOSE MONEY THAT YOU CANNOT AFFORD …any idea(s) of trading in this episode SHALL NOT be regarded as a hint of BUYING or SELLING . It is MERELY a trading journal and it has been used for educational purpose only… trade at your own risk!
**your "LIKE" and "FOLLOW" are my main source of motivation to continue posting more valuable contents...TQ
FCPO TRADING : 191) confirmation shift-of-trendthis is haidojo and the number is 191...
fcpo-dec not only stay abv 2830 but also shoot up to the next level at 2890-2900...
a higher-high is formed...so confirmation shift-of-trend...if it stays abv the 2900, then we might have a full throttle...
bull in charge then...
for now, either sideway or uptrend...higher level is 3033-3100...
higher resistance : 3030-3100
immediate resistance : 2900
temporary support : 2830
lower support : 2800
WARNING!
RISK DISCLAIMER : this is juz a trading idea...trading stocks, futures or forex might incur a huge risk to your account/funds… DON’T LOSE MONEY THAT YOU CANNOT AFFORD …any idea(s) of trading in this episode SHALL NOT be regarded as a hint of BUYING or SELLING . It is MERELY a trading journal and it has been used for educational purpose only… trade at your own risk!
**your "LIKE" and "FOLLOW" are my main source of motivation to continue posting more valuable contents...TQ
