GBP/USD Is This the Last Dip Before 1.37?🔹 1. Price Action & Technical Structure (Weekly & Daily Charts)
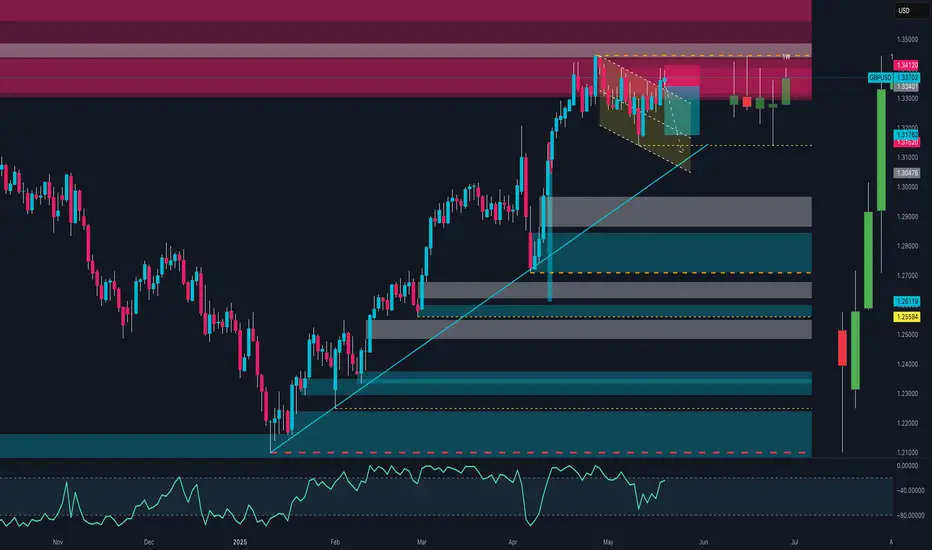
Price has broken above the ascending channel highlighted on the weekly chart.
The 1.3545 area is currently acting as dynamic resistance — a weekly close above it is crucial to confirm a breakout.
Below, we find a bullish order block (demand zone) around 1.3340 – 1.3280, aligning with the 0.5 Fibonacci level.
RSI is neutral, showing no bearish divergence at the moment.
🔹 2. COT Report (Commitment of Traders)
USD Index:
Non-commercial traders: +823 new longs, +363 new shorts → Neutral to bullish positioning.
Commercials remain net short, indicating short-term USD strength potential.
EUR FX (inverse proxy for USD):
Significant reduction in speculative long positions → Less bullish pressure on the Euro, favoring USD strength.
🔹 3. Sentiment
67% of retail traders are short GBP/USD vs. 33% long.
This is a bullish contrarian signal, suggesting potential continuation toward the 1.36–1.37 zone.
🔹 4. Seasonality
Historically, June tends to be bearish for GBP/USD over the past 5–10 years.
However, the first 10 days of the month often start with bullish momentum before correcting in the second half.
🔹 5. Economic Calendar
Today: Construction PMI (GBP), ECB Press Conference (EUR), Unemployment Claims (USD).
Tomorrow: High potential volatility across all USD pairs.
Watch out — upcoming macro data may strongly impact breakout confirmation.
🔹 6. Operational Outlook
Primary Bias: Neutral/Bullish with potential for a technical pullback.
📍 Key Levels:
Resistance: 1.3545 – 1.3593 (Supply zone + 0.0 fib)
Support: 1.3340 – 1.3280 (OB + 0.5/0.618 fib)
🧠 Scenario 1 – Bullish Continuation:
Retest of 1.3340 → long targeting 1.3590 / 1.3680
Confirmation on daily close above 1.3550
🔻 Scenario 2 – Bearish Retracement:
Rejection below 1.3550 + USD macro strength → drop toward 1.3280
If that breaks → extended move to 1.3170 / 1.3150
Fed
Corn at the Cliff Edge: Bearish Breakdown or Smart Money Trap?📉 1. Price Action & Technical Context (Weekly Chart – ZC1!)
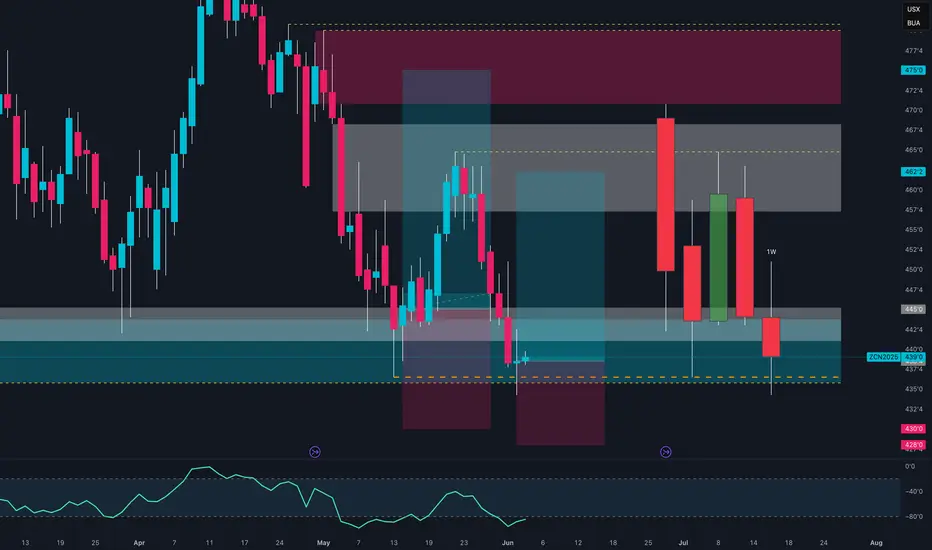
Price is currently sitting around 439'0, after rejecting the 462'2 supply zone (gray block) and confirming rejection from the macro supply area between 472'6–480'0 (red block).
The last four weekly candles show a failed recovery attempt (three green candles trapped between two strong red ones), culminating in a bearish breakout below the intermediate demand zone (445'0–442'0).
Now, price is back inside the key demand zone between 439'0–433'4, an area with heavy volume and previous significant lows.
🔍 Technical takeaway: Bearish breakout confirmed. Price is testing the last major weekly support before opening the door toward the yearly lows (~420'0).
📊 2. Commitment of Traders (COT Report – May 27, 2025)
Non-Commercials (Speculators):
Long: 324,377 (▼ -17,952)
Short: 344,710 (▼ -9,171)
Net Position: -20,333 → Bearish, but the unwinding of both sides suggests profit-taking.
Commercials (Institutions):
Long: 766,211 (▲ +12,588)
Short: 713,647 (▼ -962)
Net Position: +52,564 → Increasing → Institutional accumulation.
🔎 Key observation: Commercials are increasing their net longs, while speculators are reducing exposure. This diverges from price action and may signal institutional accumulation under 440.
📉 3. Net Positioning vs Price (COT Chart)
The chart shows a clear decline in speculative longs since March, with a new low this week.
Meanwhile, commercials are gradually increasing their long exposure, positioning themselves against the current bearish trend.
💡 Combined view: While price keeps dropping, the "smart money" is accumulating → possible bottom forming, though not yet confirmed technically.
🌾 4. Seasonality
June Performance:
20-Year Avg: -4.25%
15-Year Avg: +12.31%
5-Year Avg: +1.15%
2-Year Avg: +28.61%
📈 Seasonal Conclusion: The seasonal bias has turned strongly bullish in the last 2–5 years. June–July is often a rally period for Corn following the late-May bottoms — likely tied to U.S. planting season dynamics.
EUR/USD Reversal Imminent? 5 Powerful ReasonsEUR/USD – Tactical Bearish Outlook Ahead of Key Reversal
EUR/USD is approaching a critical inflection point where multiple technical and fundamental signals are aligning to suggest a potential short-term reversal.
📉 1. Price Action & Technical Structure (1W / 1D)
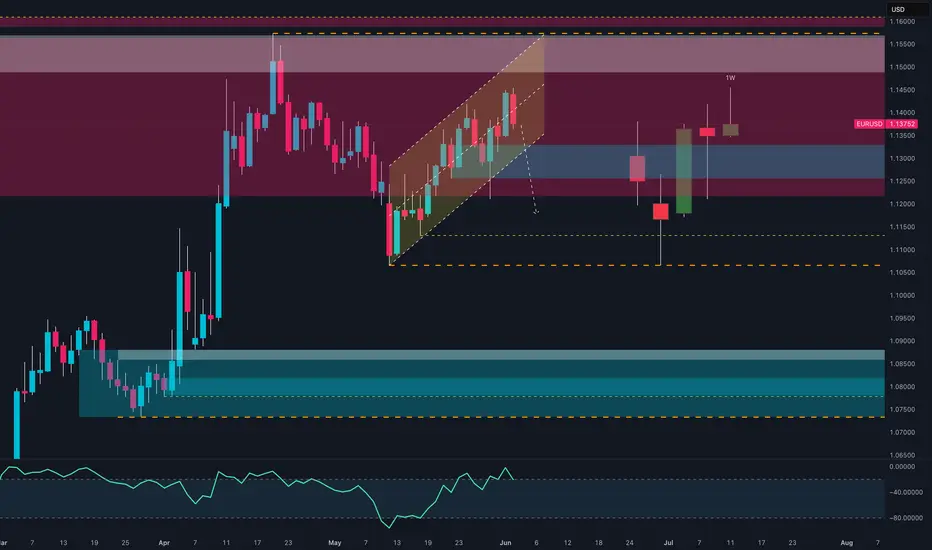
The pair recently completed a clean bullish structure inside an ascending channel, originating from the 1.0600 demand zone and reaching into the key supply area between 1.1400–1.1550.
Recent price behavior indicates:
A weekly candle with a strong upper wick, signaling institutional rejection.
A visible RSI bearish divergence, showing weakening momentum.
The most recent daily candle broke below the channel, suggesting a potential swing high.
Implication: A short-term reversal is likely, targeting the 1.1180 zone, with an extended move potentially reaching the 1.1050–1.1000 area.
🧠 2. COT Data – Institutional Positioning
USD Index:
Non-Commercials increased longs (+823) and slightly increased shorts (+363) — net bias still bullish USD.
Commercials also added to longs, further confirming institutional accumulation.
→ USD strength building.
EUR Futures:
Non-Commercials reduced longs (-1,716) and added shorts (+6,737).
The net long position in EUR continues to weaken.
→ Increasing risk of EUR retracement.
📅 3. Seasonality – EUR/USD in June
EUR/USD tends to be neutral to bearish in June.
The 5- and 10-year averages show consistent early-month declines, supporting a short bias in the first two weeks.
📊 4. Retail Sentiment
Sentiment is currently evenly split (50/50).
However, more volume is positioned long — a potential contrarian signal.
→ A break in this balance may trigger volatility and directionality.
🧭 5. Macro Context
Eurozone is facing stagnation, with falling inflation and weak growth.
U.S. data remains stronger, supporting the Fed’s “higher for longer” narrative.
→ This divergence favors a stronger USD in the near term.
✅ Trading Outlook
📉 Current Bias: Bearish (corrective)
📌 Short-Term Target: 1.1180
📌 Mid-Term Target: 1.1050–1.1000
❌ Invalidation: Weekly close above 1.1460
🎯 Strategy: Look for intraday rejection confirmations and sell pullbacks, in alignment with HTF structure and institutional flows.
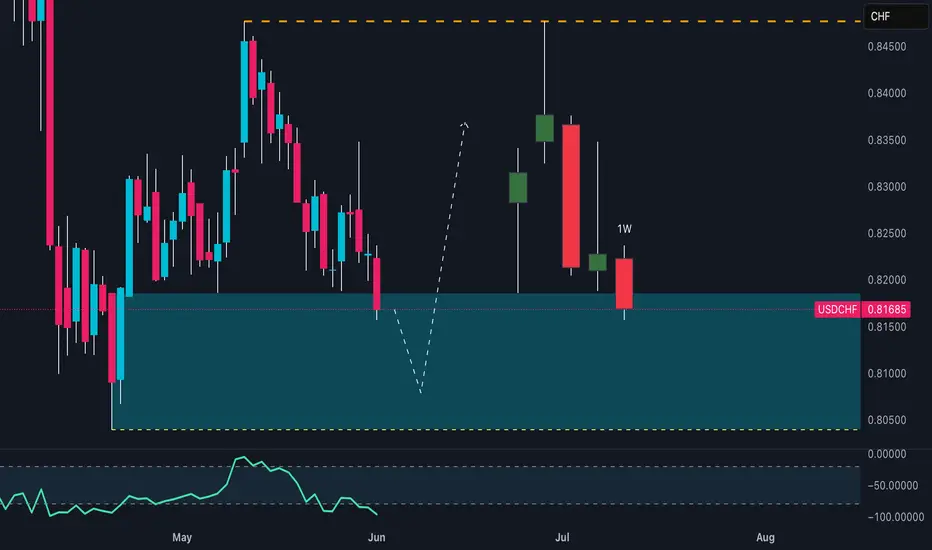
USD/CHF Setup Breaking Down: Don’t Get Caught Long This TrapUSD/CHF is currently trading at a critical technical and macro-structural juncture. Price is hovering within the weekly support area between 0.8050 and 0.8200, a zone that has historically triggered significant bullish reactions. However, the latest weekly candle closed below the psychological 0.8200 level, showing a clear rejection of upper resistance and signaling a lack of buying strength on the U.S. dollar side. This weak closure undermines the bullish structure and opens the door for a potential continuation of the downtrend—especially if price breaks below the 0.8150 mark on the daily or H4 timeframe.
From a seasonal standpoint, June has historically been a bearish month for USD/CHF. Monthly average returns over the past 20, 15, 10, and 5 years confirm steady downside pressure on the dollar against the Swiss franc. Only the 2-year average shows a slight positive bias, but it remains an outlier against the broader seasonal trend. This supports the idea that the recent weakness is not only technical but also cyclical in nature.
The Commitment of Traders (COT) report reinforces this bearish view. On the Swiss franc side, commercial traders (typically the most informed and hedging-oriented participants) are heavily net long, while non-commercial traders (speculators) remain significantly net short. This imbalance is often seen around reversal points and may indicate rising CHF strength. On the U.S. dollar side, positioning is far more balanced—the Dollar Index COT shows a neutral stance, with non-commercials slightly net long but without any dominant momentum. This confirms there’s currently no structural strength behind the dollar to justify a meaningful rebound in USD/CHF.
Lastly, retail sentiment provides a classic contrarian signal: over 90% of retail traders are long on USD/CHF, with only 10% short. This extreme imbalance typically occurs ahead of bearish breakdowns, as institutional players tend to fade overcrowded retail positions.
In conclusion, USD/CHF remains vulnerable to further downside. The weekly price action is weak, seasonal trends are dollar-negative, COT positioning favors CHF strength, and retail sentiment is extremely long-biased. All factors align toward a likely bearish continuation, with technical targets in the 0.8080–0.8050 range. The only alternative scenario would require a strong H4/H1 bullish reaction with a reclaim of 0.8220—but at this stage, that appears unlikely without a major macro catalyst.
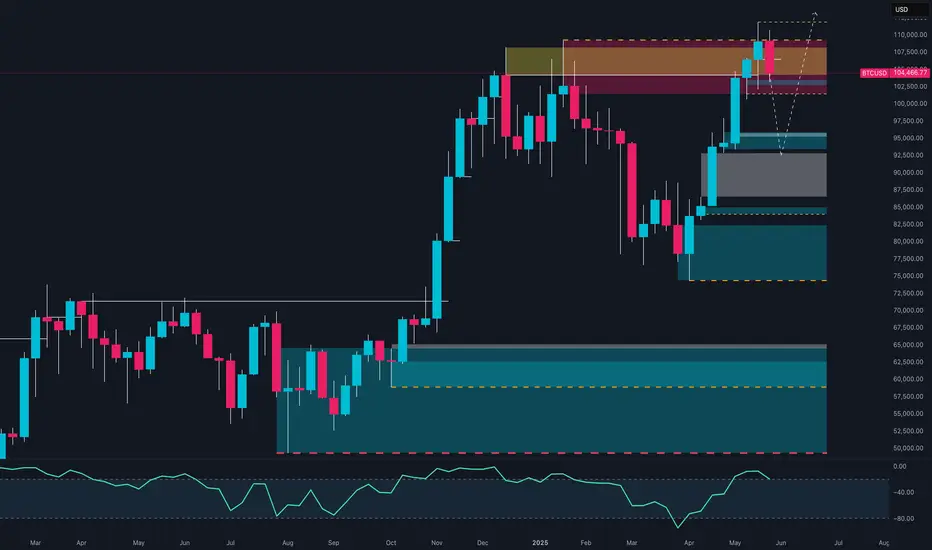
Bitcoin at a Crossroads: 110k RejectionAfter the powerful rally that began in the last quarter of 2024, Bitcoin is now at a critical market juncture. The price has once again reached the 106,000–110,000 USD zone, an area that already showed strong signs of distribution back in February and March 2025. This isn’t just a typical resistance level—it’s a psychologically loaded zone, marked by previous highs and repeated selling pressure.
In May, the monthly candle revealed a clear rejection from this zone: a prominent upper wick and a bearish body, signaling the bulls' struggle to sustain new highs. This behavior suggests the beginning of a profit-taking phase or, more likely, a medium-term consolidation.
The picture becomes even more complex when we look at the COT Report dated May 27, 2025. Non-commercial institutional traders—speculative funds, hedge funds, and portfolio managers—have significantly increased their short positions, now exceeding 26,800 contracts. Meanwhile, long positions are hovering around 24,500, resulting in a net bearish exposure. The message is clear: smart money isn’t buying the breakout—it's selling into it.
Seasonality analysis reinforces this narrative. Historically, June tends to be a weak month for Bitcoin, often followed by renewed strength in the next quarter. The 2025 seasonal curve has mirrored the bullish pattern of 2021 up to May, but now—consistent with historical patterns—is showing signs of slowing. This supports the idea that the market might need a breather before potentially rallying again in Q3.
From a technical standpoint, the key levels are well defined. The 95,000–97,000 USD area is the first dynamic support zone, where the price might find short-term relief. However, the more significant support lies between 82,000 and 85,000 USD—this is the origin of the current rally and aligns with the old breakout structure. A return to this level would represent a healthy and natural correction within a still structurally bullish long-term context.
In summary, the current outlook calls for caution. Momentum is fading, seasonality is unfavorable, and institutional players are trimming long exposure while adding to shorts. Until the price can consolidate above 110,500 USD, the dominant scenario remains a corrective pullback, with interim targets at 95k and potential drops toward the 85k zone.
However, if the market surprises with a strong weekly close above the highs, it could pave the way for a new leg up toward the 125,000–135,000 USD range—potentially fueled by macro catalysts such as ETF inflows, Fed narratives, or broader adoption.
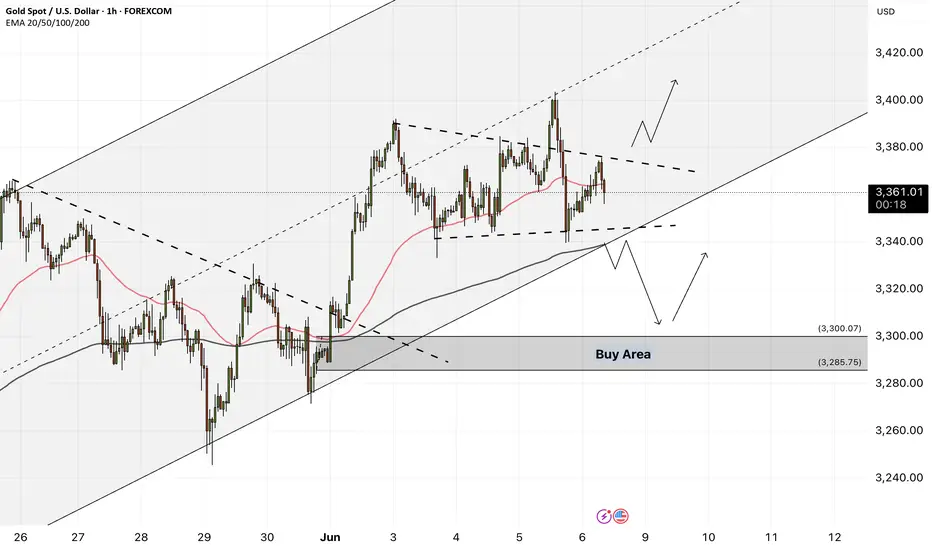
XAUUSD - Gold awaits NFP!Gold is trading in its ascending channel on the hourly timeframe, between EMA200 and EMA50. We should wait for a valid breakout of the pattern we identified yesterday, from which we had a Fick break above. We can enter the trade after it breaks in the formed pattern, and on the other hand, if gold corrects towards the demand zone, we can buy it in the short term with a reward at an appropriate risk.
Gold came under downward pressure amid renewed optimism regarding U.S.-China trade talks. Although prices surged to a four-week high earlier in the day due to strong demand from Asian and European buyers, a wave of selling during U.S. trading hours reversed part of that gain.
This shift in momentum coincided with rising U.S. Treasury yields and a boost in market sentiment following a phone call between the presidents of China and the United States. While no official statement has been issued yet, the decision to initiate a new round of high-level negotiations was seen as a positive signal. In recent months, gold has become a key indicator for gauging geopolitical and trade-related risks, having previously surged to an all-time high of $3,500 after the “Freedom Day” tariffs were implemented.
Despite ongoing concerns over Ukraine, Iran, and the growing U.S. fiscal deficit—which provide fundamental support for gold—the metal’s inability to break above the key resistance level of $3,437 has cast doubt on the short-term bullish outlook.
Meanwhile, Goldman Sachs has projected that the upcoming U.S. nonfarm payrolls (NFP) report for May will show a 125,000 increase in jobs. The unemployment rate is expected to remain steady at 4.2%, and monthly wage growth is estimated at 0.3%. The bank also anticipates a 10,000-job decline in the public sector, largely due to tariff-related policies and reduced hiring. Overall, Goldman Sachs expects the report to be balanced and free of surprises, which should encourage the Federal Reserve to maintain its current policy stance.
Although gold has managed to stabilize above $3,000 per ounce in recent weeks, many investors remain focused on reclaiming the historic peak reached in April. According to one research firm, it’s only a matter of time before that level is tested and broken again.
In the annual “Gold Focus 2025” report published Thursday by the UK-based firm Metals Focus, analysts stated that gold retains strong momentum for further gains in 2026. They forecast that the average gold price this year could reach an unprecedented $3,210, with new highs likely in the second half of the year.
In an interview with Kitco News, Metals Focus CEO Philip Newman said it is difficult to envision a scenario that would derail the current bull market. While this perspective isn’t included in their formal forecasts, he believes the rally could extend into 2026.
Newman added, “If you look at what’s happening across the global economy, all the ingredients for a structural bull market are present.” He highlighted that one of gold’s unique traits is how quickly investors adapt to new price levels, often converting previous resistance levels into future support. A year ago, he admitted he would have expected $3,000 to trigger widespread profit-taking.
However, despite ongoing economic uncertainty and geopolitical instability, investors have not been discouraged by current price levels. Newman emphasized that what makes 2025 distinct is that new investors are just now entering the market. While gold has been rallying since 2023, much of the demand until recently came from central banks and Asian markets—particularly China.
Newman noted that only in Q4 of last year and early this year did retail investors begin to decisively adopt a bullish stance. “We’ve seen strong growth in investment demand this year,” he said, “but there’s still a large amount of capital that hasn’t entered the market yet. This is not a bubble—this is a well-supported, structurally sound market.”
He concluded by identifying changing perceptions of the U.S. dollar as a major driver behind increased gold investment.While the dollar remains a traditional safe haven, ongoing trade tensions and unsustainable government debt levels have eroded market confidence, prompting investors to seek safety and diversification through gold.
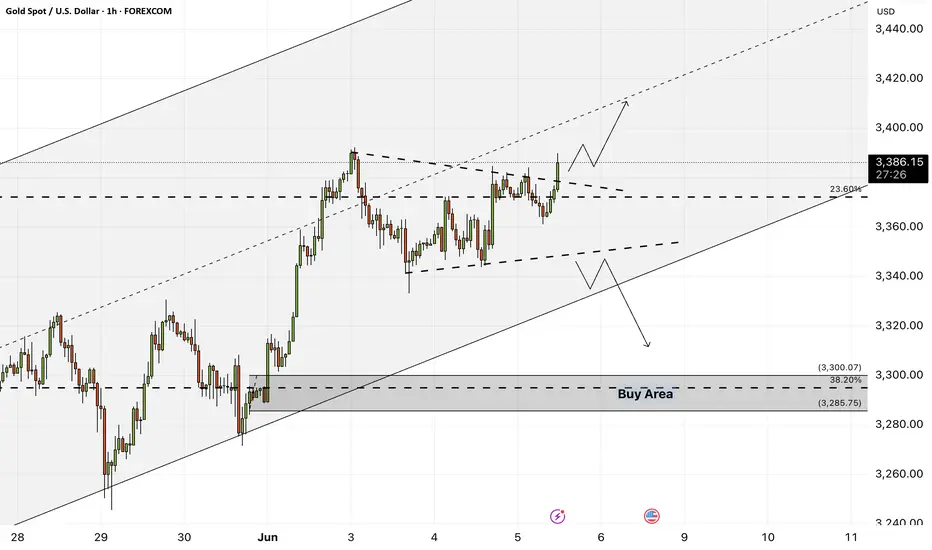
XAUUSD - Will Gold Continue Its Rise?!Gold is trading above the EMA200 and EMA50 on the one-hour timeframe and is trading in its ascending channel. We should wait for a valid breakout of the specified pattern and then enter the trade in the formed pattern. If gold corrects towards the demand zone, we can buy it in the short term with appropriate risk-reward.
According to the latest ADP report, private-sector employers in the United States added just 37,000 new jobs in May, marking a decline from 60,000 in April and reaching the lowest level in two years. While ADP data is typically interpreted with caution, many economists still anticipate that Friday’s official Bureau of Labor Statistics (BLS) report will reflect stronger employment growth.
President Donald Trump seized on this data to renew his criticism of the Federal Reserve for not lowering interest rates to support job creation. Some analysts argue that if the ADP figures are taken as an indicator, Trump’s tariffs may have impacted the labor market sooner than experts expected—though that remains a significant “if.”
ADP, a payroll services provider, announced on Wednesday that private employers added only 37,000 jobs in May, down from April’s 60,000 and the lowest number since March 2023. According to a survey of economists by Dow Jones Newswires and The Wall Street Journal, this figure falls well short of the expected 110,000 job increase.
If this sharp slowdown in job growth is mirrored in the government’s official report, it may indicate that businesses have drastically reduced hiring in response to the uncertainty caused by Trump’s frequently shifting trade policies. Forecasts have long predicted that higher inflation and slower job growth could result from trade conflicts. However, many experts believe the true effects will become visible in the summer, rather than being fully reflected in May’s data.
Additionally, many economists regard ADP as an imprecise leading indicator of the more comprehensive BLS report. Other labor market surveys have thus far shown greater resilience in employment conditions.
Oliver Allen, senior U.S. economist at Pantheon Economics, wrote: “As always, we recommend ignoring the headline message of the ADP jobs report, primarily because its recent track record has been very poor.” Analysts widely expect Friday’s BLS report to show that the labor market remained stable in May, with employers adding approximately 125,000 jobs.
Continuing his criticisms, Trump again used the ADP figures to attack Fed Chair Jerome Powell for not cutting interest rates this year. In a post on Truth Social, Trump compared the Fed to the European Central Bank, which has already lowered rates nine times. The Federal Reserve, in contrast, has maintained the federal funds rate at elevated levels since January, aiming to reduce inflation to its 2% annual target by keeping upward pressure on borrowing costs. This policy is being implemented amid persistent uncertainty about the broader economic impact of the tariffs.
Trump has repeatedly pressured the Federal Reserve to lower interest rates in order to reduce borrowing costs, stimulate economic growth, and prevent a potential recession. He wrote: “The ADP numbers are out!!! ‘Late’ Powell must cut rates now. He’s unbelievable!!! Europe has cut nine times!”
Meanwhile, the latest edition of the Federal Reserve’s Beige Book was released. Half of the Federal Reserve districts reported slight to moderate declines in economic activity, while three districts reported no change and three reported modest growth. All districts cited high levels of economic and political uncertainty. Reports on consumer spending varied. Home sales remained largely unchanged. While employment remained steady, hiring was conducted cautiously due to the uncertain outlook. Tariffs were reported to have caused moderate price increases, with rising costs increasingly passed on to consumers. Manufacturing activity was slightly weakened by tariffs, and businesses adopted a more cautious approach to investment.
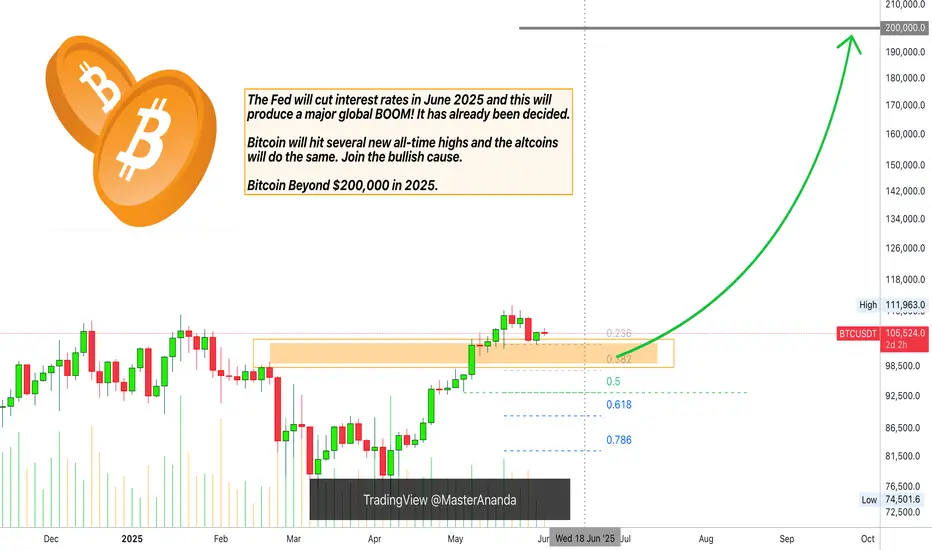
Bitcoin & The FED June 2025 (Beyond $200,000 New All-Time High)Before a major bullish event, the market tends to go sideways or into a retrace. Since the event is bullish, prices grow. Preceding the event the market gives out everything that isn't what will happen after the event, like a detox.
Now, Bitcoin is a very strange monster, kind of like a virus but in the good sense of the word. It changes, mutates, evolves, upgrades outdated decaying systems. So it isn't likely to crash just because the market is about to turn ultra-bullish. It is the other way around, since everybody already knows, nobody is willing to sell. In reality, everybody is buying like there is no tomorrow.
So Bitcoin can go sideways or into retrace until the Fed announces that it is cutting whatever interest, you know these things. So when they do their thing, the market will be ultra-bullish and that's when Bitcoin will produce its bullish continuation. Right now there is a period of consolidation which is being used by the whales as accumulation.
Remember when I was saying you will look like a genius for buying below 80K?
It is the same situation all over again. When Bitcoin is trading at $150,000 or $200,000, you will look like a genius for buying below $110,000. That's the way it is.
So, slightly bearish before the event. There can be a market flush but these are going to be limited because Bitcoins can be lost forever. It is a fight between whales. So if some whales decide to manipulate the market trying to cause some panic, other whales will be happy to buy everything at the lows and prices recover.
This means that Bitcoin will be consolidating until the announcement, after the announcement; "We will cut rates certain numbers of points..." Then all heaven will break loose. It will be money-up good news.
Do what you do, just be good, know that Bitcoin and Crypto will grow there is no way to stop this wave we are all going up. Those that were hating are going to be hated by their own selves because nobody will know who they are. We are going to be party-rocking like a rockstar because not only Bitcoin but we are going on a global bull market. You can bet on it. And if you do, you will be glad you did and you will be extremely happy with the result.
There is no way to stop Bitcoin.
There is no way to stop this wave.
The entire Cryptocurrency market will do awesome in late 2025. Are you prepared?
Thank you for reading.
Namaste.
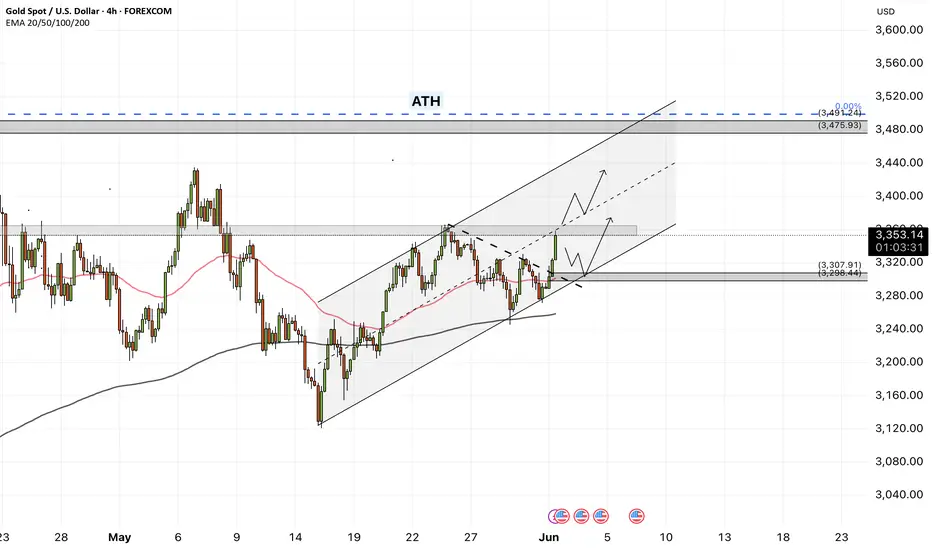
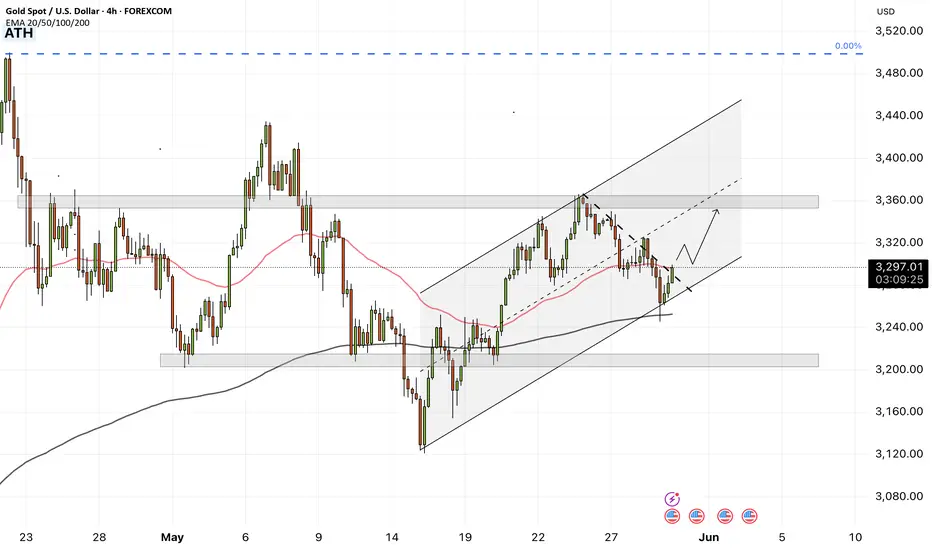
XAUUSD - Gold is on the verge of a very important week!Gold is trading above the EMA200 and EMA50 on the four-hour timeframe and is trading in its ascending channel. I predict the path ahead for gold to be upward and if the resistance level is broken, we can look for buying opportunities. If gold corrects, we can also buy it with a reward at an appropriate risk.
Gold prices experienced a mild decline over the past week, with market sentiment shaped less by fundamental shifts and more by mixed messages and scattered commentary around tariffs.Despite the noise, many traders chose to rely on data and technical charts rather than reacting emotionally—data that painted a more subdued picture than the headlines suggested.
Rich Checkan, CEO of Asset Strategies International, responded confidently in a recent survey, predicting further gains in gold. “The trajectory for gold is clearly upward. Prices have stabilized around the $3,300 level and appear ready for a new rally, especially if the appellate court’s ruling on tariffs is upheld,” he said.
Checkan also pointed to another macroeconomic factor that could support gold: “A new tax bill, described as large and costly, is set to be voted on in the Senate soon. If passed, it will likely widen the budget deficit, which historically leads to increased liquidity and rising inflation—a favorable environment for gold.”
On Friday, the PCE inflation report showed easing price pressures, though not enough to put the Federal Reserve at ease. Core PCE (excluding food and energy) rose by 0.1% month-over-month and 2.5% year-over-year in April—matching expectations and slightly down from 2.7% the previous month. The headline PCE also increased 2.1% annually, just below the forecast of 2.2%.
The key point: these data reflect the first month in which Trump’s new tariffs were active, yet there’s little evidence so far that they’ve caused inflation to rise. Still, the disinflationary trend remains sluggish and distant from the Fed’s 2% target. In its latest minutes, the Fed warned that inflation may prove more persistent than previously thought.
Nick Timiraos of The Wall Street Journal, despite the seemingly positive PCE numbers, issued a cautionary note with four key insights:
• The inflationary impact of tariffs is expected to begin showing up from May and be fully reflected in June’s data. This could accelerate goods price increases and disrupt the path of disinflation.
• Last year’s monthly PCE figures were particularly weak (May: 0%, June: 0.1%, July: 0.2%). As these drop out of the annual calculation, even if monthly gains remain steady, YoY rates could rise mathematically.
• The three-month average for Core PCE from May to October 2024 was only 0.1%. If upcoming monthly figures hit 0.2%, annual disinflation could stall or even reverse.
• While the latest report is encouraging, the effects of tariffs and the removal of last year’s weak data could complicate the inflation trajectory.
Looking ahead, market attention will focus heavily on a suite of crucial U.S. labor market indicators. The Job Openings and Labor Turnover Survey (JOLTS) is due Tuesday, private sector employment data (ADP) on Wednesday, and jobless claims on Thursday. However, the most anticipated release will be Friday’s Non-Farm Payrolls (NFP) report for May—widely viewed as a key factor influencing rate expectations.
Alongside labor data, markets will also watch other critical economic reports. The ISM Manufacturing PMI on Monday and the ISM Services PMI on Wednesday will offer broader insight into U.S. business activity. In the realm of monetary policy, interest rate decisions from the Bank of Canada (Wednesday) and the European Central Bank (Thursday) are expected to trigger notable movements in the currency and gold markets.
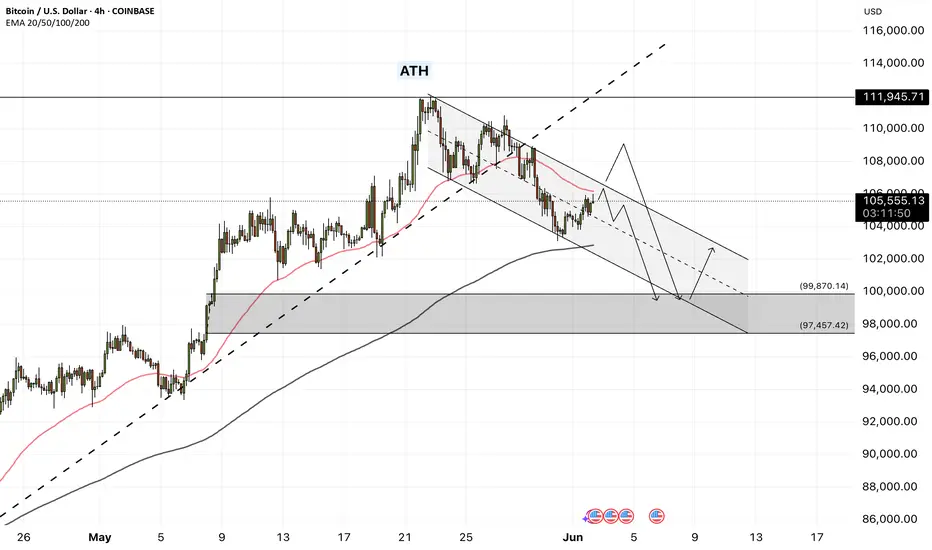
Bitcoin - Will Bitcoin reach $120,000?!Bitcoin is in its short-term descending channel on the four-hour timeframe, between the EMA50 and EMA200. Personally, I would look to sell Bitcoin at a target of $100,000. Either from the channel ceiling or after an invalid breakout of the specified channel. If this corrective move occurs, Bitcoin buying opportunities can be sought within the demand zone.
It should be noted that there is a possibility of heavy fluctuations and shadows due to the movement of whales in the market, and capital management in the cryptocurrency market will be more important. If the downward trend continues, we can buy within the demand range.
The Bitcoin 2025 Conference, widely regarded as the largest global event dedicated to Bitcoin and blockchain technology, took place from May 27 to 29 at the Venetian Convention Center in Las Vegas, Nevada. First launched in 2019 and held annually since, the conference has become the central meeting point for Bitcoin enthusiasts and professionals, offering a platform for knowledge exchange, ideation, and innovation within the Bitcoin ecosystem. With over 30,000 attendees, 400 speakers, and participation from around 5,000 companies, this year’s event played a significant role in advancing the global adoption of Bitcoin—often referred to as “hyperbitcoinization.”
The 2025 edition covered not only technical subjects such as Layer 2 scaling solutions and privacy enhancements, but also broader themes like institutional adoption, strategic Bitcoin reserves, and its implications for financial freedom on a global scale.From an economic perspective, there was a strong emphasis on Bitcoin’s role as a store of value amid inflationary pressures and unstable monetary policies. Forecasts presented by key figures such as Michael Saylor and Paolo Ardoino pointed to Bitcoin’s potential to emerge as a foundational asset within global financial systems. These projections were further supported by the expansion of the M2 money supply in 2024 and expectations for continued growth into 2025.
In addition to highlighting opportunities, the event also addressed the challenges facing Bitcoin. One major concern was the lack of clear legal and regulatory frameworks in certain countries—a topic addressed by Caitlin Long and other speakers. Such regulatory uncertainty could hinder broader Bitcoin adoption. Moreover, Bitcoin’s price volatility—highlighted by a 3.4% decline in the weeks leading up to the conference—raised questions about the market’s long-term stability.
Meanwhile, Coinbase reported that the repayment of debts related to the bankrupt FTX exchange could act as a $5 billion liquidity injection into the crypto market. This development is expected to boost capital inflows and potentially draw major institutional players back into the space.
According to Coinbase, as of May 30, the “FTX Recovery Trust” has begun its second phase of repayments, distributing over $5 billion in stablecoins to creditors. These payouts are being processed over three days via the BitGo and Kraken platforms. Unlike the first round in February, this phase involves only stablecoin disbursements rather than a mix of crypto and cash—enabling recipients to reinvest their funds more quickly and efficiently.
Additionally, U.S.-based companies currently hold 94.8% of all Bitcoin owned by publicly traded firms. The U.S. also commands 36% of the global Bitcoin hash rate, underscoring its dominance in mining activities. So far, 36 U.S. states have enacted pro-Bitcoin legislation, signaling a growing legal endorsement of the cryptocurrency across the country. This level of concentration—in ownership, regulatory leadership, and mining capacity—could position the U.S. to play a more decisive role in shaping future global Bitcoin regulations.
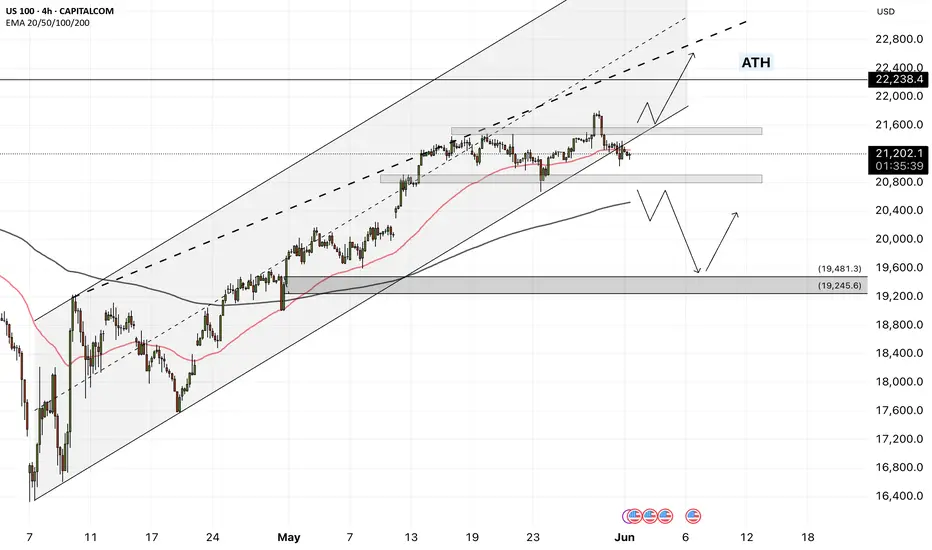
NAS100 - Will the stock market continue to rise!?The index is above the EMA200 and EMA50 on the four-hour timeframe and is trading within the specified range. In case of a valid break of this range, I expect a new trend to form. In case of corrective movements towards the demand zone, we can buy Nasdaq in that range with an appropriate reward for the risk.
A recent report from Bank of America reveals that investors are actively repositioning in global markets. For the second consecutive week, U.S.equities experienced capital outflows, while European stocks saw inflows for the seventh straight week.
Digital assets attracted $2.6 billion in inflows—the largest amount since January. In contrast, Japanese equities recorded the largest weekly outflow in history, while emerging markets equities attracted their highest inflows of 2025. Meanwhile, emerging markets debt also posted its strongest inflows since January 2023.
Jamie Dimon, CEO of JPMorgan, speaking at the 2025 Reagan National Economic Forum, warned that China will not yield to U.S. trade pressure. He urged that the U.S. must first address its internal challenges, including reforming laws, taxes, immigration, education, and healthcare systems. Dimon also underscored the importance of preserving military alliances.
He noted that China is a serious and potential rival, and if the United States fails to maintain its position as the world’s dominant economic and military power over the next 40 years, the dollar will no longer serve as the global reserve currency. Having just returned from China, Dimon added, “The Chinese are not afraid; don’t expect them to bow to America.”
Currently, markets are pricing in two interest rate cuts totaling 50 basis points by the end of 2025—a forecast aligned with the Federal Reserve’s official dot plot projections. Additionally, the latest FOMC minutes, which revealed policymakers’ concerns over persistent inflationary pressures, played a significant role in shaping these expectations.
Federal Reserve Governor Christopher Waller stated that he would support rate cuts later this year if tariffs remain around an average of 10%. However, his support hinges on inflation moving toward the Fed’s 2% target and the labor market maintaining its current strength.
Meanwhile, Morgan Stanley projects that the U.S. dollar could weaken by approximately 9% by mid-2026, citing a slowdown in U.S. economic growth and an anticipated 175 basis point reduction in the Fed’s interest rates. The bank also forecasts that 10-year Treasury yields will reach 4% by the end of 2025 but fall sharply in 2026 as rates decline further. Both Morgan Stanley and JPMorgan hold a bearish outlook on the dollar, expecting safe-haven currencies such as the euro, yen, and Swiss franc to benefit the most from its weakness.
In this context, market participants are closely watching key economic data in the week ahead. The ISM Manufacturing PMI is scheduled for release on Monday, followed by the Non-Manufacturing PMI on Wednesday. However, the main highlight will be Friday’s May Non-Farm Payrolls (NFP) report, which has exceeded expectations over the past two months. A similar result this time would signal continued strength in the labor market.
Given the Fed’s focus on inflation risks, special attention will likely be paid to the average hourly earnings growth. If wage growth remains above 3%, the market may begin to reprice some of its expectations for rate cuts—especially if the ISM reports also indicate improved economic activity in line with strong S&P Global readings. Such a scenario could pave the way for a renewed strengthening of the U.S. dollar.
Alongside the data releases, a series of speeches from key Federal Reserve officials—including Goolsbee (Chicago), Bostic (Atlanta), Logan (Dallas), and Harker (Philadelphia)—are expected. These remarks could further shape market expectations regarding the future path of monetary policy.
XAUUSD - Will Gold Continue to Fall?!Gold is trading in its ascending channel on the 1-hour timeframe, between the EMA200 and EMA50. I expect the direction ahead for gold to be bullish and if it breaks the downtrend line, we can look for buying opportunities.
The U.S. dollar rose following a decision by the United States Court of International Trade to revoke tariffs imposed by Donald Trump. Since the Trump administration, there have been continual developments regarding tariffs, and this latest ruling, which blocks Trump’s retaliatory tariffs, has stirred uncertainty and confusion over its legal validity. The ruling also triggered a correction in gold’s upward trend.
According to the U.S. Constitution, the power to impose tariffs officially resides with Congress. However, since 1962, much of this authority has been delegated to the executive branch. Courts have historically upheld this delegation to the president, but this recent judgment casts doubt on the legitimacy of such executive powers.
The pressing question now is whether Trump can circumvent the ruling. Could he potentially ignore it or take counteraction? Any move by Trump in response would undoubtedly ripple through the financial markets.
Goldman Sachs has characterized the court’s decision as a new obstacle for Trump’s trade strategy, though it notes the ruling only applies to part of the tariffs.Analysts at the firm believe Trump may find legal or procedural means to work around the court’s decision, possibly introducing new strategies to maintain his tariff agenda.
Citing customs data, ING commodity analysts Warren Patterson and Ewa Manthey reported that despite record-high prices, China’s gold imports reached their highest level in eleven months last month. Since the beginning of the year, gold prices have surged by more than 20%.
Total gold imports climbed to 127.5 metric tons, marking a 73% increase from the previous month. This sharp rise followed the People’s Bank of China’s issuance of new import quotas to select commercial banks in April. With a year-to-date gain exceeding 20%, gold hit an all-time high of $3,500 per ounce in April. Key drivers of this rally include geopolitical risk and sustained purchases by central banks.
In the broader metals sector, China’s refined copper production in April reached a new monthly record, rising 9% year-on-year to 1.25 million metric tons, even as processing fees remained low. Meanwhile, lead production declined by 1% from the previous year to 664,000 tons, while zinc output edged up by 0.3% to 576,000 tons.
According to the International Aluminium Institute, global aluminum production in April remained flat compared to the prior month, averaging 201,100 metric tons per day. However, on a year-over-year basis, output increased by 2.24%.
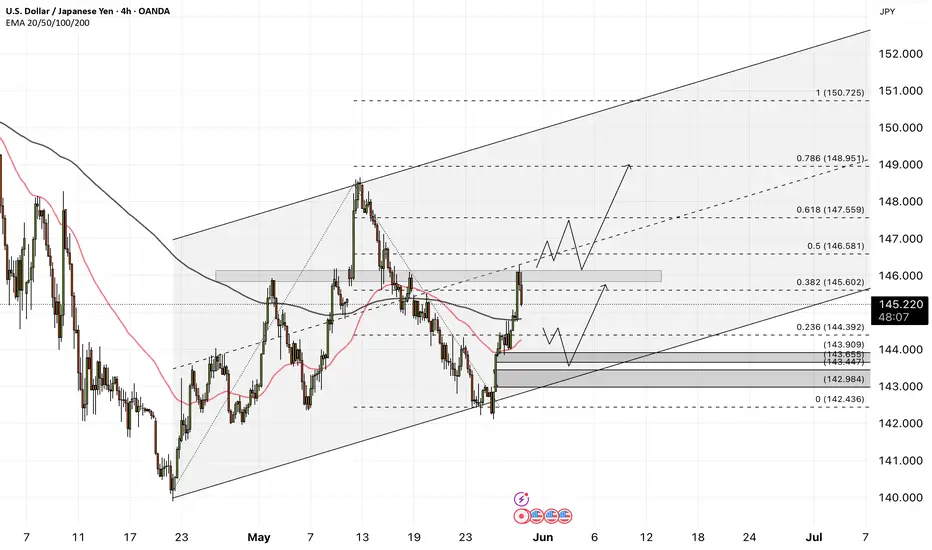
USDJPY - Will the dollar weakness stop?!The USDJPY currency pair is above the EMA200 and EMA50 on the 4-hour timeframe and is moving in its ascending channel. In case of correction due to the release of today's economic data, we can see a downward trend and then see the demand zone and buy in that range with an appropriate risk-reward ratio. A credible break of the indicated resistance range will pave the way for the currency pair to rise.
Japanese Prime Minister Shigeru Ishiba emphasized that investment is more crucial to economic growth than tariffs, reaffirming Japan’s continued commitment to negotiating the removal of U.S. trade tariffs. He also pointed to encouraging signs in the Japanese economy following wage increases and offered an optimistic outlook on the country’s recovery.
Meanwhile, Bank of Japan Governor Kazuo Ueda, speaking on Wednesday, warned that significant volatility in ultra-long-term bond yields could affect short-term borrowing costs, which in turn might exert a stronger impact on the broader economy. His remarks highlight the BOJ’s growing focus on recent fluctuations in long-dated bond yields, which could influence the board’s decision next month regarding the pace of its bond purchase reduction.
Ueda explained that in Japan, short- and medium-term interest rates tend to have more direct influence on the economy than ultra-long yields, due to the maturity structure of household and corporate debt. However, he acknowledged in a parliamentary session that sharp moves in ultra-long yields can also affect long- and even short-term bond yields indirectly.
Turning to Friday’s inflation report, expectations suggest that overall inflation remained subdued in April, as falling gasoline prices provided some relief to household budgets. However, core inflation—excluding food and energy—remains stubbornly high.
The PCE inflation index is anticipated to have risen 2.2% in April from a year earlier, slightly down from 2.3% in March, marking the lowest level since last September. Federal Reserve officials are still awaiting more data on how newly imposed tariffs are feeding into the broader economy, making it unlikely that the recent moderation in inflation will prompt a rate cut in the near term.
Although the Fed’s preferred inflation measure may have reached its lowest point since September, a second consecutive month of encouraging price data is unlikely to be sufficient to justify easing interest rates.
According to a survey conducted by Dow Jones Newswires and The Wall Street Journal, economists expect Friday’s report—covering inflation, income, and spending—from the Bureau of Economic Analysis to show that consumer prices rose 2.2% year-over-year through April. This would mark the lowest reading since September and a potential turning point in the Fed’s battle against post-pandemic inflation.
Goldman Sachs economists noted that falling gasoline prices have more than offset the inflationary impact of new tariffs introduced by the Trump administration. However, they cautioned that this dynamic may not last, as retailers are likely to start passing along the added import tax costs to consumers in the coming months.
Several Federal Reserve officials, concerned that tariffs could reignite inflation, have stated that they will wait to assess the full impact of these trade policies on the economy before making changes to the federal funds rate—which directly affects borrowing costs on everything from mortgages and auto loans to credit cards.
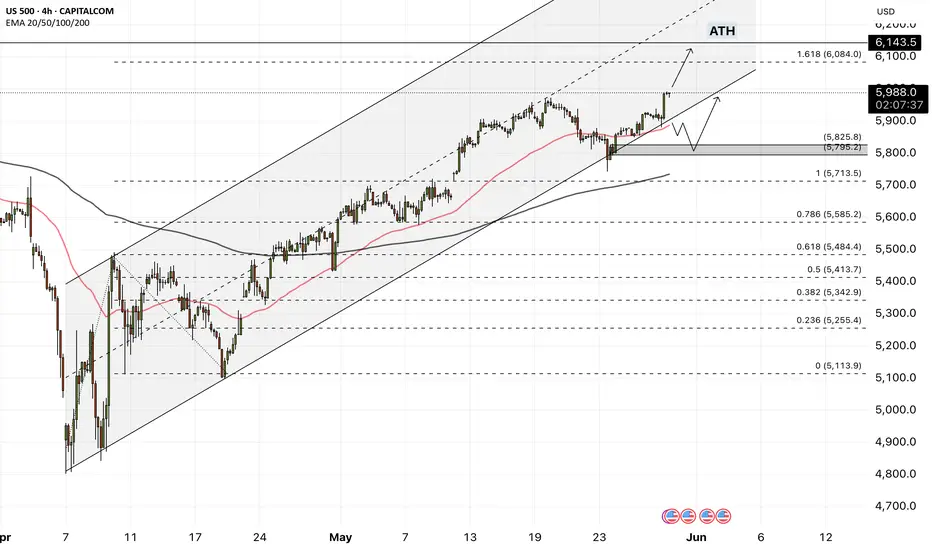
US500 - Will the stock market reach ATH?!The index is above the EMA200 and EMA50 on the four-hour timeframe and is trading in its ascending channel. I expect the index to continue moving, and on the other hand, if the index declines towards a certain zone, you can also look for the next S&P long positions with a risk-reward ratio.
Yesterday, a U.S. federal court halted the implementation of President Trump’s “Freedom Day” tariffs. The U.S. Court of International Trade ruled that these tariffs exceeded the legal authority granted to the president and unanimously decided to revoke them. Nonetheless, Trump still retains the right to appeal the ruling.
Following the court’s decision, President Trump promptly filed an appeal. In response, the White House issued a statement asserting, “The decision on how to handle a national emergency should not fall into the hands of unelected judges.”
Meanwhile, the market reacted strongly to Nvidia’s latest financial report. The company’s stock surged by as much as 5.8% in after-hours trading, before settling at a 4.8% gain compared to the previous day.
This bullish movement reflects investors’ confidence in Nvidia’s continued strong performance.
Nvidia is actively expanding into new markets, including the Middle East—an indication that the company is poised for sustained growth even if its presence in China is constrained.
The rally in Nvidia’s stock didn’t just lift semiconductor companies; broader markets followed suit. The S&P 500 index climbed to 6,005.75 points, representing a 1.7% increase from the prior session.
According to the company’s announcement, Nvidia posted $44.1 billion in revenue for the first quarter of fiscal year 2026, marking a 69% increase year-over-year and slightly surpassing analysts’ expectations. Revenue from data center operations rose 73% to reach $39.1 billion.
CEO Jensen Huang stated: “Our Blackwell NVL72 AI supercomputer—designed for reasoning and acting as a ‘thinking machine’—is now being mass-produced by system builders and cloud service providers.” He added, “There is enormous global demand for Nvidia’s AI infrastructure. Over the past year alone, AI inference token generation has grown tenfold. As AI agents become mainstream, the demand for AI compute will continue to surge.”
A Reuters poll now projects that the S&P 500 will reach 5,900 by the end of 2025—down from the 6,500 level forecast in February. Similarly, the Dow Jones index is expected to close 2025 at 43,708, compared to the previous projection of 47,024 from the February survey.
Separately, the Federal Deposit Insurance Corporation (FDIC) reported that the increase in U.S. bank profits was largely driven by growth in noninterest income. Bank earnings in the first quarter of 2025 rose by 5.8%, reaching $70.6 billion. While overall asset quality remains favorable, the commercial real estate loan portfolios continue to show signs of weakness. The number of “problem banks” declined by three, bringing the total down to 63. The banking industry also reported a slowdown in lending growth; the annual loan growth rate for the first quarter was just 3%, down from the pre-pandemic average of 4.9%.
Coffee Pullback or Opportunity?The COT report dated May 20, 2025, reveals a gradual cooling of speculative sentiment in the coffee market. Non-commercials (speculative funds and money managers), who had largely fueled the strong rally towards the 420 USX/lb highs, are now closing long positions (–2,599 contracts), though they still maintain a significantly positive net exposure (+43,300 net contracts).
At the same time, commercials (industry operators such as roasters, exporters, and processors) have reduced both their long and short positions. However, the drop in short hedges (–4,103 contracts) is an important signal—it may suggest less need for downside protection at current prices, often an early sign of a potential market bottom.
Total open interest has decreased by 4,406 contracts, signaling a phase of liquidation and consolidation, where traders are reducing exposure rather than initiating new positions.
📌 Fundamental conclusion: The market is undergoing a healthy reset following the Q1 2025 boom, with speculators stepping back and commercials cautiously optimistic.
📈 Seasonal Analysis
Seasonal tendencies align well with the current technical outlook. May is historically a weak month, with negative average returns across most time frames (10y, 15y, 20y).
However, from June—especially July onward, data shows a strong seasonal rebound, with July–August being statistically the best-performing period of the year for coffee. This is partly due to climate-related risks (Brazilian winter, frost risk) and harvest/logistics cycles in key producing regions.
📌 Seasonal conclusion: June may offer a strategic accumulation window ahead of the traditional summer coffee rally.
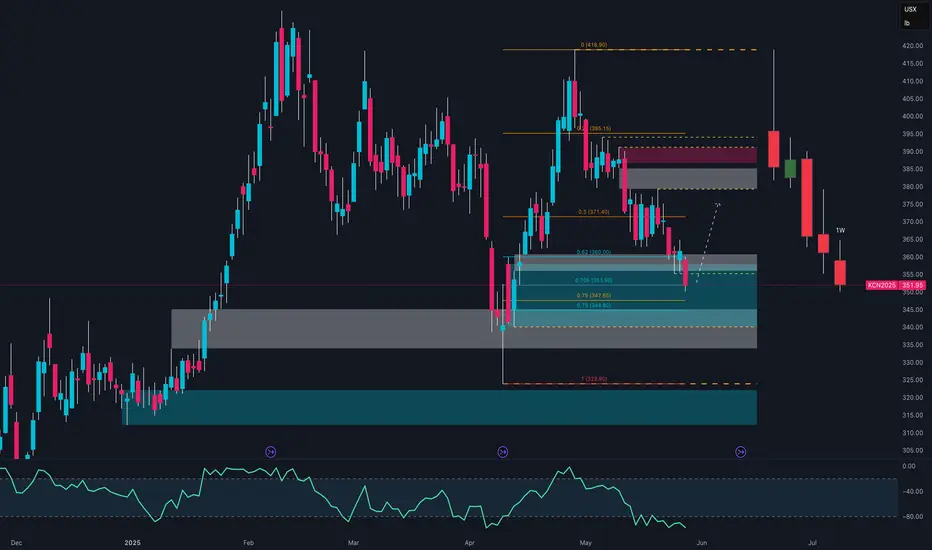
🧭 Technical Analysis (Daily)
The KC1! daily chart clearly reflects a distribution and correction phase following the early March peak at 420 USX/lb.
Price has broken below the 355–360 demand zone and is currently testing a key support area between 340 and 325, previously established as a demand base during January–February 2025.
The medium-term trend remains bullish, but the market is now in a downward corrective channel, with lower highs and lower lows.
The weekly RSI sits in a low-neutral range—not yet fully oversold, suggesting there may still be room for further downside, though the bulk of the correction may already be priced in.
📌 Technical conclusion: The market is undergoing a deep pullback within a broader uptrend and is approaching potential reversal zones.
🔎 Strategic Outlook
The coffee market is in the midst of a cyclical and technical correction following its sharp Q1 2025 rally. The COT report reflects a rebalancing of speculative positioning, while commercials appear less aggressive on the short side. Seasonality favors a rebound starting June, and the technicals point to a potential long-entry zone around 340–325, attractive for medium-term positioning.
✅ Recommended Trading Setup
Base scenario (medium-term long):
Entry: Between 340 and 325 USX/lb (gradual accumulation)
Stop Loss: Weekly close below 320 (bearish confirmation)
Target 1: 390 (intermediate supply zone)
Target 2: 410–420 (return to highs)
Confluence: RSI support, COT shift, seasonal upside, technical demand zone
Alternative scenario (bearish breakdown):
Only if weekly closes below 320
This would open room toward 300–285 USX/lb
📌 Final Conclusion
While short-term caution is warranted, current conditions offer attractive long re-entry opportunities for those who await confirmation around the 325–340 support area.
The ideal setup would include:
Weekly stabilization with higher lows
Renewed speculative long positioning in COT
Seasonal momentum kicking in from mid-June
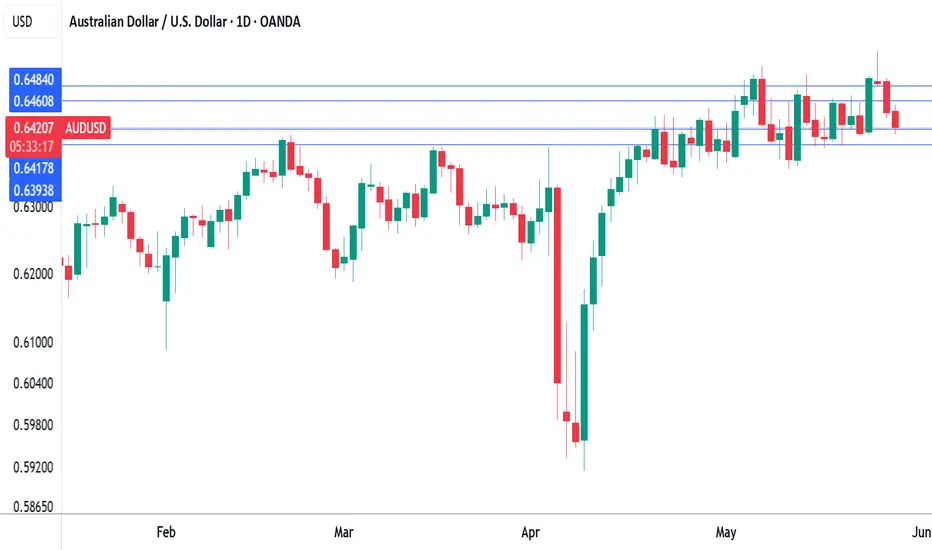
Australian inflation higher than expected, Aussie extends lossesThe Australian dollar has extended its losses on Wednesday. AUD/USD is trading at 0.6415 in the North American session, down 0.44% on the day.
Australia's inflation rate remained unchanged in April at 2.4% y/y for a third straight month, matching the lowest rate since Nov. 2024. The reading was slightly higher than the market estimate of 2.3% but remained within the central bank's inflation target of 2%-3%. Trimmed mean inflation, the central bank's preferred indicator for underlying inflation, edged up to 2.8% from 2.7% in March.
The inflation report was mildly disappointing in that inflation was hotter than expected. Underlying inflation has proven to be persistent which could see the Reserve Bank of Australia delay any rate cuts.
The markets have responded by lowering the probability of a rate cut in July to 62%, compared to 78% a day ago, according to the ASX RBA rate tracker. A key factor in the July decision will be the second-quarter inflation report in late July, ahead of the August meeting.
The Reserve Bank lowered rates last week by a quarter-point to 3.85%, a two-year low. The central bank left the door open to further cuts, as global trade uncertainties are expected to lower domestic growth and inflation.
The Federal Reserve releases the minutes of its May 7 meeting later today. At the meeting, the Fed stressed that it wasn't planning to lower rates anytime soon and the minutes are expected to confirm the Fed's wait-and-see stance.
US President Trump has been zig-zagging on trade policy, imposing and then cancelling tariffs on China and the European Union. Fed Chair Powell said at the May meeting that the economic uncertainty due to tariffs means that the appropriate rate path is unclear and that message could be reiterated in the Fed minutes.
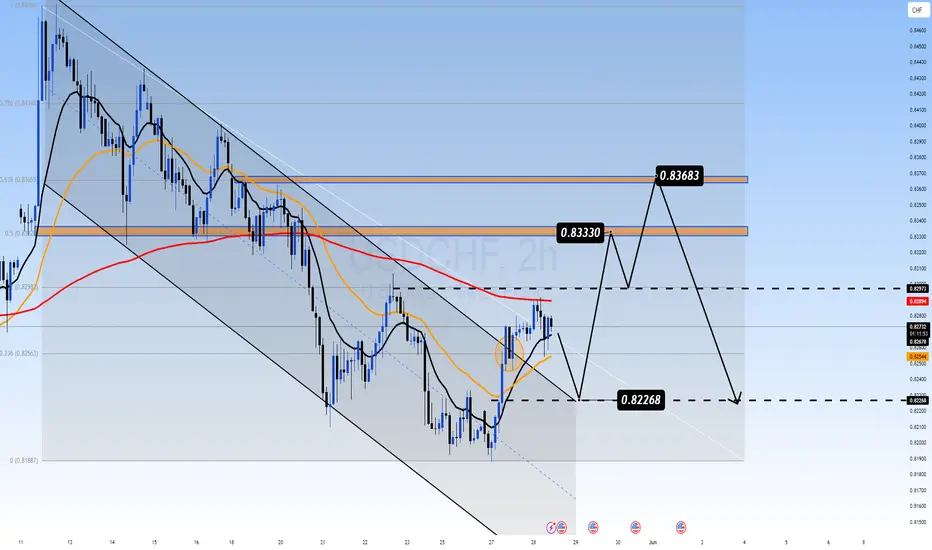
USDCHF – Awaiting Breakout Ahead of FOMC: Key Levels in Focus USDCHF – Awaiting Breakout Ahead of FOMC: Key Levels in Focus
📌 MARKET OVERVIEW
USDCHF is currently consolidating within a tight range after a technical rebound from the 0.8226 support zone. The price is testing a confluence area at the descending trendline and the 200 EMA on the H2 chart, indicating indecision between bulls and bears as we head into the high-impact FOMC event.
🔍 TECHNICAL ANALYSIS – H2 CHART
Overall Trend: Sideways corrective move within a broader downtrend channel. Price is approaching critical resistance at the EMA200 and the channel’s upper boundary.
EMAs in focus: EMA13 (black), EMA34 (orange), EMA89 (red).
Fibonacci Retracement: Price is hovering around the 0.5 fib zone (0.8298), a neutral level for potential reaction.
🎯 Key Levels & Trade Scenarios:
Major Resistance Zone: 0.8330 – 0.8368 → aligned with the 0.618 Fibonacci retracement and previous structural high.
Key Support Zone: 0.8226 → strong demand area. A break below this could expose deeper downside or set up a false break trap.
📌 Most Likely Path:
Price could dip back to 0.8226 before launching a bullish recovery targeting 0.8330 – 0.8368.
A clean breakout above 0.8368 with momentum and volume could invalidate the bearish bias and shift the trend mid-term.
🌍 MACRO & FUNDAMENTAL CONTEXT
FOMC IN FOCUS: The Federal Reserve is expected to hold rates steady at the upcoming meeting. However, market attention will be on Powell’s tone. A hawkish stance could fuel further USD strength, propelling USDCHF toward resistance zones.
SNB (Swiss National Bank) maintains a neutral tone with slight disinflationary concerns, offering limited support for the CHF and strengthening the USDCHF upside case.
US Treasury Yields are showing signs of recovery, adding bullish pressure to USD pairs.
📌 TRADING STRATEGY:
Watch for bullish reaction at 0.8226 – potential long setup if RSI divergence appears.
Short-term targets: 0.8330 → 0.8368.
Breakout Strategy: If price clears 0.8368 with conviction, shift bias to bullish continuation and monitor for FVG or trendline breakout alignment.
📣 Stay sharp for increased volatility around FOMC. Position sizing and discipline are key in macro-heavy weeks like this.
GBP/USD Ready to Explode or Collapse? All Eyes on 1.3600British Pound (CFTC - CME)
Commercial traders increased their long positions by +1,839 contracts and short positions by +3,597. Net exposure remains negative, but the significant short increase suggests active hedging and risk management.
Non-Commercial traders (speculators) reduced their longs by -1,396 and increased their shorts by +1,827, signaling weakening sentiment toward the GBP.
Open Interest rose modestly by +465 → showing renewed engagement, though there’s clear divergence between Commercial and Non-Commercial positioning.
Implication: Net pressure remains bearish, but there's evidence of short saturation from Commercials, possibly hinting at a consolidation phase or reversal ahead.
USD Index (ICE Futures)
Non-Commercials increased both longs (+2,044) and shorts (+1,975), signaling indecision.
Commercials slightly increased long exposure (+689), while shorts remained mostly flat (-114).
Implication: The dollar shows cautious strengthening, but with no strong directional conviction. A period of ranging price action is likely.
2. Retail Sentiment
67% of retail traders are short GBP/USD, with only 33% long.
Volume favors short positions as well: 7,727 lots vs. 3,866 long.
Implication: From a contrarian perspective, the excessive short bias among retail traders supports a short-term bullish scenario, possibly driven by a short squeeze or liquidity run.
3. Historical Seasonality
May shows a historically bearish tendency:
10-Year Avg: -2.22%
5-Year Avg: -1.60%
2-Year Avg: -0.65%
Implication: Seasonal bias remains negative, but should be interpreted alongside COT and sentiment data to avoid misleading signals.
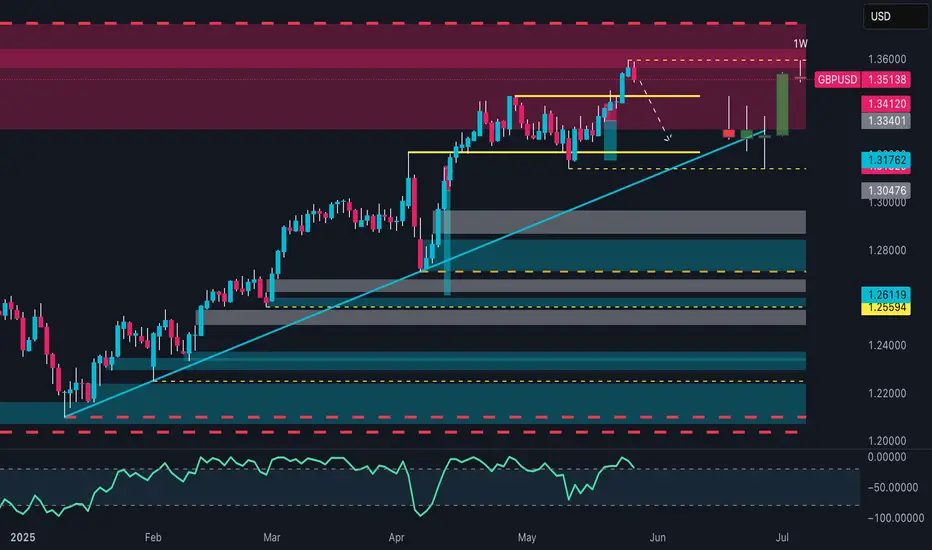
4. Technical Analysis
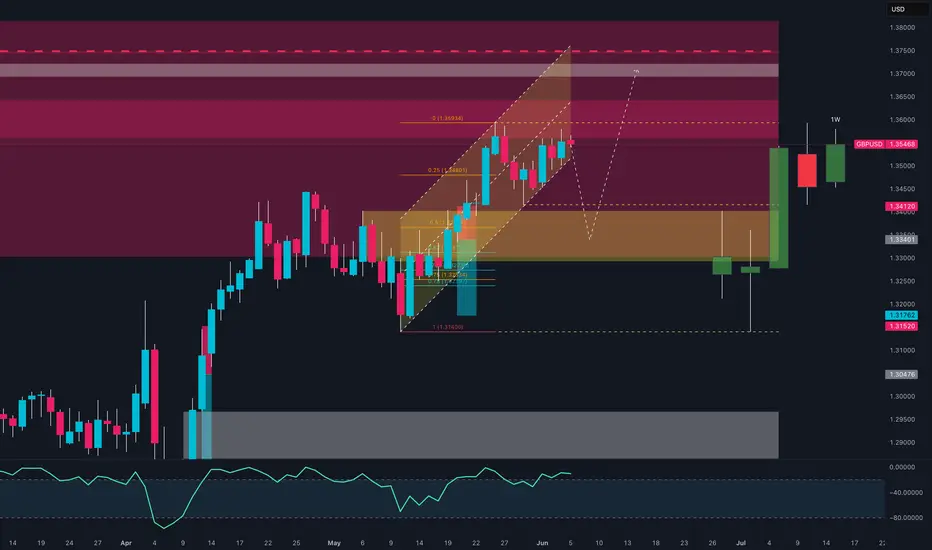
Price is currently trading inside a weekly resistance zone between 1.3513 and 1.3600, following a strong bounce from a dynamic support.
A previous structure break failed to follow through → bull trap was avoided.
The weekly RSI is rising from neutral levels, suggesting momentum is shifting upward.
Previous demand zones around 1.3176 and 1.3047 held well.
Implication: A potential breakout is forming, but it occurs near a key technical level. Without strong volume or fundamentals, the area may trigger a sell reaction.
5. Market Depth
There is a heavy cluster of short orders above current price, while long orders appear scattered and less aggressive.
This creates a liquidity magnet effect, which may lead to bullish spikes towards 1.3550–1.3600 before any meaningful distribution.
Implication: Potential upside extension in the short-term to hunt stops, followed by a bearish reaction.
🎯 Operational Outlook
Main Bias: Neutral-to-Bullish short-term, Bearish (Seasonal) mid-term
Key levels to watch:
Resistance: 1.3550–1.3600
Support zone: Ascending trendline and 1.3340–1.3176
Likely Scenarios:
Price may spike toward 1.3550 to clear liquidity before facing rejection.
A confirmed weekly close above 1.3610 opens the door to 1.3750.
A drop below 1.3340 confirms structural reversal and bearish continuation.
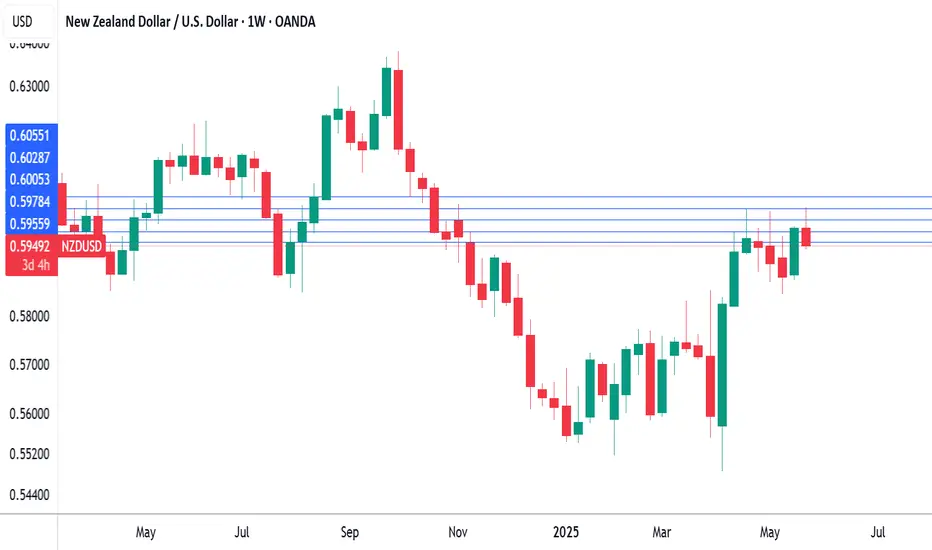
New Zealand dollar sharply lower, RBNZ cut expectedThe New Zealand dollar is sharply lower on Tuesday. In the North American session, NZD/USD is trading at 0.5950, down 0.83% on the day. A day earlier, the New Zealand dollar touched a high of 0.6031, its highest level since Oct. 2024.
The Reserve Bank of New Zealand is widely expected to lower rates by a quarter-point to 3.25% on Wednesday. With little doubt about the decision, investors will be focusing on the Reserve Bank's updated forecasts. The markets are looking at another rate cut in July and perhaps one more later in the year, which would lower the cash rate below 3.0%.
The RBNZ has been dealing with a weak domestic economy and a deteriorating outlook for the global economy due to US President Trump's erratic tariff policy. The RBNZ would like to continue trimming rates and restore consumer and business confidence.
New Zealand's inflation was higher than expected in the first quarter at 2.5%, up from 2.2% in Q4 2024. This is within the Bank's inflation target of 1%-3% and means that inflation levels won't prevent the Bank from lowering rates on Wednesday.
US durable goods orders plunges, consumer confidence surges
In the US, Durable Goods Orders declined by 6.3% m/m in April, after a 7.5% gain in March, which was the fastest pace of growth since July 2020. The soft reading managed to beat the market estimate of -7.8%. The Conference Board Consumer Confidence index, which has fallen steadily this year, surged to 98.0 in May, up from 86.0 in April and blowing past the market estimate of 87.0.
We'll hear from more Federal Reserve members on Wednesday, which could provide some insights into the Fed's rate path. The Fed has adopted a wait-and-see stance and is widely expected to hold rates for a fourth straight time at the next meeting on June 18.
NZD/USD has pushed below support at 0.5978 and is testing 0.5955. Below, there is support at 0.5928
There is resistance at 0.6005 and 0.6028
USD/JPY Breakdown: Is 140 the Next Target? Smart Money Says Yes!USD/JPY is currently in a highly interesting technical and macro phase, characterized by divergences between price action and institutional positioning, negative seasonal signals, and retail sentiment that goes against what would typically be expected in a reversal scenario. Let’s break it down:
1. Institutional Positioning (COT Report)
The COT data reveals a mixed picture with bearish implications for USD/JPY:
On the USD side, non-commercial traders continue to increase their net long exposure (+2,044 new long contracts this week). However, this rise is almost equally offset by +1,975 new shorts, indicating indecision and hedging activity.
For the Japanese Yen, non-commercials (speculators) are significantly rebuilding long JPY positions, while commercials have started covering their short exposure.
📌 Implication: The net flow favors the Yen, meaning bearish pressure on USD/JPY. The increase in JPY long positions reflects expectations of a stronger Yen in the short to medium term.
2. Historical Seasonality
Seasonal data reinforces the bearish bias:
In May and June, USD/JPY has historically posted negative returns.
The 5-year average shows -0.57 in May and -0.76 in June, with both the 2Y and 10Y averages confirming a similar downward seasonal pattern.
📌 Implication: The current seasonal window does not favor a USD rebound vs. the Yen. Historically, the likelihood of downside increases into early summer.
3. Retail Sentiment
Retail traders are heavily long, with 64% positioned long on USD/JPY versus 36% short.
📌 Implication: From a contrarian perspective, this is a bearish signal. Markets tend to move against retail positioning, adding further downside risk.
4. Price Action & Technical Structure (Daily Chart)
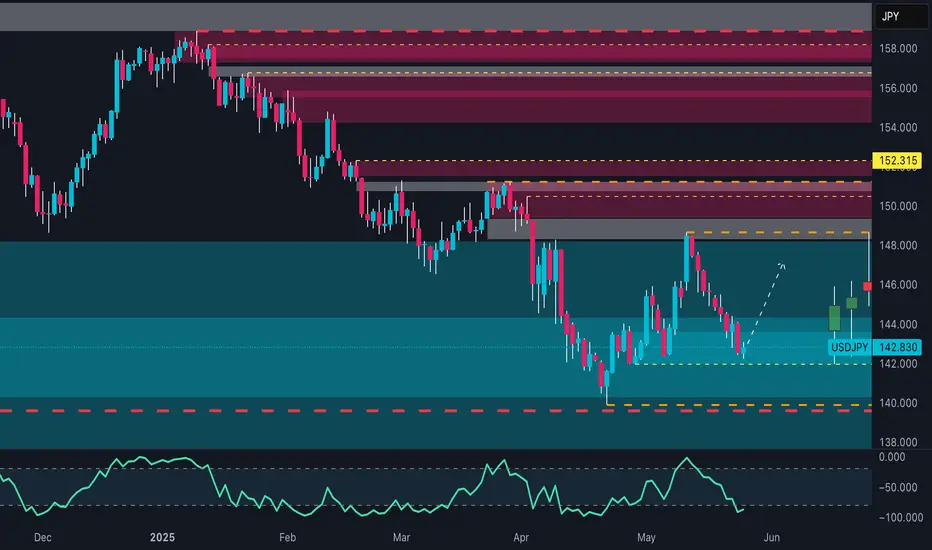
On the weekly chart:
Price broke the key 144.00 support decisively, closing the week at 142.81.
Structure shows lower highs and lower lows, typical of a bearish trend.
RSI is falling but still above oversold levels, leaving room for further downside.
First demand zone: 141.50–142.20. A confirmed break could open the way to 140.00–139.80.
Key resistance on any pullback: 145.00–146.00.
📌 Implication: The confirmed break of support activated a bearish continuation setup, unless short-term bounces offer new sell opportunities near resistance.
5. Market Depth
Market depth shows a strong cluster of long orders above current levels, while short volumes appear fragmented. This suggests any short-term rally could face aggressive selling between 144.50–145.50.
🎯 Conclusion & Operational Outlook
The overall context points to a high probability of further downside in USD/JPY over the short to medium term:
Smart money is rotating toward the Yen.
Seasonal patterns historically support a drop in May–June.
Contrarian retail sentiment adds additional bearish weight.
The weekly chart confirms a break of structure, opening space below 141.50.
EUR/USD at a Crossroads: Will the Bears Strike Back from 1.14? 📍1. TECHNICAL CONTEXT
EUR/USD is trading around 1.1405, inside an ascending channel and right within a supply zone (1.1370–1.1470), which already triggered a rejection on April 16. Price action currently shows hesitation, with three consecutive candles at the top of the channel and RSI divergence, suggesting a loss of bullish momentum after an overextension.
The bullish trendline from April remains intact and validated, but the upside is narrowing. Likely scenario: bullish exhaustion followed by a pullback towards 1.1270–1.1220, with a potential retest of both the trendline and the lower boundary of the channel.
📊2. COT REPORT (USD & EUR) – Updated to May 20
USD Index: Non-Commercials added +2,044 net longs, but also +1,975 new shorts. Open Interest rose by +2,207 → a more active market, but still mixed. Net exposure remains neutral to slightly bearish for the dollar.
EURO FX: Non-Commercials cut -3,587 longs and added +6,814 shorts, while Commercials increased longs by +16,796. Speculative funds are gradually shifting short on the Euro, while Commercials continue to hedge long.
→ Combined read: Large speculators are reducing their Euro exposure and staying cautious on the Dollar. Short-term pressure on EUR/USD remains bearish, though no macro reversal yet.
📉3. SENTIMENT & POSITIONING
Retail sentiment shows 71% of traders are short EUR/USD — a classically contrarian signal. However, price is now sitting in a liquidity cluster where smart money might exploit a final squeeze before a real reversal.
Market depth shows strong imbalance, with long orders stacked above current price — suggesting potential stop hunt already triggered or about to fade.
🧭4. SEASONALITY
Historically, May is a bearish month for EUR/USD: -0.0079 on 20-year average, and -0.0163 on 10-year average. Seasonality supports late May weakness and potential downside continuation into early June.
✅ TRADING OUTLOOK
📌 Primary Bias: short-term corrective bearish, waiting for clearer reversal signals.
📌 Key Reaction Zone: 1.1400–1.1470 → structural short area, already tested.
📌 Bearish Target: 1.1270 > 1.1210 (golden pocket + trendline confluence)
📌 Setup invalidation: daily close above 1.1470 with volume → possible extension to 1.1550/1.1580
📌 Macro support: Commercials remain long on the Euro → underlying structure still bullish, but too early to fade short-term bearish momentum.

Cocoa Explosion Loading? Specs & Hedgers Agree🔍 Fundamental Analysis – Commitment of Traders (COT)
The latest COT report, dated May 13, 2025, reveals a strong bullish accumulation signal, with a significant increase in long positions across all major trader categories.
Specifically, Non-Commercials (speculative traders such as hedge funds and money managers) increased their long positions by +3,490 contracts while simultaneously reducing shorts by -467 contracts. This dynamic reflects renewed speculative confidence in the cocoa bullish trend.
Simultaneously, Commercials (typically producers and processors) added +5,187 long contracts and closed -661 short contracts. This is especially noteworthy, as commercials usually take the opposite side of speculators. Here, however, their alignment with speculators may indicate expectations of upcoming supply constraints or market stress.
Total open interest rose by more than +6,000 contracts, suggesting real capital inflow into the market rather than just rebalancing.
This alignment between speculators and institutional hedgers is rare and often precedes further price appreciation.
📈 Net Positions & Price Action
Looking at the “Net Positions & Prices” chart over the past year, it’s clear that Non-Commercial net positions are recovering after a notable drop in March and April. This reversal aligns with the technical bottom and the start of the current price rally.
Commercials, although still net short (in line with their historical bias), are reducing their bearish exposure, hinting at lower physical supply pressure or a need for hedging against further price increases.
Price action has reflected this narrative, surging higher following the April lows.
🕰️ Seasonal Analysis
Seasonality adds another layer to the analysis.
Historically, May tends to be flat or slightly bearish (10Y and 15Y averages), but the 2-Year seasonal line—which better reflects current market behavior—shows a strong bullish tendency starting mid-month. This supports the ongoing rebound and increases the likelihood of further upside in the short term.
Historical data also shows that June, while volatile, is often positive or neutral in shorter cycles.
📊 Technical Analysis
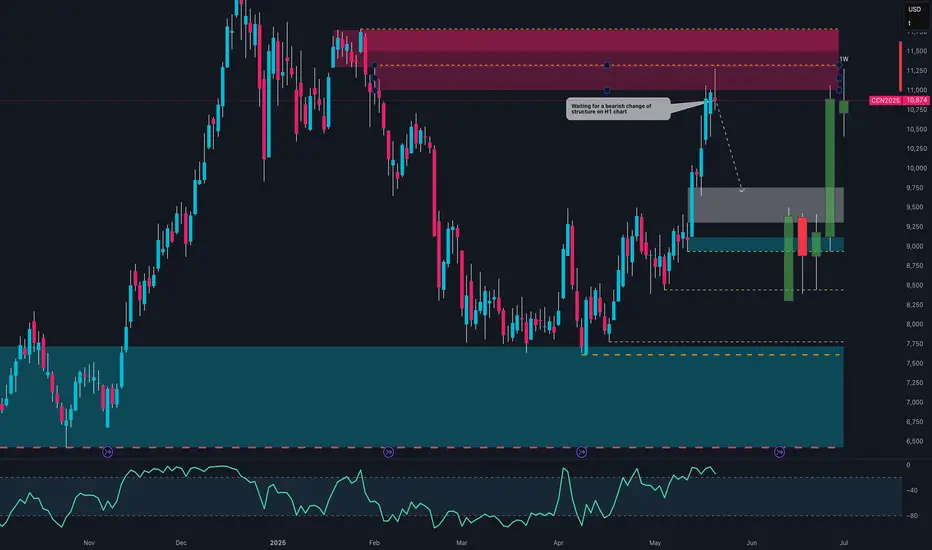
From a technical perspective, cocoa recently completed a strong bullish leg, rebounding from the 8,800–9,000 USD demand zone, identified as a clear area of institutional buying (evident through volume and impulsive candles).
The price then decisively broke through mid-range resistance levels and tested a key weekly supply zone between 11,200 and 11,500 USD, where it was initially rejected.
Currently, we are in a technical pullback, likely targeting the mitigation zone at 9,700–10,000 USD. This area represents a solid long entry opportunity if the market confirms a bullish structure on intraday charts (H1 or H4).
The RSI is near overbought, yet without divergence—suggesting the trend remains structurally bullish despite a natural correction.
🧭 Strategic Conclusion
Cocoa currently shows a rare convergence of bullish signals: supportive COT positioning, increasing net long interest, strong 2Y seasonality, and clear technical structure controlled by buyers.
However, after the recent sharp upside move, a correction to key support zones is likely before another bullish leg unfolds.
GBP/USD About to Explode?GBP/USD is currently trading around the 1.3360–1.3380 zone after testing the key weekly resistance area between 1.3400 and 1.3450. The bullish momentum remains strong, supported by speculative positioning still favoring the pound, while the dollar shows signs of softening. On the macro side, the interest rate differential between the UK and the US may narrow in the coming months, but for now, it continues to support upward pressure on the pair.
From a technical standpoint, price has broken out of an ascending triangle on the daily chart, showing strong momentum and confirmation with multiple closes above 1.3300. Market sentiment remains skewed to the short side, adding contrarian fuel to the bullish bias. The key short-term support lies between 1.3270 and 1.3300. As long as this area holds, the base case favors a continuation toward 1.3520 and potentially 1.3600. A break below 1.3170 would invalidate the current bullish structure and open the door for a deeper pullback toward 1.3000.
From an execution standpoint, a confirmed breakout above 1.3415 could offer a long entry opportunity with active management. Still, caution is advised around the weekly supply zone due to its historical responsiveness. Eyes remain on upcoming macro data and potential volatility from central bank statements.