Fed speak - Not broken, not cutting “Don’t fix what isn’t broken” seems to be the Fed’s current stance. Two Fed officials made that clear over the last 24 hours.
Vice Chair for Supervision Michael Barr warned that tariffs could fuel inflation by lifting short-term expectations, triggering second-round effects, and making inflation more persistent.
New York Fed President John Williams echoed that view, noting that tariff-driven inflation is “likely to get stronger in the months ahead.” He also called policy “well positioned” and said the Fed needs more data before making any move.
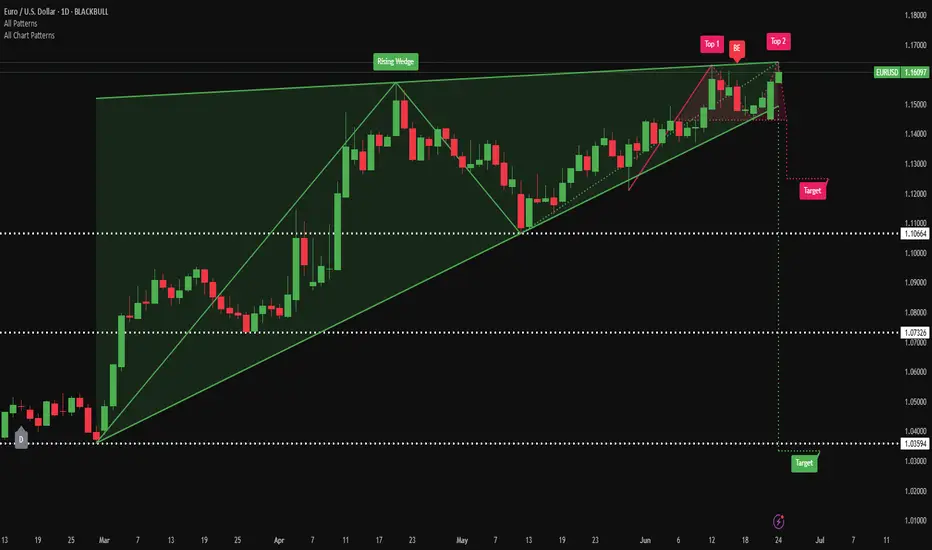
EUR/USD has formed a rising wedge pattern on the daily chart—typically a bearish structure that warns of a potential reversal. Price action has narrowed, building two clear tops. The downside target from the wedge could potentially be 1.1066 initially, and possibly down to 1.0732 if bearish momentum accelerates.
Fed
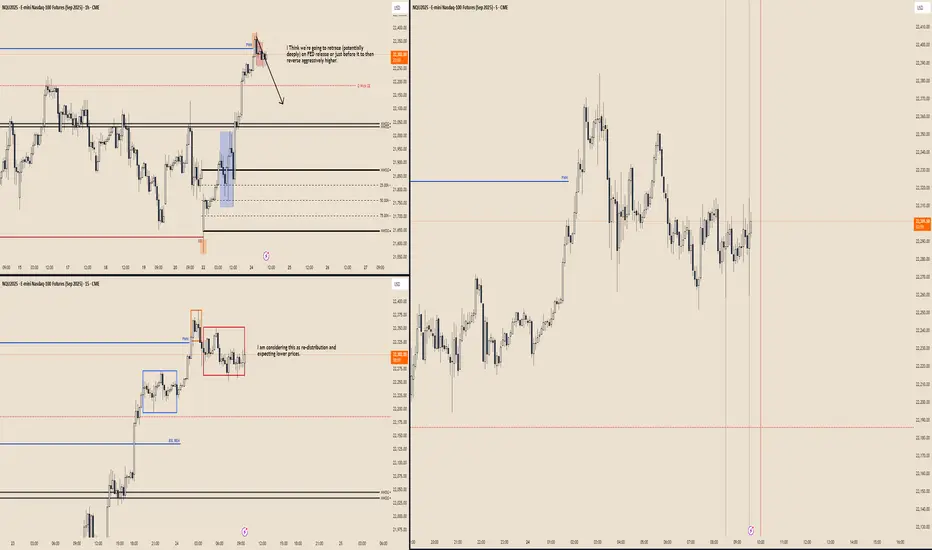
Nasdaq Deep Bearish RetraceI Think we're going to retrace (potentially deeply) on FED release or just before it to then reverse aggressively higher.
I am considering the current "range" on m15 as re-distribution and expecting lower prices on Fed release or just prior before continuation higher that may be delayed till tomorrow next FED.
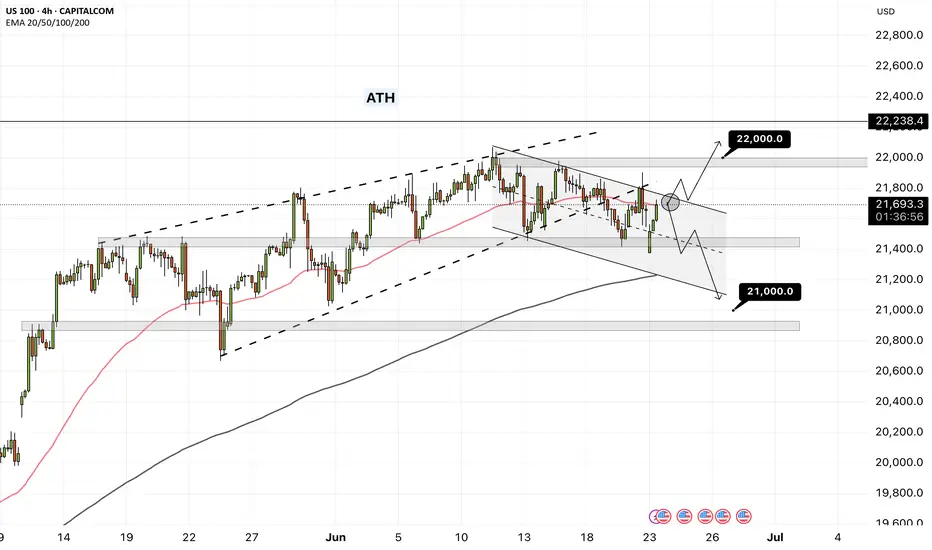
NAS100 - Will the stock market continue to rise?!The index is trading in its short-term descending channel on the four-hour timeframe between EMA200 and EMA50. If there is no re-up and the channel is broken, I expect a correction to form, the target of which can be the bottom of the descending channel.
If the channel top is broken, we can expect a new ATH to be recorded in the Nasdaq index. It is better to wait for confirmation in case of a breakdown in order to control the risk further.
Over the past week, the Nasdaq has managed to stay within a stable range, especially despite geopolitical pressures, mixed signals from the Federal Reserve, and some concerns in the semiconductor sector. This stability is largely due to the strong fundamentals of large technology companies, the reduction in distribution days (selling pressure) in the market, and renewed expectations of interest rate cuts later in the year.
At a structural level, the number of distribution days, which indicate selling pressure from large institutions, has reached a relatively low number of 3 days in the Nasdaq over the past month. This is a sign of the weakness of heavy selling at price peaks and the market's willingness to maintain long positions. Unlike trends seen in previous years, this time the market has shown no signs of widespread divergence or fundamental weakness, even despite strong inflation data or concerns about new trade restrictions with China.
This trend is largely supported by the stellar performance of companies such as Nvidia, Microsoft, Apple and other major players in the artificial intelligence and technology sectors. Revenue growth, increased investment in AI infrastructure, as well as the return of institutional investors’ confidence in technology stocks, have led the Nasdaq to record significant returns since the beginning of 2025. Analysts from major financial institutions such as Goldman Sachs and Morgan Stanley, while warning of potential selling pressure on the index, remain positive about continued growth, of course, assuming that economic data does not deviate from the expected path.
However, some risks are clearly visible in the trading week ahead. The most important of them is the possibility of geopolitical tensions again affecting the market. In recent days, oil prices have risen and financial markets have experienced moments of fear after tensions in the Middle East escalated and the US political response to Iran and Israel's moves. Although the Nasdaq was able to withstand these fluctuations, the market remains very sensitive to energy price spikes and their impact on inflation.
Important data in the coming week could also determine the market's direction. The release of the Core PCE index, the Fed's preferred inflation measure, as well as data on unemployment insurance claims, both play a key role in the interest rate outlook. If inflation data is lower than expected, the likelihood that the Fed will start cutting rates in September or November increases, which would be a bullish stimulus for the stock market and especially the Nasdaq.
On the other hand, potential pressure on the semiconductor group - especially if new restrictions on technology exports to China are imposed - could disrupt the market trend. Last Friday, just one news report on the possibility of restricting exports of advanced chipsets caused the Nasdaq to fall by more than 0.6%. If this trend becomes official US government policy, it could cause a correction in stocks of companies such as Nvidia, AMD and ASML, which are heavy weights in the Nasdaq index.
In addition to these factors, next week will also see the release of quarterly reports from major companies such as Micron, FedEx and Nike. The results of these reports, especially in the area of sales and cost forecasts, could affect economic growth expectations. If the figures are better than expected, the Nasdaq could move towards new highs. However, if the data is released, the market could enter a short-term correction phase.
In terms of correlation with monetary policy, the Nasdaq index has become more sensitive than ever to interest rates and cash flows. The dollar price, real interest rates, and the direction of Treasury bonds all now have a direct impact on the valuation of technology companies. As a result, any change in the path of monetary tightening or easing is immediately reflected in the Nasdaq’s performance. However, analysts believe that the market will remain in a “wait and see” phase until the official data is released in July. In summary, the Nasdaq index is currently in a situation where its fundamentals are supported by the profitability of large technology companies, the easing of institutional selling pressure, and the possibility of a rate cut. At the same time, the market remains highly sensitive to major geopolitical news, trade policy, and economic data. As a result, the week ahead can be considered a “two-sided” period, where opportunities and threats are in a delicate balance, and only economic data and quarterly results can tip the balance in the direction of an increase or a correction.
GBP/JPY in Trouble? Smart Money Rotates Into Yen📊 1. COT Analysis
JPY (Japanese Yen):
Non-Commercial Net Long: +54,615 – showing strong long accumulation since March.
Recent Changes:
Long: -5,319
Short: +1,235
➡️ Mixed signals short-term, but overall net long positioning remains strong. Speculative funds are still heavily favoring the Yen, suggesting potential continued strength.
GBP (British Pound):
Non-Commercial Net Long: +51,634 (111,076 long – 59,442 short)
Recent Changes:
Long: +7,404
Short: -9,015
➡️ Specs are still net long on GBP, but exposure has slightly decreased. The divergence with the Yen is narrowing.
🔎 COT Summary:
Both currencies are being bought by speculators, but the JPY has shown more consistent long-term positioning. Net momentum appears to shift in favor of Yen strength, pointing to potential downside for GBP/JPY.
📅 2. Seasonality – June
Historically, June is a weak month for GBP/JPY, especially over 20y, 15y, 5y, and 2y windows.
Monthly average return is negative across all major historical timeframes (e.g. -1.2415 over 10 years).
➡️ Seasonality reinforces a bearish bias for June.
🧠 3. Retail Sentiment
Short: 52%
Long: 48%
➡️ Retail positioning is balanced, slightly skewed short. Not a strong contrarian signal, but also doesn’t support a bullish breakout scenario.
📉 4. Technical Analysis
Current Structure: Ascending channel from mid-May → currently testing lower boundary.
Key Zone: 195.600–196.520 is a major supply zone with multiple rejections.
Recent Candle Action: Bearish pin bar + engulfing candle → strong rejection from resistance.
Downside Targets:
First: 193.076
Second: 191.439
Break of the channel would further confirm a trend reversal.
➡️ Price action supports a short scenario with high reward-to-risk toward lower zones.

CADJPY Bearish Reversal? Smart Money + Seasonal Confluence🧠 COT Sentiment
Speculators are heavily net short on CAD (–93K), while maintaining a strong net long position on JPY (+144K).
→ This positioning clearly favors JPY strength over CAD weakness.
Commercials are hedging JPY downside, but the dominant flow remains JPY bullish.
📅 Seasonal Patterns
Historically, June is weak for CAD (5Y, 10Y, 15Y averages all negative).
Meanwhile, JPY tends to strengthen in the second half of June.
→ Seasonality supports a bearish outlook on the pair.
📉 Technical Structure
Price has reacted precisely to the Fibonacci 0.705 retracement (106.23) and is showing signs of RSI divergence.
We are trading within a key supply zone between 106.70 and 108.30, which also aligns with a major resistance cluster and harmonic extension.
First target sits at 103.88, with potential extension to 101.20 if breakdown confirms.
🛢 Macro Catalyst
Oil remains under pressure.
CAD retail sales dropped significantly.
Risk-off sentiment (cautious Fed + geopolitical tensions) favors JPY as a safe haven.
📊 Retail Sentiment
62% of retail traders are short, but with an average entry at 108.49.
→ A break below 106 could trigger liquidation, fueling further downside.
🧩 Trade Setup
🔹 Entry zone: 106.70–107.00
🔸 SL: Above 108.40 (invalidates the bearish thesis)
🎯 TP1: 103.88 (S/R retest)
🎯 TP2: 101.20 (extended target on risk aversion)
🧭 Synthesis
Every angle aligns toward a potential bearish reversal on CAD/JPY:
✅ COT positioning
✅ Seasonality
✅ Macro narrative
✅ Technical confluence
✅ Retail sentiment trap

EURJPY Just Broke Out – Is This the Start of a Summer Rally?📊 1. COT Report – Euro & Yen
EUR (Euro FX – CME):
Non-Commercials:
Long: +5,968 | Short: -4,293 → Net Long increasing
Commercials:
Long: +11,480 | Short: +24,451 → Net Short
→ Speculators are clearly bullish on the euro.
JPY (Japanese Yen – CME):
Non-Commercials:
Long: -5,319 | Short: +1,235 → Net Long decreasing
Commercials:
Long: +31,893 | Short: +25,462 → Hedging, but still net short
→ The yen continues to be sold, especially by institutional players.
📌 EUR/JPY COT Summary:
Speculators are buying EUR and selling JPY → strong bullish bias on EUR/JPY.
🧠 2. Retail Sentiment
80% of retail traders are short EUR/JPY, with an average entry at 161.50
Current price is around 167.20 → retail is heavily underwater
✅ Strong contrarian bullish signal
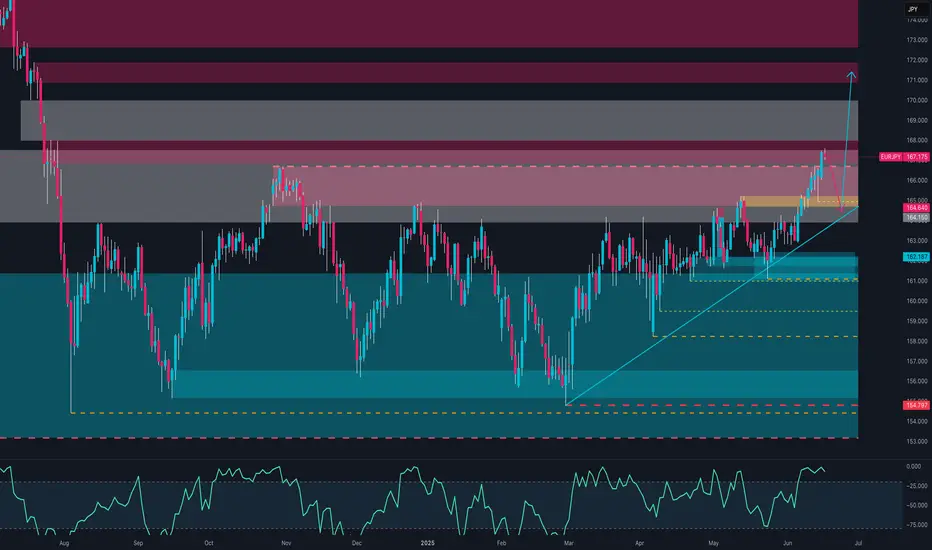
📉 3. Technical Analysis
Price broke out of a long-term range, printing new yearly highs
RSI is overbought but with no active bearish divergence
Price sits inside a major supply zone between 166.50 and 168.00, where previous rejections occurred
A potential pullback to the 164.60–164.15 area aligns with ascending trendline support
🟡 Likely Scenario:
A healthy technical pullback to 164.50–165.00 to cool off RSI,
followed by a continuation higher if supported by momentum and COT positioning
📅 4. Seasonality
June is historically a bullish month for EUR/JPY:
5-year avg: +1.167%
2-year avg: +2.41%
→ Seasonality supports more upside into early July
🌍 5. Macro Context
BoJ remains dovish, no sign of imminent tightening
ECB is steady but relatively less dovish → rate differential still favors the euro
No signs yet of verbal intervention from Japan.
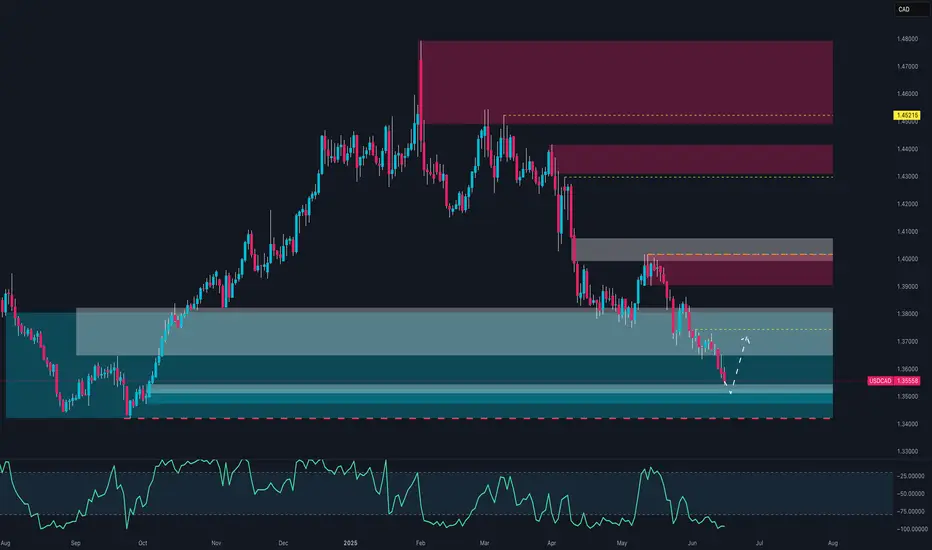
Smart Money Just Flipped Bearish on USD/CAD. Are You Still Long?🧠 1. COT Context & Institutional Flows
🇨🇦 CAD COT Report (CME) – June 10, 2025
Non-Commercials (speculators): net short 93,143 contracts (19,651 long vs. 112,794 short), with a short reduction of -14,319 → early bearish unwinding.
Commercials: net long 91,207 contracts (223,285 long vs. 132,078 short), with strong accumulation (+27,999 longs).
🔄 Net open interest change: +18,436 → renewed institutional interest on the long CAD side.
🇺🇸 USD Index COT Report (ICE) – June 10, 2025
Non-Commercials: net long 1,402 contracts (17,027 long vs. 15,625 short), with a +1,279 increase in longs → modest USD support.
Commercials remain net short -35 contracts, no clear shift.
🔄 Total open interest +2,652 → mild bullish interest in USD.
📌 Implication: Strong institutional support for CAD, USD mildly supported. Net positioning favors downside pressure on USD/CAD.
💹 2. Technical Analysis & Price Action
Primary trend: clearly bearish from the 1.38 zone.
Current price: 1.3552, testing a macro demand zone (1.3470–1.3540).
Daily RSI remains deeply oversold → possible technical bounce, but no reversal structure confirmed.
Recent candles show lower highs and lower lows, with no bullish momentum.
📌 Implication: The bearish trend remains in control. A technical rebound is possible, but bias stays short as long as price trades below 1.3640.
📈 3. Retail Sentiment
77% of retail traders are long USD/CAD, with an average entry at 1.3646.
Only 23% are short, positioned better at 1.3790.
📌 Implication: Retail is heavily long → contrarian bearish signal confirmed.
📊 4. Seasonality
June is historically weak for USD/CAD:
5Y Avg: -0.0118
2Y Avg: -0.0081
The June seasonal curve shows a stronger downside acceleration into the second half of the month.
📌 Implication: Seasonality adds downward pressure into month-end.
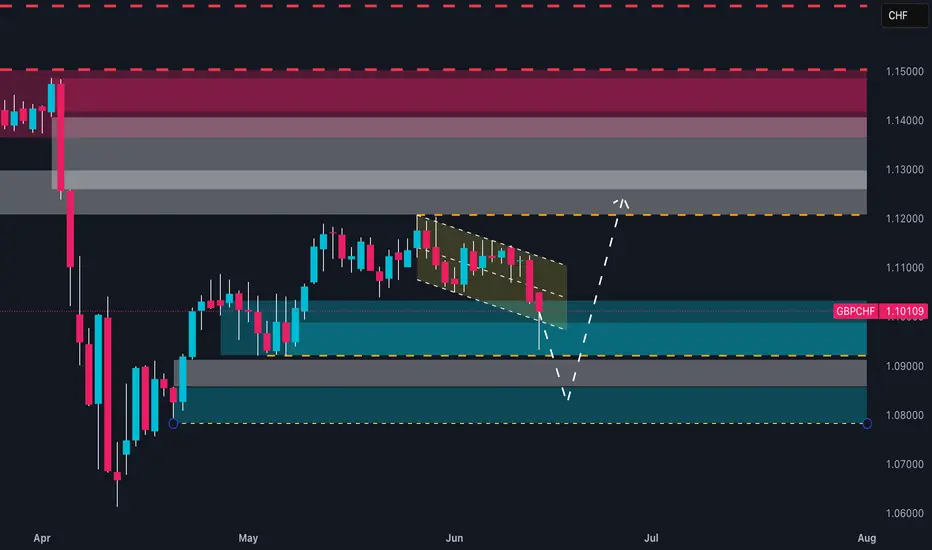
Retail is 86% Long on GBPCHF… But Smart Money Is Setting a Trap📊 1. RETAIL SENTIMENT
Long Positions: 86% – Average Entry: 1.1196
Short Positions: 14% – Average Entry: 1.0999
Current Price: 1.1010
Analysis:
Retail positioning is heavily skewed towards longs, with the average long entry significantly above the current market price. This creates vulnerability to downside pressure through stop-loss hunting or a bearish squeeze. Such extreme retail bias often acts as a contrarian signal: smart money may continue pushing the price lower to flush out retail traders before any meaningful reversal occurs.
🧾 2. COMMITMENTS OF TRADERS – COT REPORT (June 10, 2025)
🔹 British Pound (GBP)
Non-Commercials (Speculators): Net Long increasing by +7.4K → now at +51.6K
Commercials (Hedgers): Net Short decreasing by -13.9K → now at -60.5K
Total Open Interest: Decreased by -19K
Interpretation:
Speculators are maintaining strong long exposure on GBP, while commercials are covering some shorts—potentially signaling a short-term pause in bullish momentum. However, the drop in overall open interest suggests possible consolidation or short-term uncertainty.
🔹 Swiss Franc (CHF)
Non-Commercials: Net Shorts reduced by -2.7K
Commercials: Net Longs increased by +2.5K
Total Open Interest: Increased by +5.6K
Interpretation:
The CHF is gaining strength. Commercial participants are increasing their long exposure while speculators reduce their shorts—this positive divergence supports a bullish outlook on CHF, especially against retail-heavy long pairs like GBP.
📈 3. CHF SEASONALITY – JUNE
Average CHF Performance in June:
20-Year Avg: +0.0099
15-Year Avg: +0.0138
10-Year Avg: +0.0099
5-Year Avg: +0.0039
Analysis:
Historically, June is a seasonally strong month for the Swiss Franc. This seasonal bias aligns with current macro conditions, reinforcing the bullish case for CHF.
📊 4. TECHNICAL ANALYSIS (Daily Chart)
Pattern: Descending channel with a recent false breakdown and re-entry
Key Support Zone: 1.0980–1.1000 → tested and defended with a bullish wick
Target Resistance: 1.1170–1.1200 → prior retail cluster, supply zone, and average long entry
Scenario: A confirmed breakout of the channel could trigger a short squeeze toward 1.1170–1.1200
📌 STRATEGIC OUTLOOK
The current GBP/CHF setup is technically and sentimentally delicate. The price sits on a major daily demand zone, while sentiment and macro flows suggest downside pressure remains in play—but also allow room for a potential contrarian rally (short squeeze).
👉 Action Plan:
Wait for intraday/daily confirmation:
Go long above 1.1045 (breakout confirmation) → target 1.1170
Go short below 1.0980 (bearish continuation) → target 1.0860
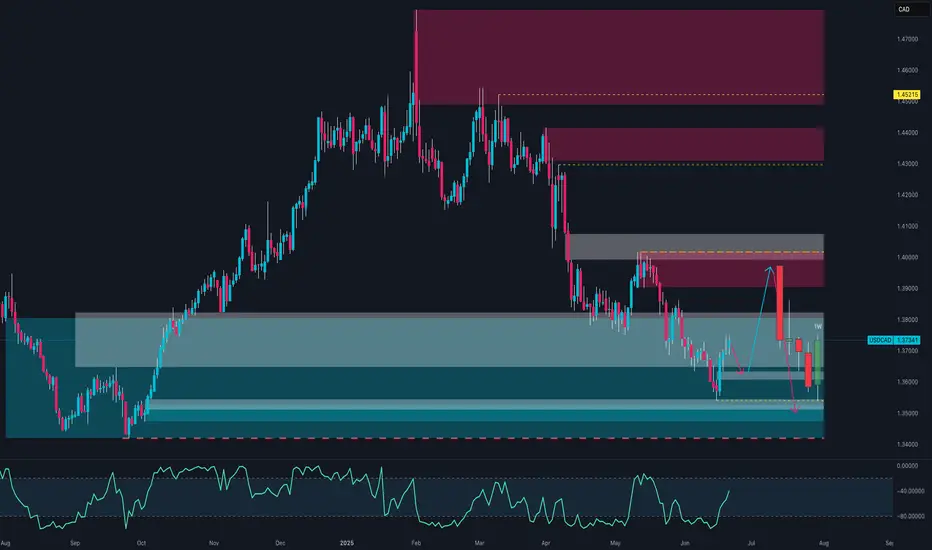
USD/CAD Trap in Progress? Smart Money Flips BearishUSD/CAD is currently in a rebalancing phase after the strong downside correction seen over recent weeks. Following a rejection in the 1.3900–1.4000 supply zone, price retraced down to a major demand area between 1.3500 and 1.3650, where it has shown a notable bullish reaction. The pair is now trading at 1.3734, and multi-frame data suggests we are in a transitional phase—not yet a confirmed bullish trend reversal.
COT Report – Institutional Positioning
The latest Commitments of Traders data (June 10th) reveals critical signals:
Commercials (hedgers and large institutions) have aggressively increased their long exposure on CAD, adding +27,999 contracts. This indicates strong expectations of Canadian dollar appreciation—bearish implications for USD/CAD in the medium term.
Non-Commercials (speculators) reduced their short CAD exposure by -14,319 contracts, signaling that speculative players are starting to unwind long USD/CAD positions.
Overall, the net shift shows institutional sentiment turning bearish on the pair, potentially pointing to a deeper downside once the current technical pullback completes.
USD Index COT – Dollar Momentum Weakening
On the USD Index, Non-Comms have added +1,279 long contracts, but positioning remains moderate. Commercials are flat, suggesting the dollar lacks strong bullish backing. This makes any sustained USD/CAD rally structurally fragile.
Retail Sentiment
Retail traders are 57% short and 43% long on USD/CAD. Although not extreme, this imbalance suggests confidence among retail participants in a bearish move—often preceding a short-term upward squeeze before an eventual trend continuation.
We could therefore see price move toward 1.3900 as a liquidity grab, setting the stage for a larger reversal.
Technical Analysis – Outlook
Key highlights:
A strong bullish reaction occurred from the 1.3500–1.3650 demand zone, previously well-respected.
The weekly RSI is still below the 50-level but is turning upward—momentum is improving.
Price structure shows room for a pullback to the 1.3900–1.4000 supply zone, which aligns with higher-timeframe order blocks.
This zone remains a critical resistance, and unless the macro and positioning context changes, a renewed bearish impulse is expected from this area.
Trading Outlook
The current picture presents a tactical short-term long opportunity, followed by a potential structural short setup.
📈 Scenario 1 – Bullish Pullback (in play):
With price above 1.3700 and consolidating, there’s space for a rally toward the 1.3900–1.4000 supply zone. Ideal for short-term targets.
📉 Scenario 2 – Structural Short (priority bias):
Should price reach 1.3950–1.4000 and show bearish confirmation (e.g., engulfing, doji, rejection on H4/H1), this would be a prime area to initiate swing shorts, targeting 1.3600 and eventually 1.3450.
✅ Final Bias: Structural Bearish – Corrective Bullish
Watch for potential false breakouts above 1.3800–1.3900 to liquidate retail shorts before a more meaningful downside move. The sharp increase in commercial net long CAD positions supports a bearish USD/CAD bias for the coming weeks.
Pound Steady as BoE holds ratesThe British pound is showing limited movement for a second straight day. In the European session, GBP/USD is trading at 1.3435, up 0.18% on the day.
The Bank of England didn't have any surprises up its sleeve as it held rates at 4.25%. This follows a quarter-point cut at last month's meeting. The MPC vote indicated that six members voted to hold while three voted to lower rates. The markets had projected that the vote would be 7-2 in favor of holding rates.
Today's decision to hold rates was widely expected, but that doesn't mean there aren't economic signals which support a rate cut. The UK economy is in trouble and GDP came in at -0.3% in April, its deepest contraction in 18 months.
The weak economy could desperately use a rate cut, but inflation remains stubbornly high and a rate cut would likely send inflation even higher. Annual CPI remained at 3.4% in May, its highest level in over a year.
The geopolitical tensions, most recently the war between Israel and Iran have led to greater economic uncertainty and complicated any plans to lower rates. The BoE is expected to lower rates one or twice in the second half of the year, with the direction of inflation being a key factor in the Bank's rate path.
The Federal Reserve held rates at Wednesday's meeting for a fourth straight time. The Fed noted that inflation remains higher than the target but said the labor market remains strong. President Trump has pushed hard for the Fed to lower rates but Fed Chair Jerome Powell has stuck to his position and repeated on Wednesday that current policy was the most appropriate to respond to the economic uncertainty.

Pound recovers as UK CPI edges lowerThe British pound has stabilized on Wednesday. In the European session, GBP/USD is trading at 1.3551, up 0.28% on the day. The US dollar showed broad strength on Tuesday and GBP/USD declined 1.05% and fell to a three-week low.
UK inflation for May edged lower to 3.4% y/y, down from 3.5% in April and matching the market estimate. The driver behind the deceleration was lower airline prices and petrol prices. Services inflation, which has been persistently high, eased to 4.7% from 5.4%. Monthly, CPI gained 0.2%, much lower than the 1.2% gain in April and matching the market estimate.
Core CPI, which excludes food and energy, fell to 3.5% in May, down from 3.8% a month earlier and below the market estimate of 3.6%. Monthly, the core rate rose 0.2%, sharply lower than the 1.4% spike in April and in line with the market estimate. This marked the lowest monthly increase in four months.
The Bank of England will be pleased that core CPI moved lower but the inflation numbers are still too high for its liking. Headline CPI had been below 3% for a year but has jumped well above 3% in the past two months.
BoE policymakers won't have much time to digest today's inflation report as the central bank makes its rate announcement on Thursday. The markets are widely expecting the BoE to maintain the cash rate at 4.25%,
Investors will be keeping a close eye on the meeting, looking for hints of a rate cut later in the year. The UK economy contracted in April and with wages falling and unemployment rising, there is pressure for the BoE to lower rates, but that is risky with inflation well above the BoE's 2% inflation target.
US retail sales slumped in May, falling 0.9% m/m. This was well below the revised -0.1% reading in April and worse than the market estimate of -0.7%. Annually, retail sales fell to 3.3%, down sharply from a revised 5.0%.
Consumers are wary about the economy and anxiety over Trump's tariffs has weighed on consumer spending. If additional key US data heads lower, this will increase pressure on the Federal Reserve to lower interest rates.
GBP/US is putting pressure on resistance at 1.3480. Above, there is resistance at 1.3545
1.3364 and 1.3299 are providing support

Mr. LATE drop the RATE!!"Jerome Powell aspires to be remembered as a heroic Federal Reserve chair, akin to Tall Paul #VOLKER.
However, Volker was largely unpopular during much of his tenure.
The primary function of the Federal Reserve is to finance the federal #government and ensure liquidity in US capital markets.
Controlling price inflation should not rely on costly credit.
Instead, it should be achieved by stimulating growth and productivity through innovation and by rewarding companies that wisely allocate capital, ultimately leading to robust cash flows... innovation thrives on affordable capital.
While innovation can lead to misallocations and speculative errors, this is a normal aspect of the process.
(BUT it is crucial that deposits and savings are always insured and kept separate from investment capital.)
By maintaining higher interest rates for longer than necessary, J POW is negatively impacting innovators, capital allocators, small businesses that need cheap capital to function effectively, job creators, and the overall growth environment.
Addressing price inflation is a far more favorable situation than allowing unemployment to soar to intolerable levels.
"Losing my job feels like a depression".
But if I have to pay more for eggs, I can always opt for oats.

Fed expected to remain on hold and ‘likely’ a ‘Nothing Burger’It is widely regarded as a ‘sealed deal’ that the US Federal Reserve (Fed) will maintain the current target rate at 4.25% - 4.50% today, marking a fourth consecutive meeting on hold. This is likely to displease US President Donald Trump, who has repeatedly called for rate cuts, recently referring to the Fed Chairman Jerome Powell as ‘stupid’.
Despite Trump’s approach, I do not see a path where the central bank needs to cut rates today. While I would agree that the US economy is softening, it is not sufficient to ring alarm bells at the Fed. May’s inflation data were soft, suggesting stickiness and limited impact from tariffs, and domestic demand remains stable. Meanwhile, while the job market has demonstrated signs of weakening, the US remains at full employment. Couple this with vague trade policy and the recent escalation between Israel and Iran – with US involvement a possibility at this point – the Fed are unlikely to move on rates until later on in the year.
Markets are pricing in around two rate cuts this year (matching March’s Summary of Economic Projections ), targeting either the September or October meeting for the first 25-basis-point (bp) rate reduction. Were the Fed to throw a curveball and surprise markets by cutting rates by 25 bps today, it would trigger a sizable downside move in the US dollar (USD) and underpin a bid across the US equity market.
With that said, with a rate cut already baked in, the market’s focus will shift to the Fed’s rate statement, the press conference, and the updated SEP. Importantly, the fresh projections are the first out of the Fed since Trump’s ‘Liberation Day’ tariffs in early April.
Uncertain times
Uncertainty, although a somewhat overworked term at present, remains pertinent in today’s macroeconomic backdrop. Consequently, the Fed’s job of updating the dot plot (and the economic projections) is challenging. Like the market, Fed officials will struggle to gauge what the near-term future holds.
I would not be surprised to see Powell echo a similar sentiment to the one expressed at the March meeting. Nevertheless, it should not raise too many eyebrows to see the Fed adopt a more hawkish tilt in its updated projections, with a slight upward (downward) revision to inflation (GDP [Gross Domestic Product).
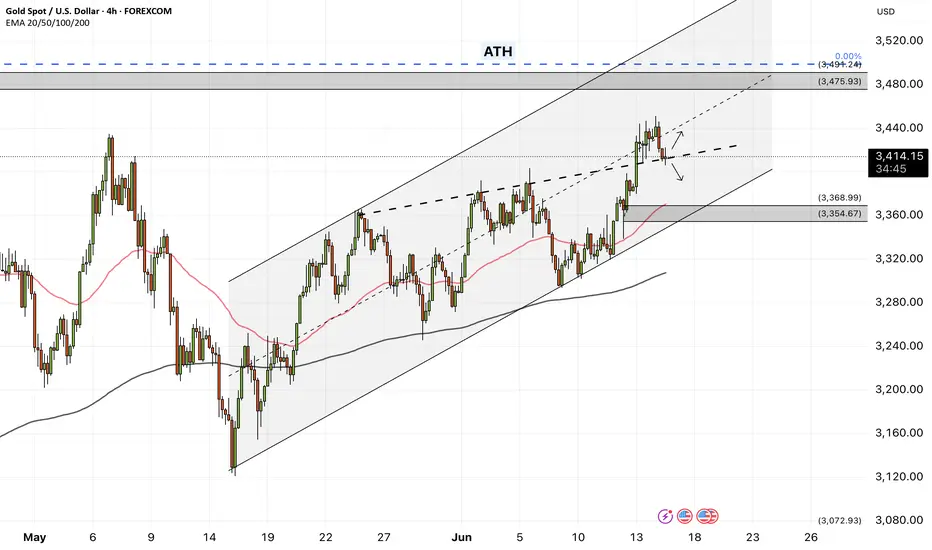
However, a marked change in direction in terms of lowering rates in the future from the Fed today is certainly something investors will be watching for, and could lead to increased volatility across major asset classes. If we see a dovish pivot, I will closely watch Spot Gold (XAU/USD), which has been hovering around all-time highs of US$3,500 for some time now.
Spot Gold trading at demand
A dovish scenario today could push the yellow metal towards the noted all-time high. As you can see from the chart below, daily flow has buyers and sellers squaring off within demand at US$3,343-US$3,392, which may provide enough of a floor to press higher today. In the event of a break south, the first port of call in terms of support would be at US$3,280, followed by another layer at US$3,208.
Written by FP Markets Chief Market Analyst Aaron Hill

Dollar In Fifth Wave-Reversal In Trend May Not Be Far Away.The Fed will announce its latest policy decision later, and expectations are that Powell will keep rates on hold, especially after last week's slightly higher inflation print and still solid US jobs data. We can see some stabilization in the US dollar ahead of this event, but we have to keep an eye on geopolitical tensions in the Middle East, which coudl also play a key role in driving safe haven flows.
Meanwhile, the stock market continues to trade sideways, and I don't expect any major breakouts or strong moves ahead of the Fed. Also, tomorrow is a holiday in the US, so that could contribute to slower market conditions into the end of the week, unless, of course, the situation in the Middle East gets worse.
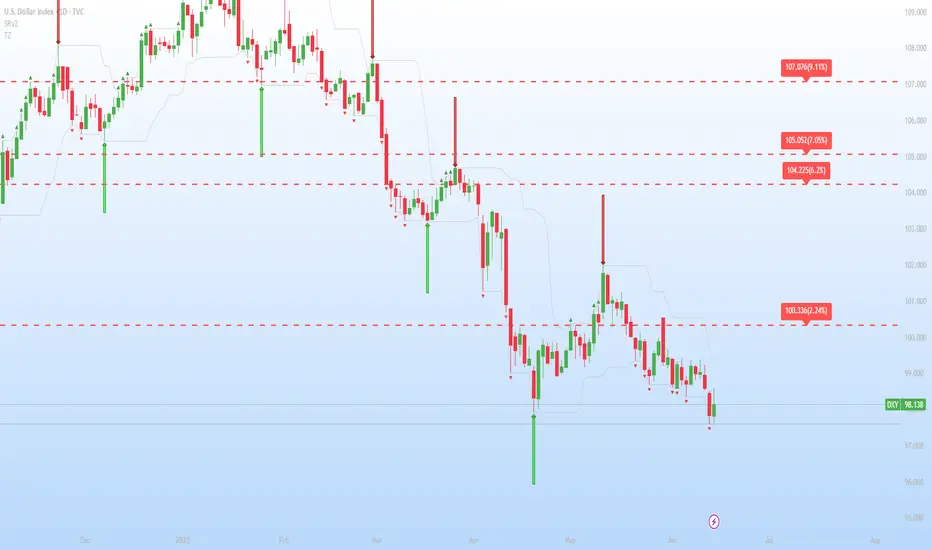
Looking at the DXY waves structure, I see athree-wave move from the most recent lows, so the fourth wave I highlighted a few days ago could now be approaching completion near this week’s key resistance around the 99 level. That’s definitely a level to watch for a potential fresh, but possibly final sell-off toward new lows around 97, maybe even 96.
That’s where the DXY could stabilize, as ending diagonal pattern signals that we are likely in the late stages of wave five, meaning this bearish cycle could soon come to an end.
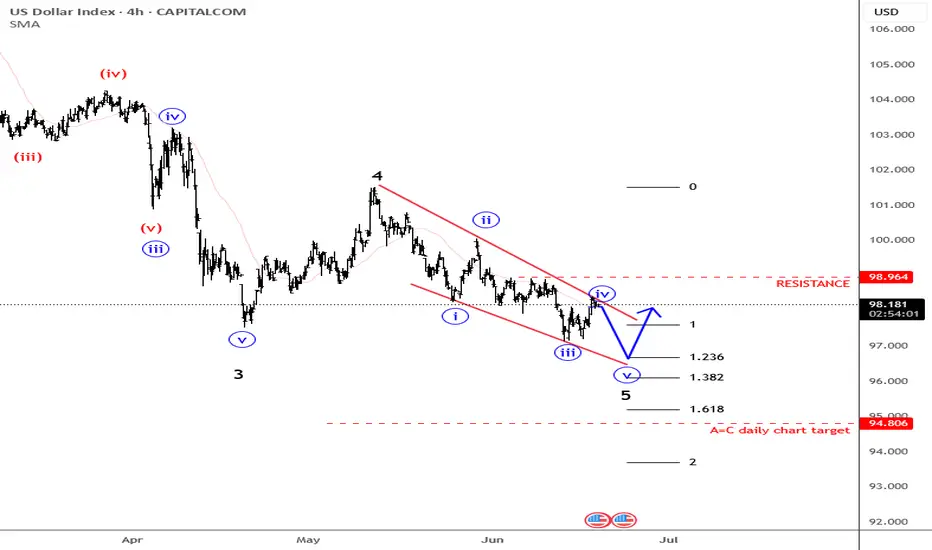
Tariff uncertainty keeps weighing on the dollar.
Geopolitical risks in the Middle East have eased slightly amid signs of potential negotiations, prompting markets to shift their focus back to the upcoming FOMC and tariffs. Following talks with Canadian Prime Minister Carney, President Trump stated that a trade deal with Canada could be reached within weeks, and also confirmed that a trade agreement with the UK has been signed.
Meanwhile, markets are almost certain that the Fed will keep rates unchanged at the upcoming FOMC, with the probability priced at 99.8%. Wells Fargo expects the inflation outlook to rise due to the delayed impact of higher tariffs, projecting that the year-end median federal funds rate will climb by 25bps to 4.125%.
DXY is consolidating within the 97.50–98.50 range, remaining below both EMAs, which suggests a potential continuation of bearish momentum. If DXY breaks below the support at 98.00, the index may retreat to 97.50. Conversely, if DXY breaches above the resistance at 98.50 and the descending trendline, the index could gain upward momentum toward 99.00.

XAUUSD - Is the gold bullish trend over?!Gold is trading in its ascending channel on the four-hour timeframe, above the EMA200 and EMA50. We should wait for consolidation or not above the drawn trend line to determine the future path of gold, which can be entered after its failure in the formed line, and on the other hand, if gold corrects towards the demand zone, it can be purchased in the short term with appropriate risk-reward.
Over the past week, the gold market moved within a narrow, calm range and showed little reaction to encouraging inflation data—until geopolitical developments once again shifted the landscape. Heightened tensions in the Middle East brought safe-haven demand back to the forefront of traders’ minds.
Following initial reports of regional unrest, gold quickly climbed from $3,324 to a weekly high of $3,377. Although the price saw a brief correction down to around $3,345, it resumed its upward momentum and opened Thursday’s trading session just one dollar below the symbolic $3,400 mark.
Rich Checkan, President and CEO of Asset Strategies International, commented on these recent geopolitical developments, stating: “The market’s direction is clear: it’s upward. With tensions rising following Israel’s attack on Iran, there’s no doubt gold will continue its climb next week.”
Darin Newsom, senior analyst at Barchart.com, also pointed to rising risks both domestically and globally: “Gold is on an upward path. Domestic unrest in the U.S., escalating conflict in the Middle East, broad selling of the U.S. dollar by other countries, and expectations that the Federal Reserve will hold rates steady—all support gold’s rise.”
Meanwhile, Daniel Pavilonis, senior broker at RJO Futures, analyzed the simultaneous reactions of gold and oil amid the recent Middle East tensions, looking for clues on their future direction. He explained: “Oil’s behavior can serve as an indicator for gold, as both are seen as inflation hedges and are sensitive to bond yields.”
Surprised that gold hasn’t yet reclaimed its April highs, Pavilonis emphasized: “If tensions escalate further, we could see additional gains. But if Iran moves toward negotiations or a truce, gold could remain elevated but range-bound, similar to the past two months. Breaking previous highs would require a stronger catalyst and a more significant worsening of the crisis.” He noted that while geopolitical tensions are currently the primary driver of gold’s strength, such rallies are typically short-lived.
Pavilonis added: “We saw a similar pattern last April—gold and oil spiked sharply but quickly corrected. Back then, trade war concerns with China persisted, inflation rates had fallen noticeably, and the initial supportive factors for gold gradually faded. Now, once again, a fresh geopolitical shock has emerged that may temporarily drive gold higher.”
After a week where market attention focused mainly on U.S. inflation data, investors’ focus in the coming days will shift to central bank policy decisions and potential signals regarding the future path of interest rates.
The trading week begins Monday with the release of the Empire State Manufacturing Index, offering an early view of industrial activity in New York. That same day, the Bank of Japan will announce its latest interest rate decision, potentially setting a new tone for Asian markets and the yen’s value.
On Tuesday, U.S. May retail sales data will be published—a key indicator of consumer strength. Signs of weakness could bolster market expectations for a rate cut.
Wednesday will be the pivotal day, as the Federal Reserve reveals its rate decision. While markets have fully priced in a pause in tightening, attention will focus on Jerome Powell’s remarks for any hints of rate cuts in the coming months. Also on Wednesday, May housing starts data and weekly jobless claims will be released.
With U.S. markets closed Thursday for Juneteenth, the spotlight will shift to monetary policy decisions from the Swiss National Bank and the Bank of England, both of which could impact currency market volatility. The week wraps up Friday with the Philadelphia Fed Manufacturing Index, a leading gauge closely watched by traders to assess the health of the manufacturing sector in the U.S. Northeast.
Central banks dominate calendar this week: Will Fed surprise?A pack of central bank decisions is set to drive market direction this week, with the Bank of Japan (Tuesday), Federal Reserve (Wednesday), Swiss National Bank (Thursday), and Bank of England (Thursday) all scheduled to announce their latest interest rate decisions.
The Federal Reserve will, of course, take center stage.
Despite President Trump’s continued call for a 100-basis point rate cut, Fed officials are widely expected to keep rates unchanged. However, softer-than-expected CPI and PPI data from last week may provide scope for a surprise.
The U.S. Dollar Index (DXY) is trading just above the key support zone at 98.00, a level not seen since early 2022. A decisive break below this area could open the door to further downside, potentially targeting the 96.00 region. However, a surprise from the Fed could trigger a rebound toward the 100.50–101.00 resistance band.
EUR/USD Bulls in Control... But the Trap Is Set at 1.1600? 🇺🇸 EUR/USD – Technical & Macro Outlook
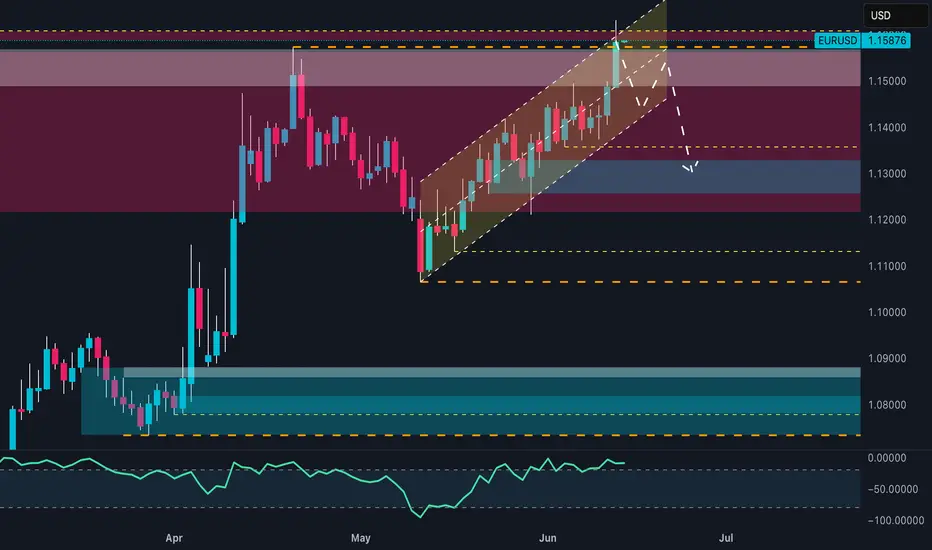
EUR/USD has posted an impressive rally over the past few weeks, driven by a combination of technical and macro factors. It is currently trading around 1.1586, right at the edge of a major supply zone where previous sharp rejections and reversals have taken place.
🔍 Technical Analysis
Price action remains within a well-defined ascending channel that began in mid-April, fueling the bullish move from the 1.07 lows.
The current daily candle is showing signs of exhaustion within the 1.1550–1.1600 resistance zone, with upper wicks and declining volume.
RSI is in a high-neutral zone but not yet overbought, leaving room for more upside — but also increasing the probability of a technical pullback.
🔁 Key Levels:
Primary resistance: 1.1600 (multi-touch supply area)
Support 1: 1.1460–1.1430 (previous resistance, now potential support)
Support 2: 1.1300–1.1270 (demand zone + channel base)
📉 COT Report – June 3, 2025
Non-Commercials (speculators) remain net-long with over 200,000 contracts, though both long (-1,540) and short (-4,830) positions saw reductions. This suggests a bullish structure with early signs of profit-taking.
Commercials are heavily net-short, with 575,000 short contracts versus 437,000 long — a structurally bearish stance from physical market participants.
Open interest increased significantly by +20,813, pointing to renewed speculative participation and potential volatility.
🧭 Retail Sentiment
Retail traders are heavily short (80%) with an average entry around 1.1253.
This contrarian behavior is typically supportive of continued upside pressure — especially if price holds above key supports.
📅 Seasonality – June
Historical averages over 10, 15, and 20 years show a slightly bullish tendency in June.
The 2- and 5-year patterns suggest more neutral to mildly bearish behavior.
This supports a consolidation or corrective pullback, without ruling out higher moves during the summer rally.
🎯 Trading Conclusion
Current bias: Moderately bullish, with rising pullback risks near 1.1600
Possible setup: Tactical short between 1.1580–1.1610 if confirmed by bearish price action
Target: 1.1430–1.1300
Bullish scenario remains valid unless we break below 1.1270
📌 Summary
The bullish trend is strong but technically extended. Speculative positions remain net-long but are starting to unwind. The retail crowd is still betting against the move, which favors bulls. However, structural resistance calls for caution — a pullback could be imminent.
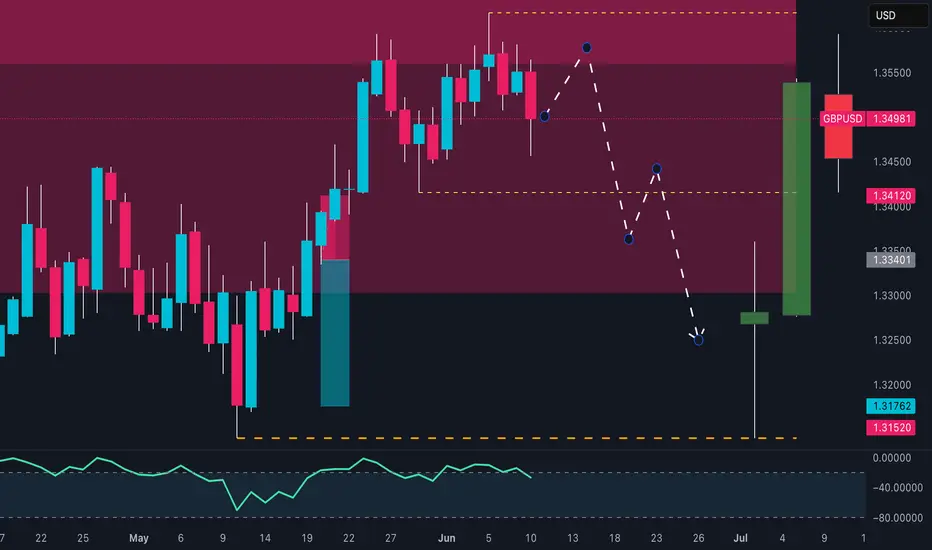
Massive GBP/USD Reversal Ahead? Head & Shoulders FormationGBP/USD is at a critical technical juncture following a sharp bullish impulse that pushed the pair above the 1.34 handle, printing a strong weekly bullish engulfing candle and breaking out of a multi-week consolidation zone. This move unfolded in a macro context where the U.S. Dollar Index (DXY) is showing clear signs of weakness, with Non-Commercial net long positions dropping drastically—from around 20,000 to less than 5,000 contracts. This shift points to a fading speculative appetite for the dollar, historically a leading indicator of upcoming corrective phases or broader declines in the DXY.
On the flip side, the Commitments of Traders (COT) report on the British Pound reveals that Non-Commercials (typically hedge funds and asset managers) remain net long on GBP, with a slight increase week-over-week. However, Commercials (generally institutions and hedgers) have aggressively built up a significant net short position—levels that in the past preceded major reversals on the pair. This divergence between speculators and institutional hedgers suggests short-term bullish potential, but with rising risk of exhaustion near current resistance levels.
Adding fuel to this outlook is the retail sentiment: approximately 63% of retail traders are currently short GBP/USD, with an average entry price around 1.3021. This kind of retail crowd positioning, typically inefficient from a historical perspective, adds contrarian support for further upside, as long as price holds above the 1.3340 structure.
From a seasonality perspective, June tends to be a mildly bullish-to-sideways month for GBP/USD, especially when looking at the 10- and 15-year seasonal averages. While the seasonal bias is not particularly strong, there’s also no statistical downward pressure this time of year, leaving room for technically-driven moves influenced by liquidity and sentiment rather than macro patterns alone.
On the technical front, the daily chart shows a steep rally capped by a large green candle on Monday, breaking cleanly through the 1.34 resistance zone. The price is now hovering inside a key supply area between 1.3499 and 1.3550—a historically reactive zone that has triggered major rejections in previous months. How price reacts here will likely shape the next major swing. A confirmed breakout and consolidation above 1.3550 would open the door for an extension toward 1.37–1.3750. Conversely, a sharp rejection followed by a break below 1.3412—and especially under 1.3340—would set the stage for a deeper correction toward 1.3170.
The RSI is currently showing early signs of momentum loss, although no strong bearish divergence has emerged yet. This implies that the pair could still fuel another push higher before running out of steam—possibly forming the right shoulder of a head & shoulders pattern if the rejection scenario plays out.
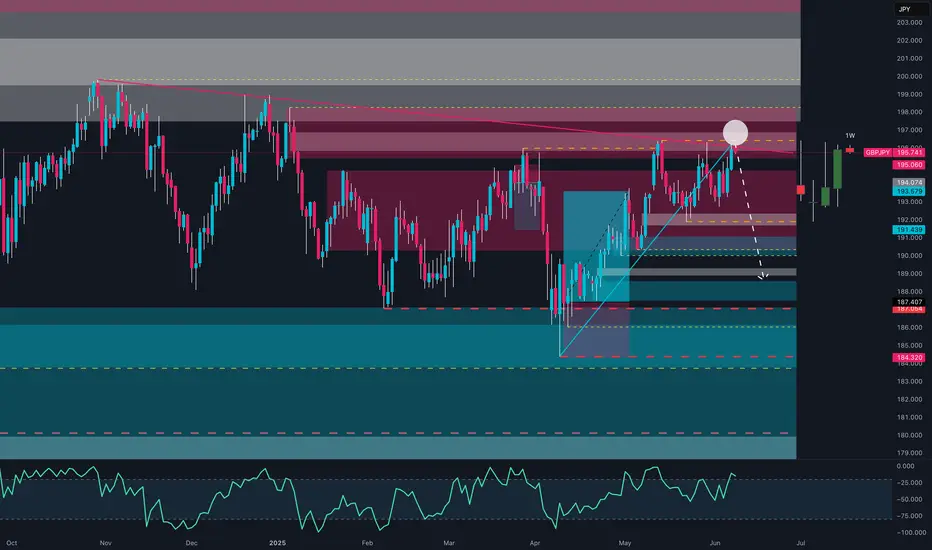
GBPJPY At the Top? Massive Liquidity Grab📈 1. Price Action & Key Technical Levels (Daily Chart)
Price reached a major supply zone between 196.0 and 197.0, showing clear rejection (weekly pin bar and a lower high structure relative to the previous peak).
The long-term descending trendline acted as resistance again.
A confirmed rising wedge pattern broke to the downside, with first target around 191.4, and extended target near 187.4 (key demand zone with historical confluence).
Weekly RSI shows a bearish divergence vs price highs – an additional signal of bullish exhaustion.
📊 2. COT Data (as of June 3, 2025)
GBP (British Pound)
Net long positions increased by +30,371 contracts (Commercial + Non-Commercial).
Non-Commercials: 103,672 long vs 68,457 short → net long +35,215 but the increase is relatively modest.
Commercials are increasing both long and short positions, but the net delta supports medium-term GBP resilience.
JPY (Japanese Yen)
Net short worsened by -13,566 contracts.
Non-Commercials are cutting longs and adding shorts → aggressive yen selling.
Commercials remain heavily short (275,659 vs 100,151 long).
➡️ COT Conclusion: GBP remains structurally strong, but the JPY is now extremely oversold, increasing the likelihood of a technical correction in favor of JPY (GBPJPY pullback).
📉 3. Retail Sentiment
72% of retail traders are short GBPJPY, with an average entry at 191.2.
Current price is above 195.8 → a liquidity sweep above retail shorts may have already occurred.
The order book shows a heavy sell cluster between 195.0–195.9 → potential zone of manipulation/liquidation.
➡️ Contrarian view: After sweeping liquidity above retail highs, we may now see downside pressure to clean out breakout longs.
📅 4. Seasonality
June tends to be neutral to bearish:
5-year average: +0.45% (weak gain)
10- and 15-year averages: -1.24% and -1.30%
Historically, the first 10 days of June often mark a local top, followed by a decline – consistent with the current price structure.
🧠 5. Macro-Technical Confluence
The broader setup points to a distribution phase between 195.5–196.5, with high probability of a technical pullback toward 193.5–191.4 in the short-to-medium term.
The yen's oversold conditions may ease temporarily, supporting a corrective GBPJPY retracement.
Break below 193.5 would confirm the move toward 191.4 and eventually 187.4 – an area of institutional interest.
🔍 Trade Setup Summary (Bias: Bearish)
Technical context: Short setup confirmed by structure break, divergence, and supply rejection.
Macro/sentiment context: Supports a corrective pullback on the pair.
Strategy: Look for intraday weakness below 195.0–194.5 → targeting 193.5, then 191.4.
Invalidation: Daily/weekly close above 197.0.
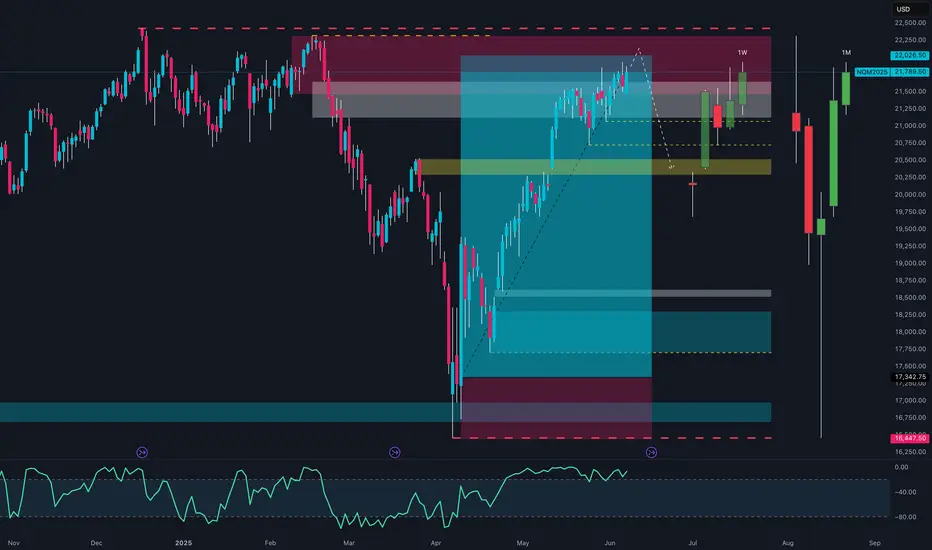
NQ100 → Entering the Danger Zone?📈 1. Technical Context (Price Action & Structure)
The daily chart shows a strong bullish continuation from the 17,350 area, with price now extending toward the 22,000 USD zone.
We are currently within a weekly/monthly supply, with:
Mild RSI divergence in overbought conditions
Temporary rejection at 22,050–22,200
A potential liquidity sweep above highs before distribution or pullback
The monthly structure shows a strong swing low that may serve as anchor for a future reversal
🧠 2. COT Report – Commitment of Traders (as of June 3)
Commercials (Smart Money):
+4,041 long | +3,320 short → Net +1,455 → hedging phase, not trend expansion
Non-Commercials (Speculators):
–2,237 long | +125 short → net exposure reduction
Open Interest increasing → new positions building, but no extreme imbalance
📌 Conclusion: Tactical neutrality, slight bullish lean from commercials.
📆 3. Seasonality
June has been historically bullish, especially in the past 2 years (+700 pts avg)
10Y average still leans bullish
⚠️ September is a clear seasonal reversal month across all timeframes
📌 Conclusion: Seasonal tailwind through end of June; cyclic reversal risk into Q3.
📰 4. Macro Calendar
High-impact USD week:
CPI – Wed, June 11
PPI – Thu, June 12
These will be critical to:
Validate the disinflation narrative
Set expectations for a Fed cut by Sep/Nov
📌 Conclusion: Expect explosive mid-week volatility — watch for liquidity spikes above 22,000 if CPI surprises.
⚙️ Operational Outlook
✅ Primary scenario (bullish continuation):
🎯 Target: 22,260 → fib extension + structure
❌ Invalid below 21,350
🔄 Alternative scenario (mean reversion):
🔻 Short from 22,050–22,200
🎯 Target: 20,950 → liquidity + FVG zone
🔁 Trigger: weekly engulf or hotter-than-expected CPI
Volatility Incoming - But Price Will Say WhenKey levels on SPX and NDX
5905 big gamma level and hedging level for June 30 monthly and quarter expiration
DXY watching for potential bear trap and range trade
Gold, Silver, Bitcoin and others all discussed
Thanks for watching!!!

Cocoa Bounce From Demand – Can This Lead to a New 2025 High?On June 11th, price reacted sharply to a key demand block around the 8,880–9,000 zone, which aligns with:
Golden Pocket Fib (0.705–0.78) between 8,420 and 9,006
The midpoint of a previous consolidation range
A liquidity sweep followed by a strong bullish rejection
The RSI is showing a bullish divergence (lower lows on price vs rising RSI), which supports a possible technical rebound.
🟣 Immediate target: 10,400–10,600 (supply zone)
🔴 The bullish bias would be invalidated on a close below 8,850
📈 Commitments of Traders (COT) – as of June 3, 2025
Non-Commercials (speculators): still net long, but reduced their long exposure by -2,006 contracts, and trimmed shorts slightly as well
Commercials: remain heavily net short with over 61,000 contracts (61.4% of OI), indicating ongoing hedging by producers
Open Interest dropped by -1,257 → a sign of general position liquidation
➡️ The reduction in speculative longs likely reflects profit-taking after the May rally, but overall net positioning remains bullish on a medium-term view.
📅 Seasonality – June
On the 20, 15 and 10-year averages, June typically shows a moderately bullish rebound, often following weakness in May.
On the 5 and 2-year views, however, performance is more neutral to slightly negative.
Historically, June acts as a consolidation or pre-rally month, often preceding a stronger uptrend in July–August.
🧠 Operational Outlook
Bias: Moderately bullish in the short term, with potential recovery toward 10,400. Structure still shows signs of broader distribution, so caution remains in the medium term.
🎯 Trade idea:
Aggressive long initiated on the bounce from demand
First target: 10,400
Breakout extension: 11,200
Invalidation on daily close below 8,850
