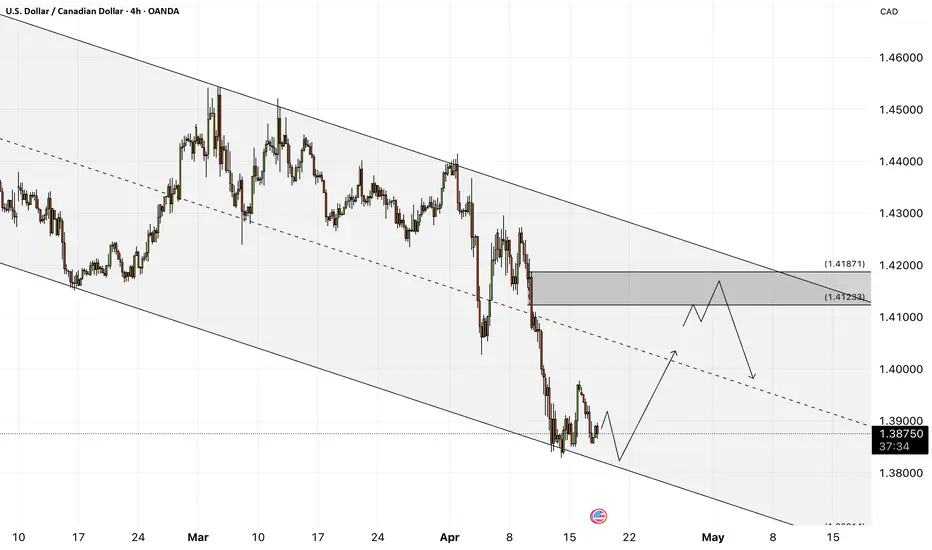
USDCAD - Bank of Canada keeps interest rates unchanged!The USDCAD pair is below the EMA200 and EMA50 on the 4-hour timeframe and is in its descending channel. The continuation of the downward movement of this pair will provide us with a buying position with a good risk-reward ratio. If the correction continues, we can sell within the specified supply zone.
On Wednesday, oil prices climbed by approximately 1%, driven by renewed optimism in the markets regarding potential trade talks between the United States and China. However, lingering concerns about the trade war’s negative effects on global energy demand limited further gains in oil prices.Initially, oil prices declined, but market sentiment shifted after Bloomberg reported—citing an anonymous source—that China was seeking greater respect from the Trump administration before agreeing to new negotiations. The same source also stated that China had requested a new outreach from the U.S. to initiate the discussions.
Giovanni Staunovo, an analyst at UBS, commented that easing trade tensions between the two nations could help reduce constraints on economic growth and energy demand, potentially exerting downward pressure on oil prices.
Meanwhile, the International Energy Agency (IEA) reported that global oil demand is expected to rise by just 730,000 barrels per day this year—well below both its previous projections and those of OPEC.
In a new report, the Fitch rating agency warned that the intensifying global trade war has significantly weakened the outlook for economic growth. According to the report, China’s economic growth will fall below 4% in both this year and the next, while the eurozone is projected to grow by less than 1%.
Fitch further estimates that global economic growth in 2025 will fall below 2%, marking the weakest performance since 2009 (excluding the COVID-19 pandemic period).
Despite the sharp decline in the U.S. growth outlook, Fitch expects the Federal Reserve to delay any interest rate cuts until Q4 of 2025. Conversely, deeper rate cuts are anticipated for the European Central Bank and emerging market economies.
In the energy sector, Fitch lowered its short-term oil price forecast due to risks stemming from weaker demand and trade disruptions but left its natural gas price forecast unchanged.
Additionally, the Bank of Canada maintained its policy rate at 2.75%. Highlights from the Bank’s monetary statement include:
• Tariffs and logistical challenges are driving price increases.
• New U.S. trade policies have heightened uncertainty, slowed growth, and sparked inflation fears.
• The Bank supports economic growth with inflation control but urges caution due to elevated domestic risks.
• Both upside risks (higher costs) and downside risks (weaker growth) to inflation are under close watch.
• Beginning in April, the removal of carbon taxes and cheaper oil are expected to temporarily lower inflation for about a year.
• The recent rise in inflation reflects renewed commodity price growth and the end of temporary sales tax relief.
• Due to high uncertainty related to U.S. trade tariffs, the Bank is refraining from issuing an economic forecast.
• The output gap in Q1 2025 was estimated between 0% and -1%.
• Annualized GDP growth for the same quarter was 1.8%, down from the January forecast of 2%.
• Two scenarios are under consideration: one involving tariff reduction via agreement, and another involving a prolonged global trade war.
• In the first scenario, Canadian and global growth temporarily decline, inflation drops to 1.5%, and later returns to the 2% target.
• In the second, the global economy slows sharply, inflation surges, and Canada enters a severe recession. Inflation surpasses 3% by mid-2026 before returning to the 2% target.
• In both scenarios, the neutral interest rate is estimated to be around the midpoint of the 2.25%–3.25% range.
Fed
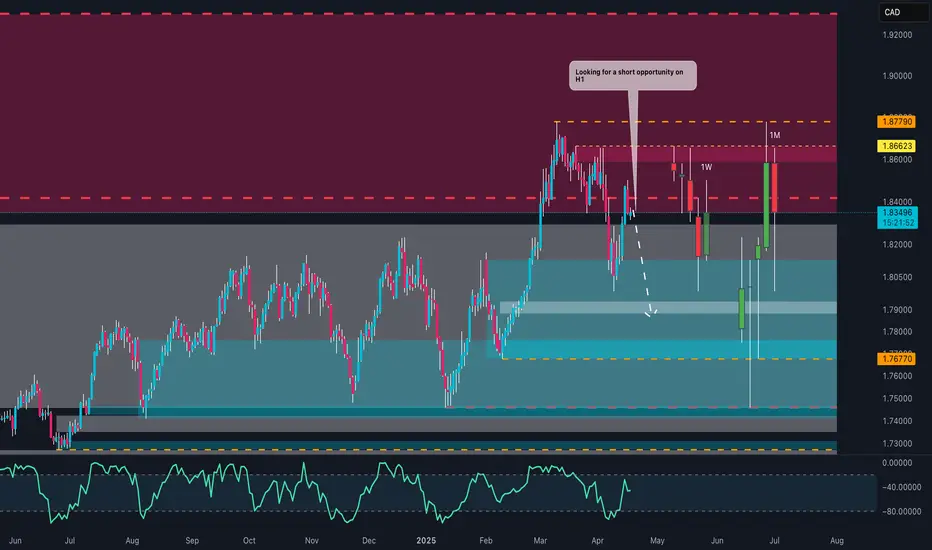
GBP/CAD at a crossroads: this key level could trigger the drop!My visual analysis highlights a strong multi-timeframe resistance zone (weekly and monthly) between 1.8662 and 1.8779, where price has reacted sharply multiple times. This area, marked in dark burgundy, signals a significant supply zone.
Currently, price is trading back in the 1.8350–1.8400 region. Based on my note on the chart ("Looking for a short opportunity on H1"), I’m anticipating a potential short entry from lower timeframes—likely triggered by a structural break or bearish candlestick confirmation.
🔻 Bearish Scenario:
If I get a short confirmation around the current area, I’ll be targeting the 1.7900–1.7677 demand zone (highlighted in deep blue), which has previously shown strong bullish reactions.
The RSI is also showing signs of potential divergence or overextension, adding weight to the bearish thesis.
🟢 Alternative Scenario:
If price decisively breaks above the 1.8780 monthly resistance, we could see an extended bullish move towards levels not currently visible on this chart.
📌 Operational Note:
I’ll be looking for entry confirmations on lower timeframes (like H1), with valid reversal patterns or price action triggers, and will manage the position dynamically depending on how price behaves around the 1.79 zone.
EUR/USD at Key Decision Zone – Breakout or Smart Money Trap?🟢 Current Context
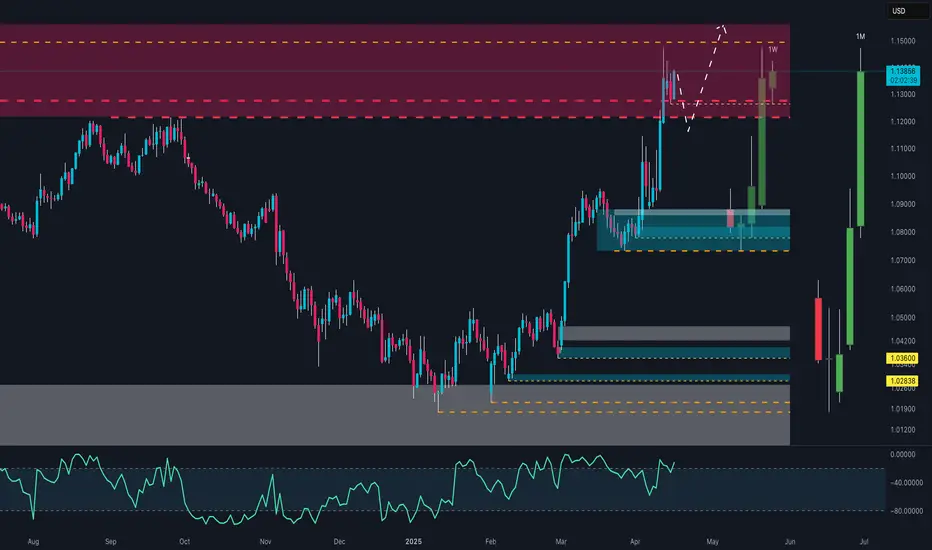
Price: 1.13820 USD
Trend: Strong bullish structure, with impulsive moves especially in April.
Main timeframe: Appears to be daily or weekly, with multi-timeframe zones (1W, 1M marked).
🧱 Key Zones
🔴 Supply Zone (1.13000–1.15000)
Well-defined area of historic selling pressure. Price reacted with a temporary drop but bounced right back into it.
🟦 Demand Zone (1.08500–1.10000)
Major order block where the current rally was initiated. Price used this as a base to launch higher.
⚫ Lower Supports
1.03600: Weekly support
1.02838: Monthly support
Broad accumulation zone (grey box) from which this trend began.
📈 Price Structure
Strong breakout above 1.10–1.11 resistance.
Currently pulling back inside the supply zone – the dashed arrows hint at potential liquidity sweeps before a continuation to 1.15+.
🔍 Momentum Indicator (likely RSI/CCI)
Currently elevated, but not yet in extreme overbought. No clear divergence. Momentum favors bulls.
📊 Scenarios
✅ Bullish:
Clean break above 1.14500–1.15000 opens the door to 1.1600 and 1.1800. Wait for a structural retest for safer long entries.
⚠️ Bearish (corrective):
Strong rejection from the supply zone → potential pullback to 1.10–1.0850 (blue zone).
Only below 1.0850 would a deeper bearish structure toward 1.03600 be confirmed.
🧠 Strategic Note
This is a zone of clear smart money activity: liquidity grabs on both ends.
Watch how this weekly candle closes – we’re either validating above 1.13 or setting up a trap for late longs.
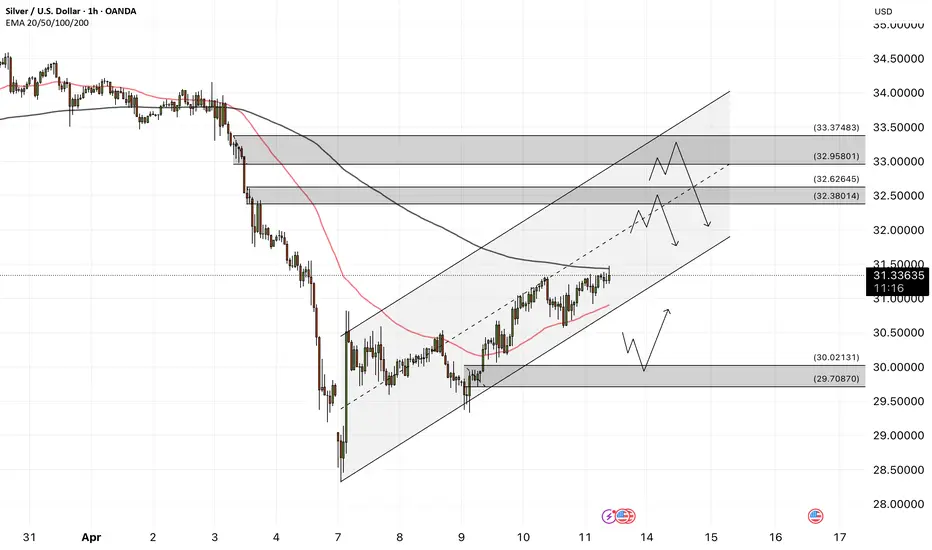
SILVER at a CROSSROADS: Bounce or CRASH to $28?🔹 General Context
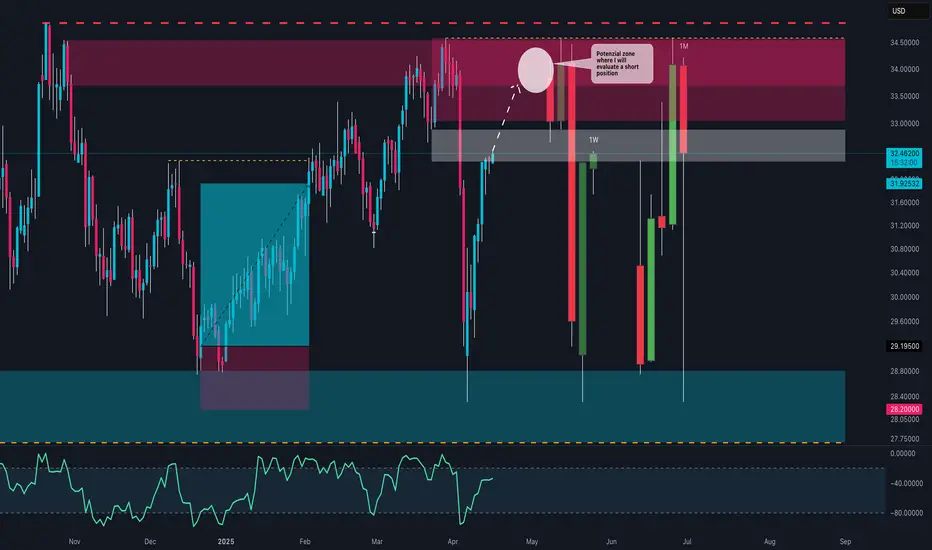
Silver has shown a strong bullish reaction from the lows around $28, later reaching a key monthly supply area between $34 and $35. However, this zone has once again been firmly rejected, leaving room for a potential deep retracement.
🟥 Key Zones
🔴 Monthly Supply Zone (34.00 - 35.00 USD): Strong resistance already tested multiple times. Candlesticks show strong rejections and long upper wicks.
🟥 Weekly Supply Zone (33.00 - 34.00 USD): Breaker block or mitigation area that triggered a strong bearish move.
⬛ Current Weekly Support Zone (32.00 - 31.90 USD): Price is currently testing this area. A new impulse could arise here — or we may witness a breakdown.
🟦 Monthly Demand Zone (28.20 - 29.20 USD): The last area defended by buyers in the mid-term. A realistic target in case of breakdown.
📊 Price Structure
The short- to medium-term trend remains bearish, with lower highs and strong rejection candles.
Current price action shows indecision, with lower wicks on recent weekly candles but smaller bullish bodies — a sign of potential accumulation... or just a pullback?
📉 RSI (Relative Strength Index)
RSI is in the neutral-high zone, not yet overbought, but in a downward phase → more room for downside if buyers don’t step in soon.
No clear divergences visible, but watch for signals on the daily timeframe.
🧭 Possible Scenarios
✅ BULLISH Scenario:
Condition: Support holds between 32.50 and 31.90 USD with a clear reversal candle.
Target: Move back toward the supply zone at 33.80 – 34.90 USD.
Confirmation: Break above 33.00 USD with increasing volume.
❌ BEARISH Scenario:
Condition: Weekly close below 31.90 USD → sign of weakness.
Target: Zone between 29.20 – 28.20 USD, a potential new institutional buy area.
Confirmation: Strong bearish break with follow-through and lack of buying reaction.
🧠 Operational Conclusion
Silver is at a critical decision point: bearish pressure from the monthly zones is evident, but as long as the 31.90/32.00 zone holds, buyers may still defend. A clean breakdown would open the door for a drop below $30.
10YR Bond Yields: Panic on LTF, Calm on HTF📉 10YR Bond Yields: Panic on LTF, Calm on HTF
Yes, the recent spike in the 10-Year Yield is causing some short-term panic. But if you zoom out to the monthly timeframe, the bigger picture looks far more constructive.
🔍 Here’s what the chart says:
The MACD and RSI on the monthly are both pointing down.
Yields touched 4.5%, historically a key recession threshold.
We’re now seeing a MACD bearish crossover and a clear bearish divergence—classic signs of a trend reversal.
💡 What does this mean?
If no new fear or shock hits the market, yields are likely headed down, potentially toward the 2% range in the coming months. This would naturally ease pressure on equities and crypto.
📉 Conclusion:
This recent spike in yields seems to be transitional, not structural.
The chart suggests that the top is in, and the market is correcting from an overextended zone.
The Fed might not even need to intervene—the bond market is likely to correct on its own.
Stay calm. Stay rational. Always zoom out.
#10YearYield #BondMarket #MacroAnalysis #InterestRates #RecessionWatch #MarketPanic #MACD #TechnicalAnalysis #FederalReserve #CryptoMarkets #StockMarketInsights #StayCalmZoomOut #DYOR

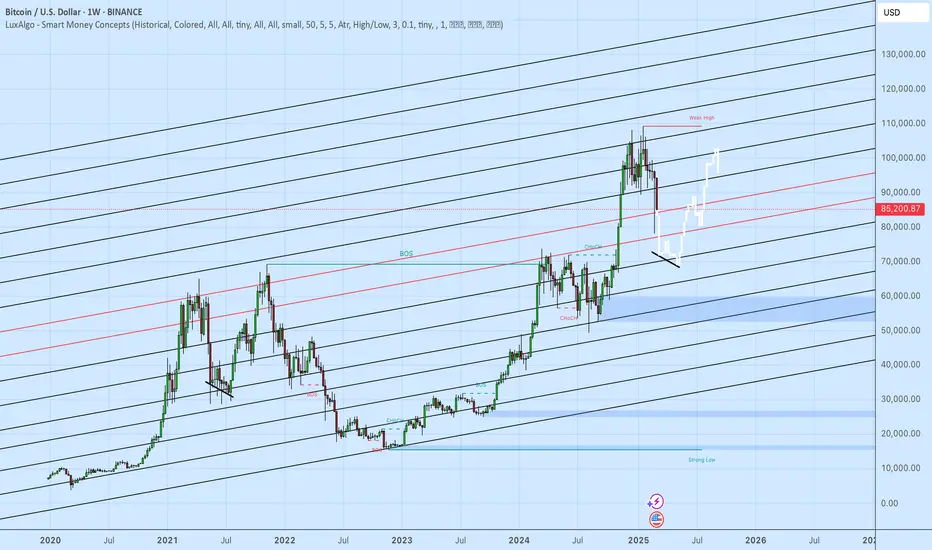
BITCOIN 2025 - A MODERATE SCENARIOBitcoin’s price trajectory hinges on critical technical levels. Should Bitcoin fall below the key support zones—referred to here as the 'red lines' and t he bold black line —it risks entering a bear market, potentially signaling the end of the current bull cycle. These levels are pivotal for sustaining the parabolic bull market’s final leg. Following an initial decline from current levels, Bitcoin is projected to drop to approximately $70K, where it may consolidate for a couple of months. For the best-case scenario to unfold, Bitcoin must hold above the critical $70-77K threshold and execute a sharp V-shaped recovery. From there, a robust rally could propel it beyond $100K around August, culminating in the cycle’s peak in September at its highest point. While this outcome appears unlikely in the short term, it remains the most favorable projection, contingent on Bitcoin maintaining strength above the $70K line. Failure to do so could prematurely terminate the bull cycle.
BIG BIG weekI think 7 FED speakers,
A lot of tension in the markets, tops mean polarisation, considering reflexivity theory extreme volatility will ensue.
A lot of people might think the -0.786 ATH we got before the holidays is the top. I think they are mistaken as seen in the analysis below.
There is still legroom for higher, this is a big bet on my part.
I have a few contracts on the mag7 (GOOGL, TSLA and META) focusing on GOOGL since they seem to be in the same headwind as S&P
Let's see how this plays out

PPI Misses Across the Board — Rate Cut Setup StrengthensFresh inflation data just gave the market a clear signal: the Fed has room to cut sooner than expected.
PPI Snapshot (Actual vs. Forecast):
PPI MoM: -0.4% vs. 0.2% ✅
Core PPI MoM: -0.1% vs. 0.3% ✅
PPI YoY: 2.7% vs. 3.3% ✅
Core PPI YoY: 3.3% vs. 3.6% ✅
PPI ex Food/Energy/Trade YoY: 3.4% vs. 3.5% ✅
🧠 Prices aren’t just slowing — they’re contracting. Combined with soft CPI, this disinflation confirms a Fed-friendly trend and clears the way for policy easing.
🧨 The Twist: 10-Year Yield Spiked
Despite stocks falling, the 10-year yield moved up — a rare divergence in risk-off environments.
This likely reflects three key forces:
Hedge funds facing margin calls, forced to liquidate bond positions.
Political actors unloading treasuries amid U.S. fiscal tensions.
A potential counter-strike to Trump’s efforts to push yields down via market stress.
💡 Ironically, this may help the Fed. Rising yields tighten financial conditions on their own, giving Powell more space to act without risking an inflation resurgence.
🧭 Sector Playbook (Macro-Aligned)
Tech and Growth — Overweight. These sectors thrive on falling rates and an easing narrative.
Bonds — Accumulate. Yield spike could offer a prime entry point before a Fed pivot.
Crypto — Risk-On. Disinflation + volatility = breakout fuel.
Energy and Defense — Hold. May underperform in a growth-led rally (Besides nuclear).
Defensives — Underweight. Safety trade could unwind as liquidity improves.
Small Caps — Speculative. Could bounce hard if liquidity rotation begins.
⚠️ Final Thought
Markets are digesting short-term chaos, but underneath it all, the macro signals are aligning. Even without a "golden tweet," the inflation data is giving Powell the green light.
If the Fed wants to cut — the data is here. The only thing missing is confirmation from Powell’s tone.
#Disinflation #FedCut #YieldSpike #MacroUpdate #CPI #BondMarket #TradingViewIdeas #MarketOutlook #SectorRotation

End of the US Dollar ****** end of INFLATED USD
Deflation is coming.
Food for thought.
Because THE CYCLES EXIST and THEY RHYME.
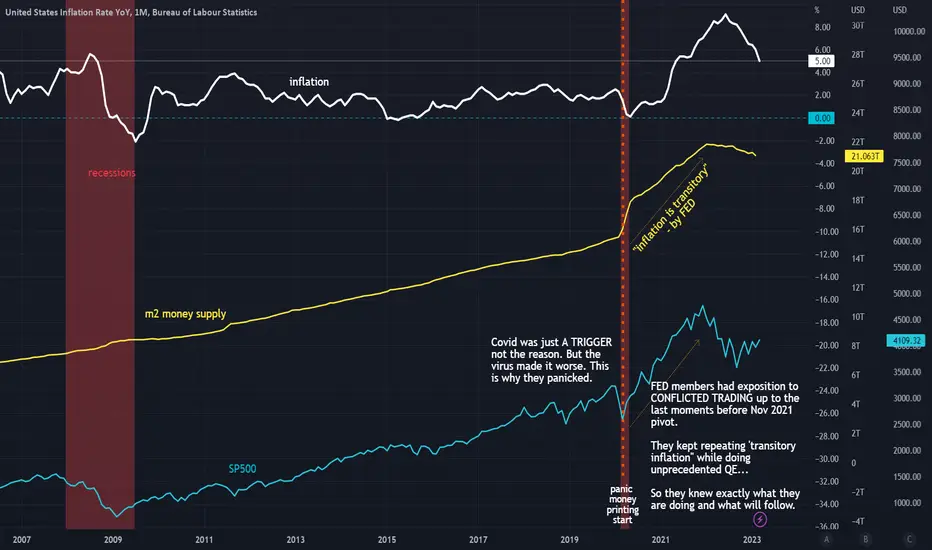
'Inflation is transitory' by FEDFED did that. And it was not elaborate lie. They made money on it. What is next ?
XAGUSD: Silver, and the latest on tariffs!Silver is trading in its ascending channel on the 4-hour timeframe, between the EMA200 and EMA50. If silver reaches the supply zone, it can be sold. A downward correction will also provide us with a buying opportunity with a good risk-reward ratio.
U.S. President Donald Trump has implemented tariff policies with the aim of revitalizing domestic manufacturing. During the 1980s, a significant portion of American manufacturing jobs either moved overseas or were replaced by automation technologies.
The shift in production was largely driven by wage disparities across countries. Nevertheless, the United States remains a leading global manufacturer, although it now focuses on producing higher-value goods. Experts argue that imposing import taxes is unlikely to achieve one of its stated goals: restoring manufacturing as a central pillar of the U.S. economy.
According to many economists, Trump’s campaign to impose tariffs on a wide range of goods from trade partners is unlikely to bring back the manufacturing jobs that once formed the backbone of the blue-collar middle class.
In the mid-20th century, the U.S. was the manufacturing capital of the world, employing more workers in this sector than any other. At its peak in the 1950s, one-fourth of the civilian workforce was engaged in manufacturing.
However, starting in the 1980s, free trade agreements facilitated the relocation of many industries abroad, while automation reduced the need for human labor in the remaining factories. Today, only about 7% of the workforce is employed in manufacturing—a figure that has remained largely unchanged since the Great Recession.
The goal of tariffs is to incentivize businesses to relocate their factories to the U.S. to avoid paying import taxes—costs that are typically passed on to consumers.
While some economists believe this approach could work for select industries, it is unlikely to recreate an era in which most household items carried the “Made in America” label.
According to a report by The Wall Street Journal, while it’s unlikely that the Chinese President will initiate a call himself, the odds of Xi Jinping responding to a call from Trump are reportedly high.
This comes amid heightened tensions between the two nations due to new tariffs and escalating trade disputes, where both sides appear to be locked in a power struggle—neither willing to be the first to back down.
Although this news may seem minor on the surface, it carries a deeper signal for the markets: despite ongoing tensions, the possibility for communication and negotiation remains. This prospect, especially in a highly volatile environment, could be seen as a positive sign by investors.
Earlier in the week, Trump had stated he was waiting for a call from Xi. Now, the Wall Street Journal suggests that if Trump initiates the conversation, a response from China is likely. While this may be an unofficial message from within the Chinese leadership, it still indicates that the door to dialogue and de-escalation is not entirely closed.
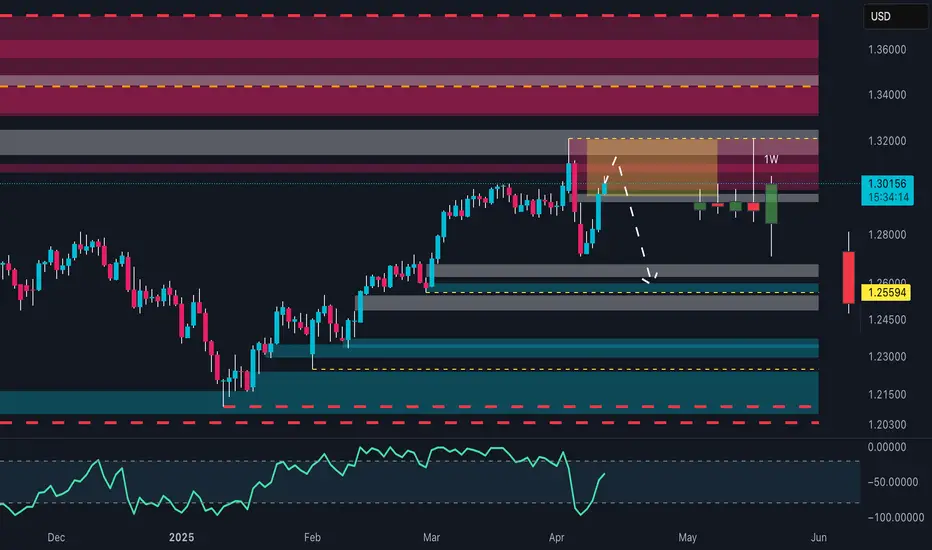
GBP/USD at a Crossroads: Imminent Breakout or Bull Trap?The weekly chart of GBP/USD shows a strong recovery following the late-April correction, which brought the price down to a key demand zone between 1.2550 and 1.2600. The bounce was sharp and decisive, but the pair is now facing resistance between 1.3000 and 1.3150 — a previously sold area marked by a visible supply block in red.
The current weekly candle reflects a bullish reaction, but the overall structure suggests a potential exhaustion zone for upward momentum. Price action reveals a series of lower highs in the short term, and while the RSI is bouncing, it remains far from overbought, hinting that this move may be just a technical rebound.
From a trading perspective, a confirmed weakness around the 1.3000–1.3150 zone could offer short opportunities with an initial target near 1.2700 and, if extended, down to 1.2550 — a key dynamic support area. On the flip side, a clean breakout above 1.3150 with strong volume and a weekly close would open the door for a new bullish leg toward 1.3300–1.3400.
Conclusion: GBP/USD is currently at a critical juncture. The next directional move will depend on how price reacts to this resistance zone: a confirmed rejection could trigger renewed selling pressure, while a confirmed breakout may reignite the bullish trend.
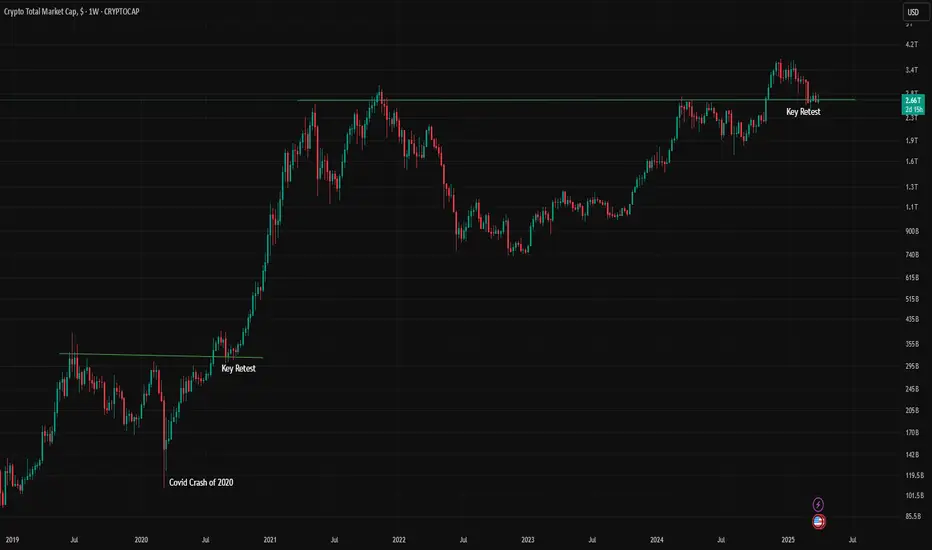
HOW IS CRYPTO SHAPING UP?Trump and tariffs have a firm grip on the economic world as of late, so where does that leave the crypto market?
TOTAL has a clear structure since the beginning of the bull market in 2023, in the last 3 days TOTAL has wicked into the bullish trendline support but sits within a bearish trend channel. This level also coincides with the bullish orderblock that started the leg up post US election so a very strong level of support here.
Do I think this is the end and the bottom is in? The chart would make a very good case for it however I believe that the Geo-politics outweigh Technical Analysis currently, at least in the short term. Everyone is watching for the latest news release/Trump announcement and all the time that is going on the market is very reactionary with less passive orders and more reactionary news based market orders. That taken into account in the short term this is a game of musical chairs with massive volatility swings and liquidations left right and center, a traders dream.
I'm very interested in how the FED will react to this, once we start getting emergency or early interest rate cuts that for me is when BTC will take the next step up and will flip to an investor/buy and hold environment, whether that's from here, lower or higher I'm not sure but but BTC needs a risk-on environment to thrive and Trump is doing his best to force J Powells hand.

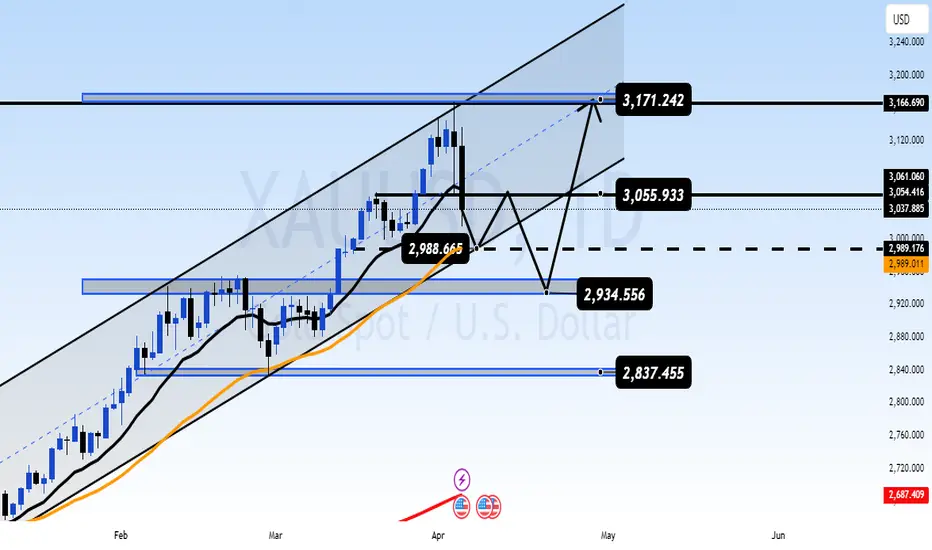
GOLD MARKET UPDATE – Trend Breakouts and Market Structure Shift🟡 GOLD MARKET UPDATE – Trend Breakouts and Market Structure Shift
Gold has broken through both the parallel ascending channel and a narrow triangle pattern at the edges, resulting in a strong buying momentum (FOMO BUY). This move can be attributed to a mild positive shift in the US stock market yesterday, along with some upward momentum in the Asian and European markets today.
📉 Current Situation: It’s still unclear whether this movement is tied to positive news about tariffs, but an important level to watch is 3075 – 3077. If this level is breached, it may be time to reassess the outlook and consider shifting towards a BUY.
💡 Currently, there’s strong buying activity during the European session. It’s recommended to avoid jumping into BUY positions at these levels and to refrain from selling too aggressively.
📌 Scenario for Today: Look for potential BUY opportunities at the important levels 3030 – 3018 during the European session, and stay tuned for updates regarding FOMC tonight.
🔮 Be Cautious: The FOMC meeting will take place later today, which could lead to significant market movements. Be prepared for potential volatility and liquidity sweeps in less liquid areas.
🧭 Key Technical Levels:
🔺 Resistance: 3075 – 3090 – 3110
🔻 Support: 3030 – 3018 – 3000 – 2988 – 2974
🎯 Trade Setup:
🔴 SELL ZONE: 3074 – 3076
SL: 3080
TP: 3070 – 3066 – 3062 – 3058 – 3054 – 3050 – 3040
🟢 BUY ZONE: 2976 – 2974
SL: 2970
TP: 2980 – 2984 – 2988 – 2992 – 2996 – 3000
📌 Reminder: The market is currently very sensitive, so stick to risk management rules, ensure full TP/SL implementation, and avoid making hasty decisions.
Be cautious and watch the market movements closely!
— AD | Money Market Flow

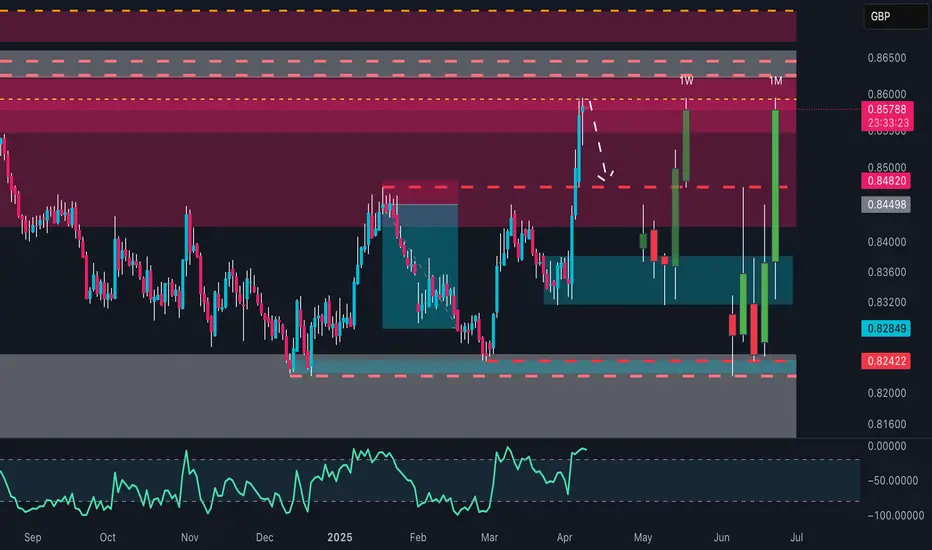
EUR/GBP: Monthly Resistance Test, Rising Risk of PullbackEUR/GBP has recently shown a strong bullish acceleration, breaking decisively above the consolidation zone between 0.8285 and 0.8480, and reaching the monthly resistance area around 0.8580–0.8600. This zone, highlighted on the chart with a marked red and grey band, represents a historically significant selling area—already tested earlier this month and revisited again today. The strong upward expansion has been accompanied by an RSI nearing extreme levels, indicating a possible and imminent loss of bullish momentum.
From a technical perspective, the current setup reveals an active supply zone that could trigger a pullback, especially if the price fails to close decisively above the weekly and monthly highs. Potential profit-taking may drive the pair back toward the intermediate balance zone around 0.8450–0.8480, which would serve as the first dynamic support level. Only a clear and confirmed breakout above 0.8600 would open the door for further bullish continuation, with targets toward 0.8650 and beyond.
Strategically, caution is advised at this stage: traders already long may consider scaling out near resistance, while those eyeing short entries could find opportunities on reversal signals or confirmation of rejection from the current zone.
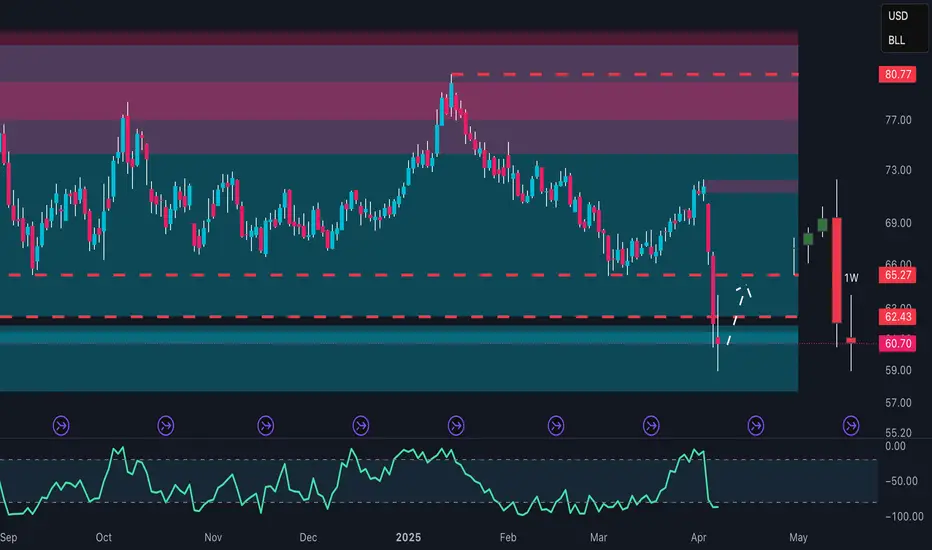
Crude Oil: Volatility and Key Levels in FocusThe Crude Oil (CL1!) chart shows a recent phase of high volatility, with a sharp decline followed by a recovery attempt. After reaching the recent high around 80.77, the price underwent a significant correction, returning to the key support zone between 60.97 and 62.43. This price range represents an important accumulation level, previously tested multiple times in recent months and defended by buyers.
From a technical perspective, the area between 65.27 and 69.00 represents a dynamic resistance zone, whose breakout could pave the way for a recovery towards the critical 73.00 area. However, the recent bearish impulse has pressured lower levels, and a weekly close below 60.97 could indicate a structural trend change, with potential bearish targets around 57.00.
The RSI is currently in an oversold zone, suggesting a potential consolidation phase or a technical rebound attempt. However, selling pressure remains high, and sentiment is negative, partly driven by global economic uncertainties and concerns about oil demand.
From an operational perspective, a move back above 65.27 could indicate a recovery phase, with targets at 69.00 and subsequently 73.00. Conversely, a break below 60.97 would open negative scenarios with a possible extension towards the lower support at 57.00. Investors remain focused on macroeconomic data and OPEC+ decisions, as potential production cuts could trigger a new rally, while an unfavorable macro environment could increase selling pressure.
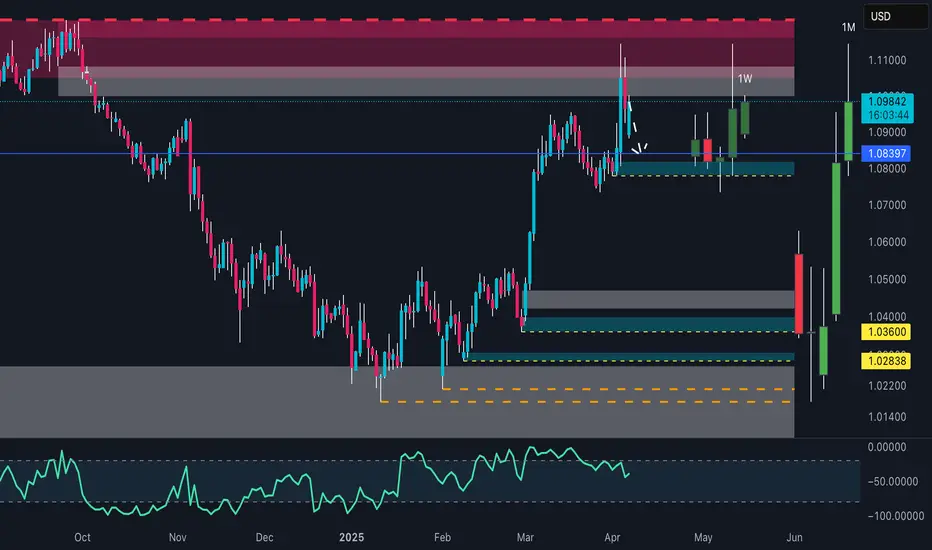
EUR/USD: What to Expect - Trump vs FED!The EUR/USD has recently shown a recovery phase after reaching the late-September high near 1.1150 last Thursday, initially supported by the weakness of the US dollar following fears of stagflation in the United States, fueled by tariff announcements from President Trump. However, the scenario changed rapidly after the release of Nonfarm Payrolls (NFP) data and Jerome Powell’s speech last Friday. Employment data showed NFP growth in line with expectations, but also an increase in the unemployment rate, signaling a less solid labor market than anticipated. During his speech, Powell expressed concerns about the resilience of the US economy, highlighting the risk of an economic slowdown while at the same time reiterating the focus on inflation, maintaining a cautious approach regarding further monetary easing policies.
From a technical perspective, the chart shows that the area around 1.0980-1.1000 represents a crucial zone to assess the sustainability of the bullish trend. A daily close above this level could trigger a new upward push towards the highs of 1.1100 and subsequently 1.1150, especially if supported by further signs of dollar weakness or positive European economic data. If the EUR/USD fails to hold above 1.1000, we could see a pullback towards the support at 1.0950 and subsequently 1.0900. The critical support area on the chart is identified between 1.0360 and 1.0280, and a break below these levels would indicate a significant change in market sentiment.
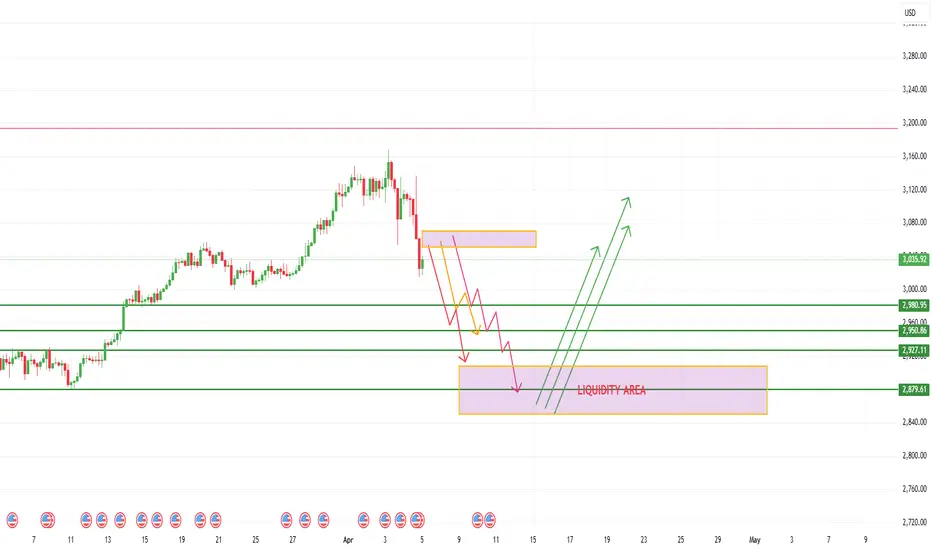
GOLD BREAKS SHARPLY — BUT THE MOVE WAS WRITTEN IN THE STRUCTURE🟡 GOLD BREAKS SHARPLY — BUT THE MOVE WAS WRITTEN IN THE STRUCTURE
A steep drop in gold just rattled the markets — but if you’ve been following the macro and technical setup closely, this was not only expected, but anticipated.
From the first week of April, we’ve been tracking signals of potential exhaustion in XAUUSD:
🕯️ Candlestick wicks on higher timeframes
📈 Overextended structure
🧠 Macro divergence
Now, all signs have converged — and we’re finally seeing the correction play out.
🔍 Why This Isn’t Just About Gold
What we’re seeing is a broader shift in global market sentiment:
U.S., European, and Asian equities are all under pressure
Crypto has stagnated with little to no fresh capital inflow
Gold — after months of aggressive buying — is now facing wave after wave of profit-taking
This is classic risk-off behaviour.
Investors are choosing cash, sitting tight, and waiting for clarity — not only in the charts but in the headlines too.
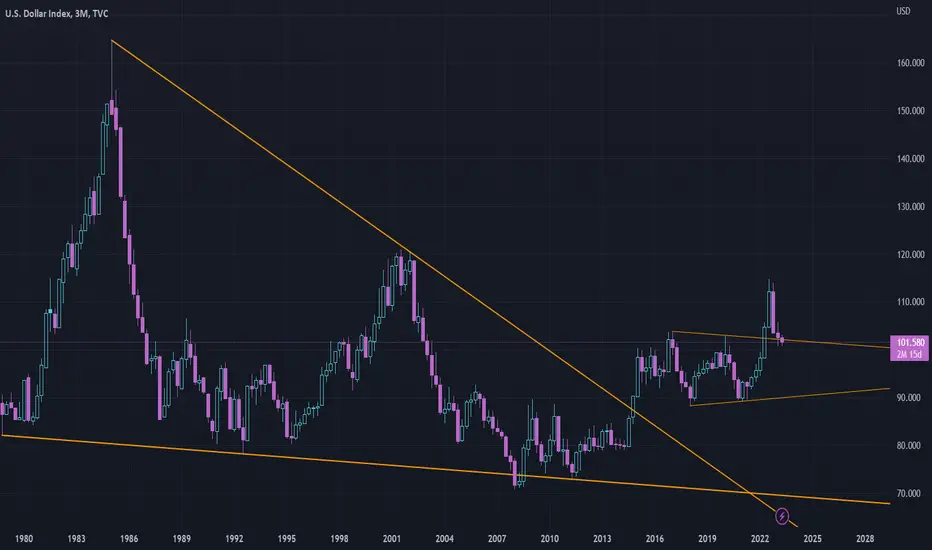
📉 DXY Building a Case for Recovery
The U.S. Dollar Index (DXY) has been heavily sold in recent months — but is now holding at a multi-year structural support zone that’s been tested multiple times since 2021.
With Trump returning to the spotlight and triggering a fresh round of global tariff negotiations, the USD is regaining narrative strength.
Trump’s stance has already prompted discussions among major economies, putting the U.S. in a dominant position — and the market is beginning to price that in.
🤔 What’s Holding the Fed Back?
Despite rising trade tensions, the Federal Reserve has remained cautious — choosing not to act until the dust settles from geopolitical and policy developments.
This creates a window of opportunity:
If the Fed holds rates while global central banks soften
And if the USD holds this major support
→ We could see strong dollar flows return in Q2.
🔮 Gold Outlook – Where Next?
In the short term:
Expect continued volatility
Potential for gold to slide further toward 308x – 305x range
Any bounce is likely to be technical rather than fundamental
In the medium term:
Once political noise fades, gold may find support again
Especially if inflation expectations persist or the Fed pivots dovish later in Q2
💡 Takeaways for UK Traders
✅ Don't trade the news — trade the reaction
✅ Macro structure matters more than the daily headlines
✅ Capital preservation beats chasing euphoria
We’re not guessing.
We’re reading the story and planning with structure.
Golden Momentum to Short the goldWe already know what FED powell talked about on the 4th and trump's tariffs which have a very big effect on the global economy.
exchanges have fallen, this pattern is very similar where during the crisis the price of gold also fell sharply because there was no demand from the world and they saw the USD as a safe heaven because the price of gold was also too high.
Price between 3040 -3070 is a entry price to short
Price rocketing above 3110 = bull resisting (very small chance, only below 5%)
Good luck for your trade, lets win this trade.
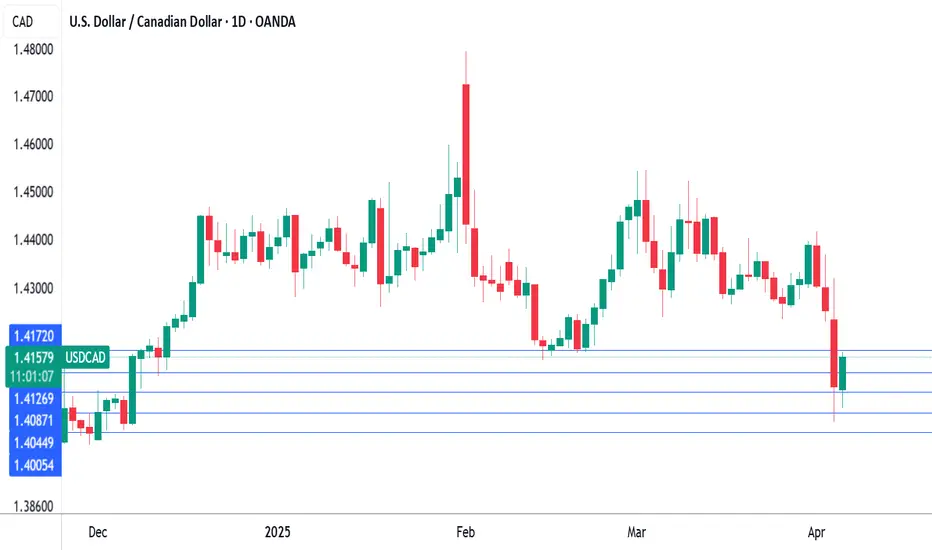
Markets eye US, Canada job reports, US dollar steadiesThe Canadian dollar has taken a break after an impressive three-day rally, in which the currency climbed about 2%. In the European session, USD/CAD is trading at 1.4148, up 0.39%. On Thursday, the Canadian dollar touched 140.26, its strongest level since December.
The hottest financial news is understandably the wave of selling in the equity markets, but there are some key economic releases today as well. The US and Canada will both release the March employment report later today.
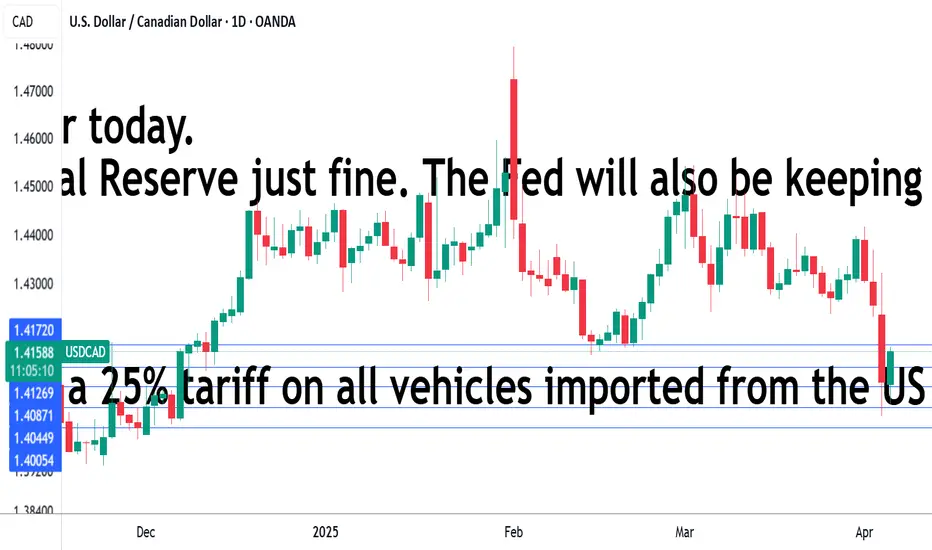
The US releases nonfarm payrolls, with the markets projecting a gain of 135 thousand, after a gain of 151 thousand in February. This would point to the US labor market cooling at a gradual pace, which suits the Federal Reserve just fine. The Fed will also be keeping a watchful eye on wage growth, which is expected to tick lower to 3.9% y/y from 4.0%. The unemployment rate is expected to hold at 4.1%.
The employment landscape is uncertain, with the DOGE layoffs and newly-announced tariffs expected to dampen wage growth in the coming months. Canada's employment is expected to improve slightly to 12 thousand, after a negligible gain of 1.1 thousand in February. Unemployment has been stubbornly high and is expected to inch up to 6.7% from 6.6%.
US President Donald Trump's tariff bombshell on Wednesday did not impose new tariffs on Canada, but trade tensions continue to escalate between the two allies. Canada said it would mirror the US stance and impose a 25% tariff on all vehicles imported from the US that do not comply with the US-Canada-Mexico-Canada free trade deal. The US has promised to respond to any new tariffs against the US, which could mean a tit-for-tat exchange of tariffs between Canada and the US.
USD/CAD has pushed above resistance at 1.4088 and 141.26. The next resistance line is 1.4170
1.4044 and 1.4006 are the next support levels
Markets eye US, Canada job reports, US dollar steadiesThe Canadian dollar has taken a break after an impressive three-day rally, in which the currency climbed about 2%. In the European session, USD/CAD is trading at 1.4148, up 0.39%. On Thursday, the Canadian dollar touched 140.26, its strongest level since December.
The hottest financial news is understandably the wave of selling in the equity markets, but there are some key economic releases today as well. The US and Canada will both release the March employment report later today.
The US releases nonfarm payrolls, with the markets projecting a gain of 135 thousand, after a gain of 151 thousand in February. This would point to the US labor market cooling at a gradual pace, which suits the Federal Reserve just fine. The Fed will also be keeping a watchful eye on wage growth, which is expected to tick lower to 3.9% y/y from 4.0%. The unemployment rate is expected to hold at 4.1%.
The employment landscape is uncertain, with the DOGE layoffs and newly-announced tariffs expected to dampen wage growth in the coming months.
Canada's employment is expected to improve slightly to 12 thousand, after a negligible gain of 1.1 thousand in February. Unemployment has been stubbornly high and is expected to inch up to 6.7% from 6.6%.
US President Donald Trump's tariff bombshell on Wednesday did not impose new tariffs on Canada, but trade tensions continue to escalate between the two allies. Canada said it would mirror the US stance and impose a 25% tariff on all vehicles imported from the US that do not comply with the US-Canada-Mexico-Canada free trade deal. The US has promised to respond to any new tariffs against the US, which could mean a tit-for-tat exchange of tariffs between Canada and the US.
USD/CAD has pushed above resistance at 1.4088 and 141.26. The next resistance line is 1.4170
1.4044 and 1.4006 are the next support levels
Crypto Market at Critical Crossroads: Is History Repeating?Maybe an altcoin season seems too luxurious for us investors right now.
The TOTAL market cap is currently at a critical point, showing price action similar to past cycles.
Previously, we had COVID as our black swan event - could today's equivalent be a trade war?
We're probably approaching the final wave before the market truly enters a downtrend. It's crucial now to stay alert and prepare carefully.
Everything the US is currently doing—including tariffs—serves one goal: shrinking their huge federal debt load, absorbing wealth from other global economies, and keeping gold prices in check. This gives the FED more room to reduce interest rates and reignite growth.
Eventually, global markets always rebalance. Governments typically respond by printing more money to ease the pain, and historically, that's positive news for BINANCE:BTCUSD
Cheap money policies always return; it's just a matter of when.
Your job now is straightforward:
- Be patient
- Stay flexible
- Maintain solid cash reserves
Remain calm, stay sharp, and be ready for opportunities.
#BTC #FED #TotalMarketCap #CryptoTrading #TechnicalAnalysis #CryptoVeteran #TheCryptoFire
Will the BoJ's hawkish approach affect the yen's strength?
US equity markets plunged amid growing concerns that the Trump administration's tariffs, set to be announced on April 2, could be aggressively implemented. Goldman Sachs warned that US tariff rates could reach as high as 18%, potentially shaving 1.0% off GDP growth and pushing the unemployment rate to 4.5% this year.
Bank of Japan Governor Kazuo Ueda signaled a continued tightening stance, stating that if persistently rising food prices lead to broader inflation, the central bank would consider raising interest rates.
USDJPY broke below the support at 149.50 before retracing to 150.00. However, failing to reenter the channel, the price hovers near the channel’s lower bound. If USDJPY fails to reenter the channel, the price may break below 149.50 again. Conversely, if USDJPY reenters the channel, the price could gain upward momentum toward the resistance at 151.30.
