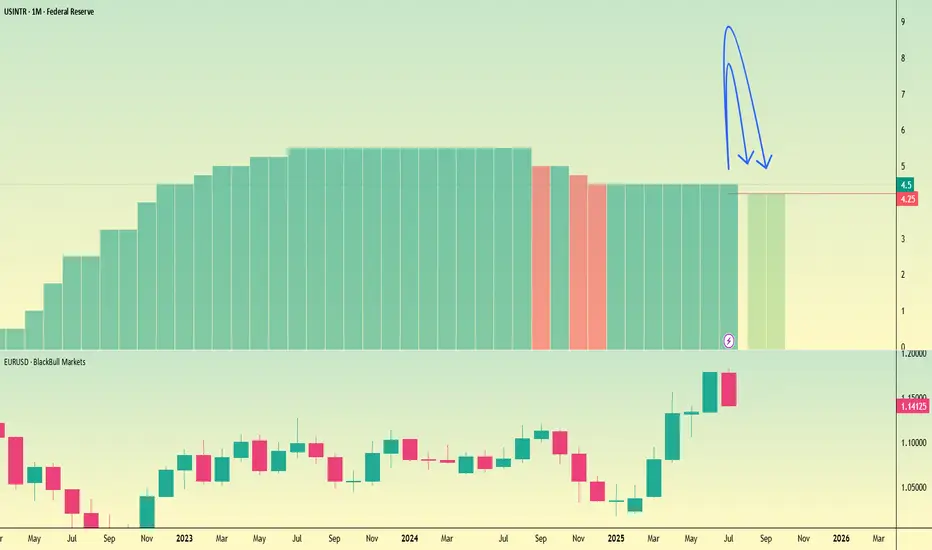
Fed rate cut timing: September or October? The Jackson Hole Symposium has set the stage for renewed downside pressure on the U.S. dollar, as investors increasingly position for a 25-basis point Fed rate cut in September.
However, Morgan Stanley assigns only a 50% probability to such a move, suggesting that a September cut is far from guaranteed.
Market focus is also turning to the prospects of a rate cut in October too. The market is assigning only a small chance of two cuts in a row by the Fed.
Perhaps Morgan Stanely’s outlook implies the Fed may delay the widely expected September cut until October instead.
In practice, the market impact could be similar either way. With a softer dollar and stronger equities if Powell signals in September that easing is on the way the following month.
Federalbank
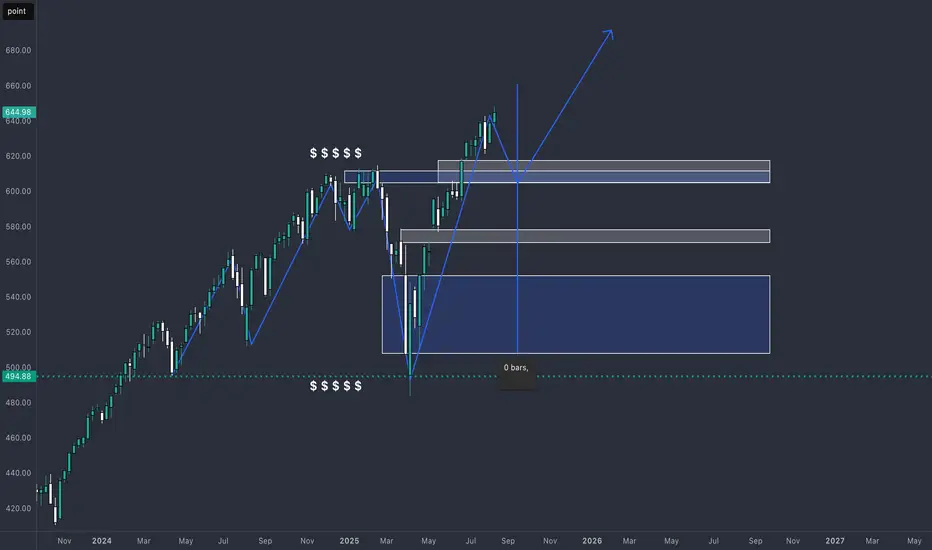
XSP Fed Rate Cut AnalysisCBOE:XSP AMEX:SPY
Based on the chart, since the additional liquidity from the 620 range has been collected, before the Federal Reserve meeting on September 16-17 we could see prices dip to fill the FVG (611-617) and if that doesn’t hold the supply zone (604-610). I am bullish on the rate cuts due to the worsening job market and moderate inflation numbers previously reported including those caused by businesses like Walmart choosing to eat the trumps Tariffs. If rates do get cut, I am targeting 650 (1.618 fib extension). If not we can see a sharp move to the downside, returning back to test the Supply Zone.
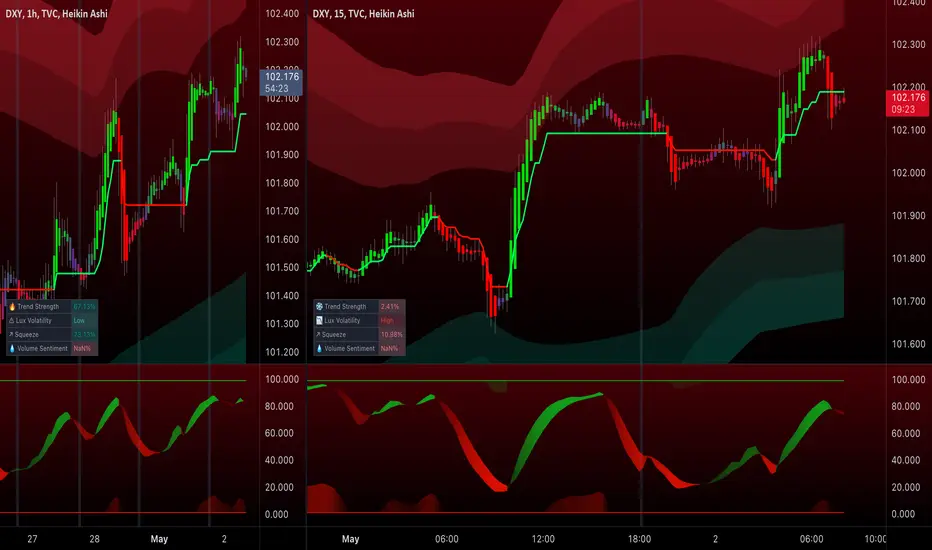
future of the DXYHi to every one
In the DXY we are in the middle of the decisioning area which means
we should wait for the market to show its hands
First sensitive level that i am looking for is the C.E of the weekly candle(Prev.week)
IF we get resistance at that level we can wait for the price to deep into the SSL M level
Other wise i don't see any indication and obstacle for the DXY to reach the OB level above the 0.5 mid level of the range
this is my the first low hanging fruit objective which is high probability
after that my ultimate objective is the SiBi to be rebalanced
This was the technical perspective
BUT
things are happening around the world the most important one is the
USA central bank Interest Rate Cutting Decision which can leads the DXY to go lower without retracting to the 0.5 of the range
this factor also should be considered BUT overall i am bullish for DXY

AUD/USD tests uptrend as Trump targets Powell at Fed siteThe US dollar is trading mixed after President Trump made a rare appearance at the Federal Reserve’s renovation site, in an attempt to distract from you know what.
While the visit had no formal policy announcements, Trump did try to further undermine Chair Jerome Powell by erroneously claiming the renovation cost had blown out to 3.1 billion by adding the cost of a building finished 5 years ago.
Meanwhile, AUD/USD could be of the most interest. Traders might like to watch to see if it can hold its uptrend after its downside breakout from yesterday. AUD/USD remains potentially supported above its 50-DMA, with momentum pointing to potential further upside beyond 0.6625.

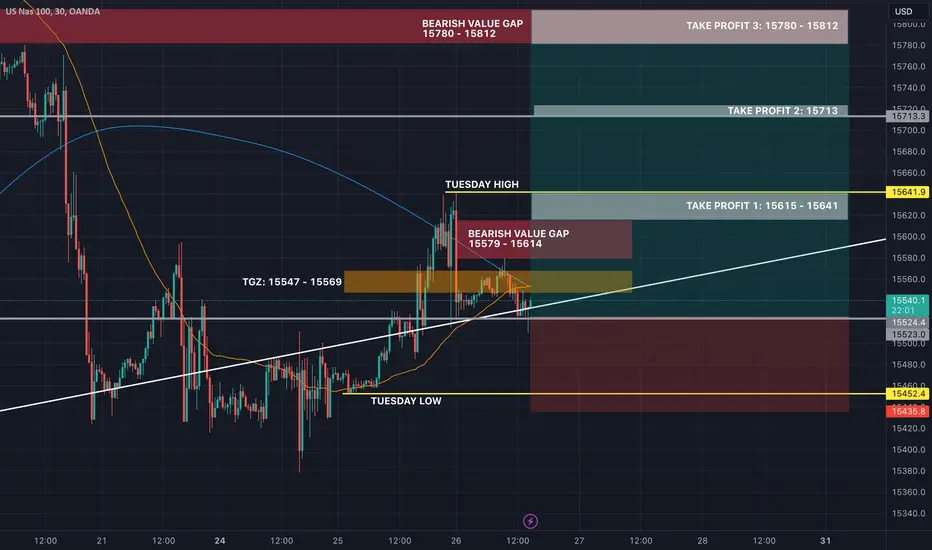
My NQ Long Idea 5/5/2025Been a while but I haven't been posting ideas because I have been scalping and doing smaller time frame trades. I think we have NQ at a nice price level where we might see a bull run soon with the market sentiment slowly "thawing" on the idea of "risk-off" sentiment to "risk-on" sentiment and environment with more uncertainties clearing out of the market scenes.
We have US trying to negotiate deals with many countries including China which is very challenging and we can never know if it will be achieved or not. However, from an economic point of view we can agree that the US economy is in the Neutral-bullish. We have a very bullish price action in the past week or so. We also have healthy economic numbers but it is still unclear until Wednesday.
On Wednesday the FED will speak on this matter and give us some clarity on whether it is a Risk-on or Risk-off environment. Anything will happen but I can see the "Gap" getting filled on FED day due to the SPIKE that will be delivered to us.
Currently Edgefinder tool is giving us 8 for NQ with only the GDP and sPMI scores in the negative. However the net score is bullish and on the positive.
I think 1 of those two ideas will be played out sooner or later anything can happen but from a technical view I would like to see the price reaching the 50% FIB and then take off from there.
It is subjective though and everything in trading is subjective including what I do and say.

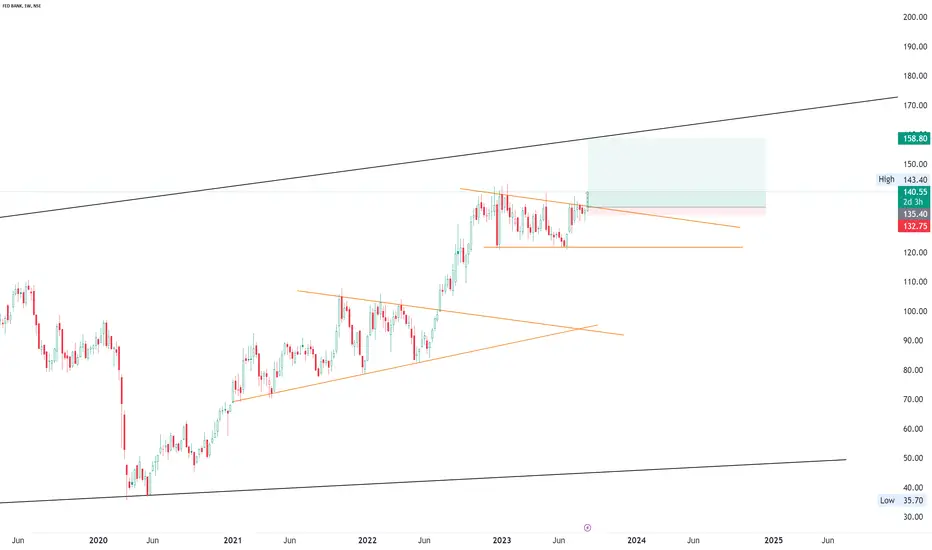
Federal Bank Close To Fib LevelsAs of 25th Feb 2025, The Federal bank, on a monthly timeframe is heading towards its 50% fibonacci levels on monthly timeframe.
However, on daily and weekly timeframe, the stock might look bullish but the major timeframe is contrarian to both daily and weekly timeframe.
Disclaimer: I am an NISM XV Certified research analyst, I am not SEBI registered. Hence, kindly consider this as learning about fibonacci and not a recommendation.
Please consult your investment advisor before investing.

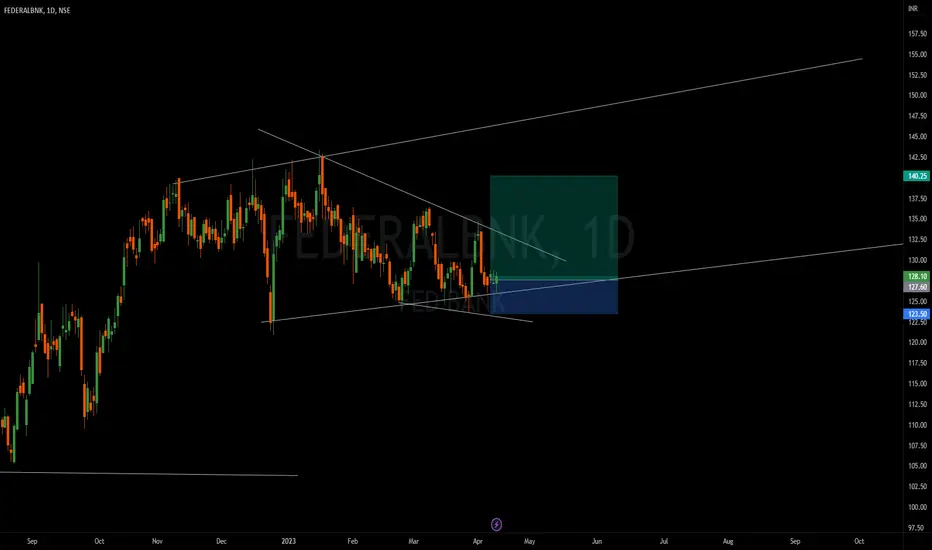
FEDERALBNKNSE:FEDERALBNK
One Can Enter Now !
Or Wait for Retest of the Trendline (BO) !
Or wait For better R:R ratio !
Note :
1.One Can Go long with a Strict SL below the Trendline or Swing Low.
2. R:R ratio should be 1 :2 minimum
3. Plan as per your RISK appetite and Money Management.
Disclaimer : You are responsible for your Profits and loss, Shared for Educational purpose
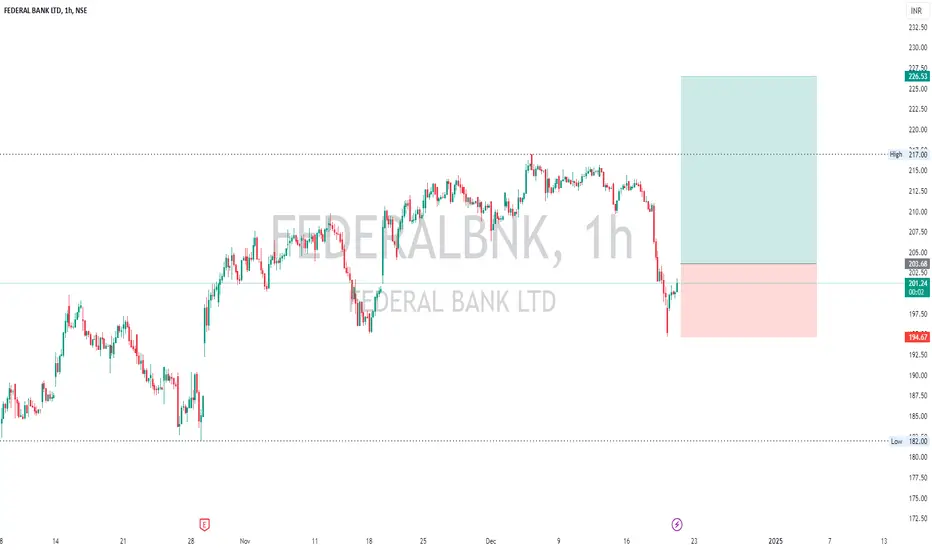
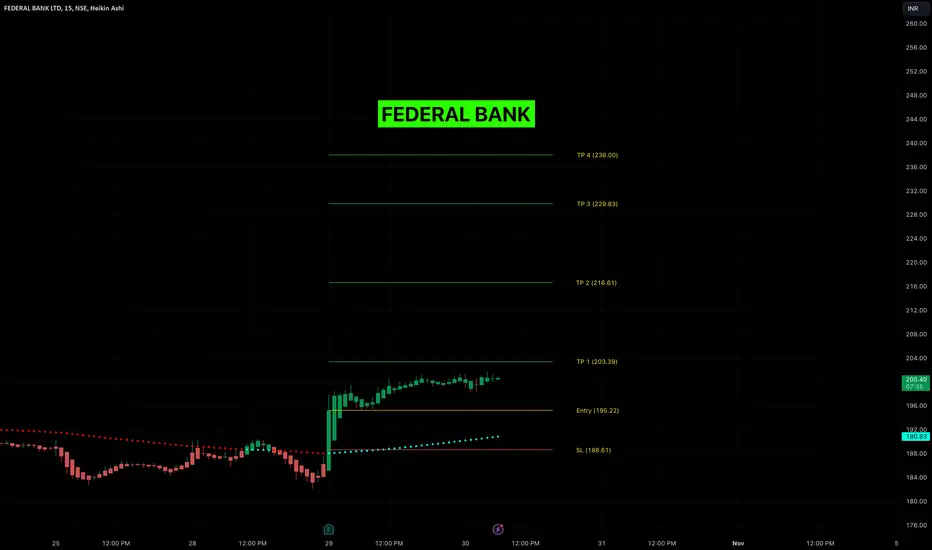
FEDERAL BANK Soars with Q2 Profit Rise! Targets in SightFEDERAL BANK Analysis:
Federal Bank (FEDERALBNK) is showing strong bullish momentum on the 15-minute chart using Risological swing trader, setting up for a promising long trade with an entry at ₹195.22. Following a notable 7% surge in response to rising consolidated net profits in fiscal Q2, all eyes are on potential gains as the stock aims to reach its take-profit levels.
Technical Setup:
Entry: ₹195.22
Stop Loss (SL): ₹188.61
Take Profit (TP) Levels:
TP 1: ₹203.39
TP 2: ₹216.61
TP 3: ₹229.83
TP 4: ₹238.00
Market Sentiment:
The recent earnings report has driven significant buying interest, suggesting Federal Bank’s financial health is on the upswing. This strong performance could fuel continued upward momentum as the stock looks to reach each target level.
With volume still robust, traders are advised to monitor price action as the stock progresses through these levels.
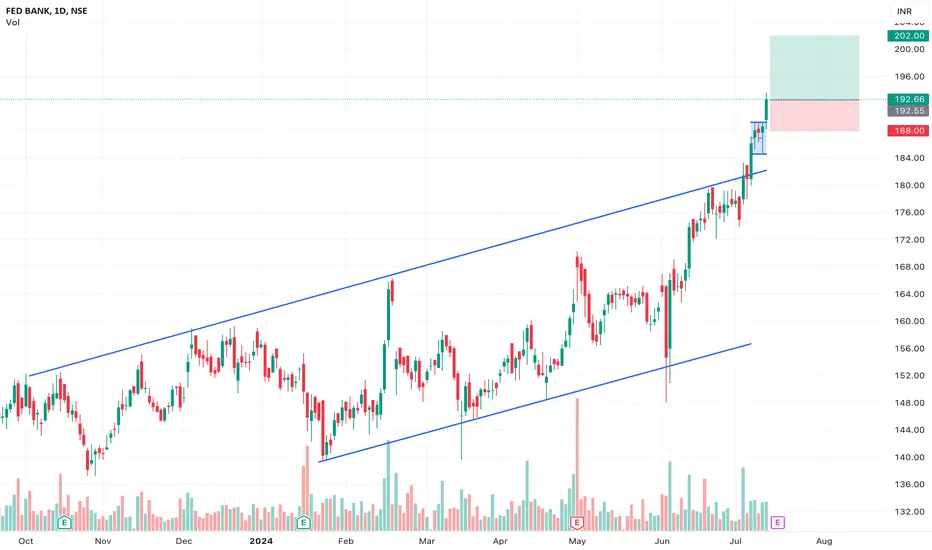
FEDERAL BANK Swing Long SetupEnter with Limit order placed at - 188.59
Target with Risk to reward 1:2 is 202.31
Stoploss only when 1 day candle closes below the price - 181.73
Note: This is not any financial advice, this is for education purpose only

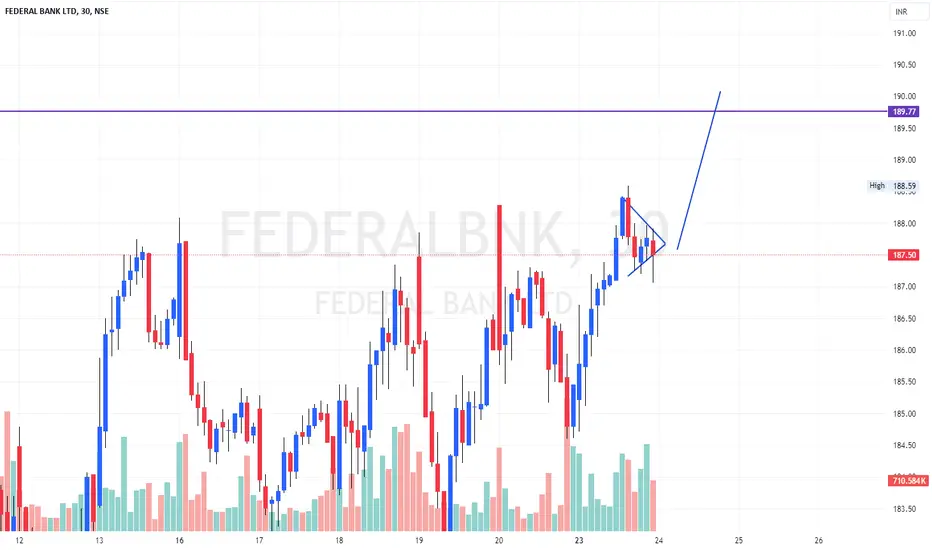
Federal Bank Symmetrical Triangle FormationSymmetrical Triangle Formation: The chart displays a symmetrical triangle pattern, where the price is consolidating with lower highs and higher lows. This pattern often indicates a potential breakout, but the direction is uncertain until it occurs.
Price Action: The price is currently at 187.50, with recent highs around 188.59. The consolidation within the triangle suggests indecision in the market.
Federal Bank's Breakout Alert!Federal Bank (NSE) has broken out of its consolidation phase in a strong uptrend. This could be the perfect opportunity to join the trend and capitalize on potential gains. #Trading #StockMarket #NSE #FederalBank #Investing
Federal Bank Breakout: Strong Bullish MomentumFederal Bank has been following an ascending trend line, indicating a consistent upward movement. Recently, the stock has broken out above this trend line with significant volume, confirming a bullish momentum. Breakouts from such patterns typically signal strong potential for further upward movement.
Trade Setup:
SL: 177
TP: 195
This setup provides a strategic entry with well-defined risk management to capitalize on the bullish trend in Federal Bank.

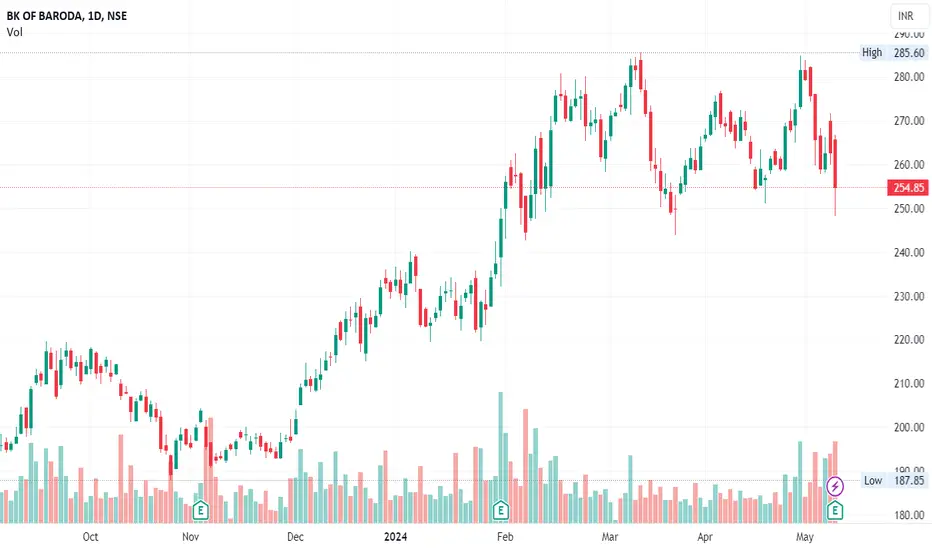
Fundamental Picks - Stock PE < 20 (NIFTY BANK)📊 Script: BANKBARODA
⏱️ C.M.P 📑- 254
🎯 PE 🏆 - 6.98
📊 Script: FEDERALBNK
⏱️ C.M.P 📑- 159
🎯 PE 🏆 - 9.33
📊 Script: BANDHANBNK
⏱️ C.M.P 📑- 187
🎯 PE 🏆 - 10.12
📊 Script: SBIN
⏱️ C.M.P 📑- 817
🎯 PE 🏆 - 11.43
📊 Script: INDUSINDBK
⏱️ C.M.P 📑- 1410
🎯 PE 🏆 - 12.66
📊 Script: HDFCBANK
⏱️ C.M.P 📑- 1437
🎯 PE 🏆 - 16.07
📊 Script: IDFCFIRSTB
⏱️ C.M.P 📑- 76
🎯 PE 🏆 - 17.13
📊 Script: PNB
⏱️ C.M.P 📑- 123
🎯 PE 🏆 - 17.89
📊 Script: ICICIBANK
⏱️ C.M.P 📑- 1117
🎯 PE 🏆 - 18.44
📊 Script: KOTAKBANK
⏱️ C.M.P 📑- 1627
🎯 PE 🏆 - 18.49
Formula to calculate PE = MVP/EPS
MVP - Market Value Per Share (Stock Price)
EPS - Earning Per Share
Industry(NIFTYBANK) PE - 15.7
Always Compare Stock PE with Industry PE for Better Understanding.
LOWER THE PE MORE ATTRACTIVE THE COMPANY.
⚠️ Important: Always maintain your Risk & Reward Ratio.
✅Like and follow to never miss a new idea!✅
Disclaimer: I am not SEBI Registered Advisor. My posts are purely for training and educational purposes.
Eat🍜 Sleep😴 TradingView📈 Repeat 🔁
Happy learning with trading. Cheers!🥂
🇺🇸 US2M - QE To buy the US Debt again ? 💎Here's an intriguing observation I'd like to discuss. The increasing number of diamond 💎💎 alerts serves as a warning sign indicating an imminent significant market move.
- What is the US2M?
The M2 money supply is a measure of the total amount of money in circulation within an economy that includes cash, checking deposits, savings deposits, and other liquid assets. It's broader than M1, which only includes cash and checking deposits. M2 is important because it gives a more comprehensive picture of the available money for spending and investment within an economy.
- Does quantitative easing add to the money supply?
Quantitative easing expands the money supply by enlarging the central bank's balance sheet and introducing fresh cash into the economy. This process boosts banks' reserves held at the central bank, effectively increasing the overall money available for circulation and lending.
So what does it imply ?
📈 When we say quantitative easing increases the money supply, it means that it adds more money into circulation within the economy. This can lead to more available funds for spending, investment, and lending, which can stimulate economic activity. ( + the US Dollar often goes down in this case)
📉 On the other hand, if we say quantitative easing decreases the money supply, it would mean the opposite: the central bank is reducing the amount of money in circulation. This could be done to control inflation or to address other economic concerns where too much money in circulation might cause problems like rising prices. (+ the US Dollar often goes up in this case)
Do not forget to check this US2M Chart, it is very important.
I wish you a great day.
ILT 💎

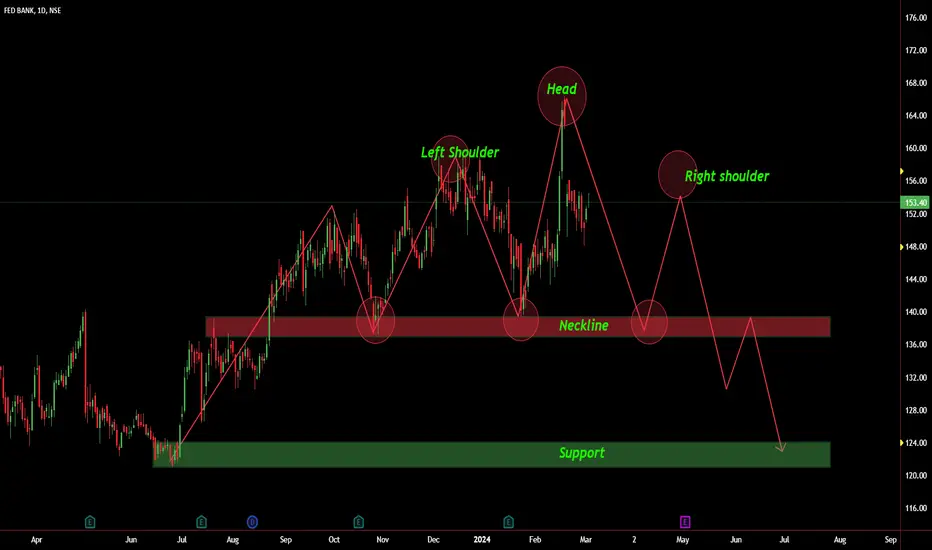
FEDERALBNK::Analysis A strong move is identified in this stock movement.
later a gap down is observed, neckline at 140 level failed to push the price upside,
then price test the support at 124 levels soon.
A left shoulder is detected at 156 levels, keep in bearish side as long as price is below the head section...
no long side is possible in this stock.
neckline is acting as support multiple times, if liquidity grab below these levels be finished soon, keep looking for long once
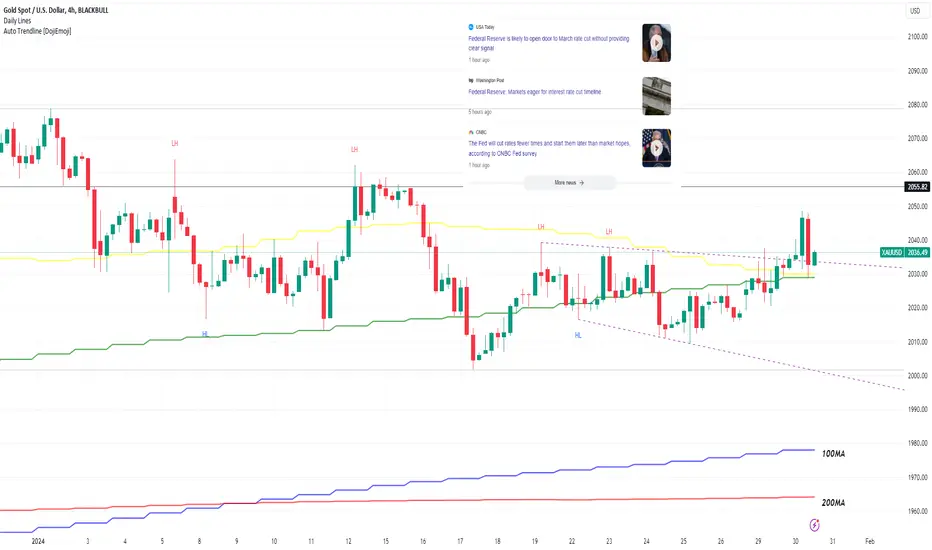
Gold forecast: Crazy to expect rate cut tomorrow? Gold forecast: Crazy to expect rate cut tomorrow?
Mostly yes. Market consensus leans towards the U.S. central bank maintaining current interest rates following the conclusion of its two-day meeting tomorrow. However, the potential impact on the U.S. dollar and gold is likely to hinge on statements from Fed Chair Jerome Powell regarding expectations for a rate cut.
While there is an anticipation of a somewhat dovish shift from Fed officials in the market, the robust January data and the positive JOLTS job report this morning present a case for the possibility of a sustained hawkish stance,
The JOLTS report revealed that U.S. job openings in December surged to 9.026 million, surpassing the expected 8.750 million and marking the highest figure in three months.
XAU/USD was trading in the green for a second consecutive day before the JOLTS report. Gold is currently above a mildly bearish 20 Simple Moving Average for the first time in over two weeks, with longer moving averages situated significantly below the current level.
Still, gold has breached its minor downtrend line originating from the early January high raises the possibility of a bullish target towards $2055, presumably reliant on the possibility of a Fed rate cut (or not).
How the Fed affects long Bond YieldsInverse chart of US10Y Yield to show changes in Bond prices.
Overlayed with the following:
Fed Funds Rate
US Treasury Deposits to Federal Reserve Banks
Increase/Decrease Rate of change to Fed Balance Sheet
Balance Sheet Total in separate pane below
The USCBBS Percentage Change shows the money raining down :-D
It's clear to see the relationship between the Fed buying Treasuries, i.e. Quantitative Easing (QE) and the increase in US10Y prices.
Quantitative Tightening (QT) is the name of the game now. There is A LOT of QT left to do, we're at most 25% into QT since the Fed has only rolled off roughly 1Trillion. They likely have 3+ Trillion to go. Expect US10Y to be under continued pressure as long as QT is in effect. Even when Fed Funds rates are lowered it will have little effect on US10Y while the biggest buyer of Treasuries is on hiatus.

Nasdaq Trade idea - FOMC Meeting FOMC INTEREST RATE HIKE TONIGHT
Expecting some heavy volatile @ 8pm SAST - possibility of some bearish takeover depending on how the market digests the meeting.
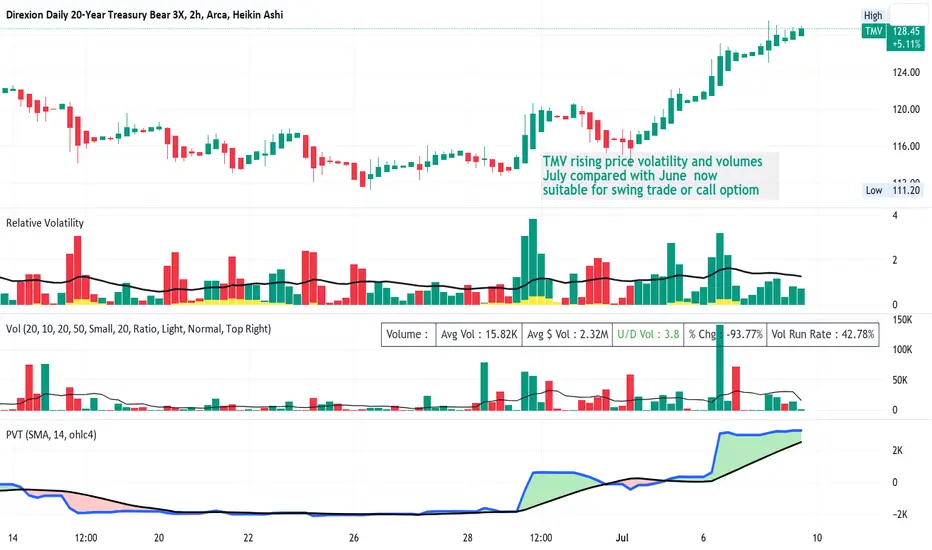
TMV Treasuries Leveraged 3X Short Inverse LongTMV is an ETF Shorting the Treasuries. On the 2H chart, price is rising as the treasuries are
suffering value contraction while interest rates are steady or projected to rise. The chart shows
rising volumes, upwards volatility as well as a PV Trend demonstrating trend strength. I see
these all as confirmatory for bullish momentum. I will take a long trade into the next round
of federal news. The employment data showing strength in new jobs and low unemployment
will likely lead to another rate hike as the fed continues to try to beat down inflation and
will not relent in face of those data pieces. CPI and PPI may add fuel to the fire this week
and TMV may continue to rise.
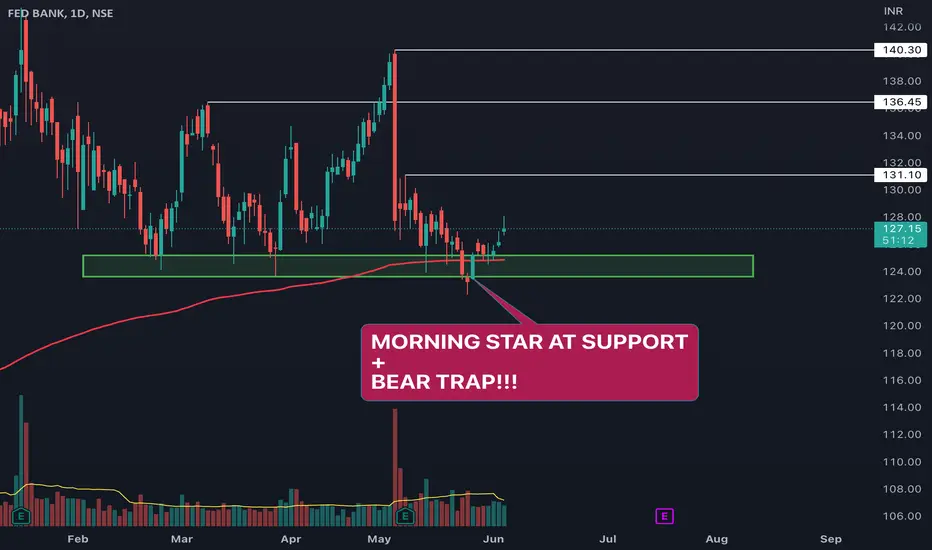
FEDERAL BANK LONG SWING TRADE | 10% UPSIDE POTENTIAL I am bullish on banking sector.
FEDERAL BANK looks interesting.
The price reached the daily support area around 125 and firstly, gave a BEAR TRAP and then formed MORNING STAR CANDLESTICK PATTERN. Both of these are bullish signals.
Expecting price to rise till:
1. 131
2.136
3.140
Stop loss can be below 124.
Let me know in comments section if you want me to analyse any other stock/crypto/forex pair/commodity.
HERE we go with this Fed chatter - Dollar IndexTVC:DXY
Not expecting much from here on out.
We are tail gating in front of fed meeting.
Be careful