FEG is still alive! will riseNote: This symbol is a risky symbol and has a small volume and high volatility.
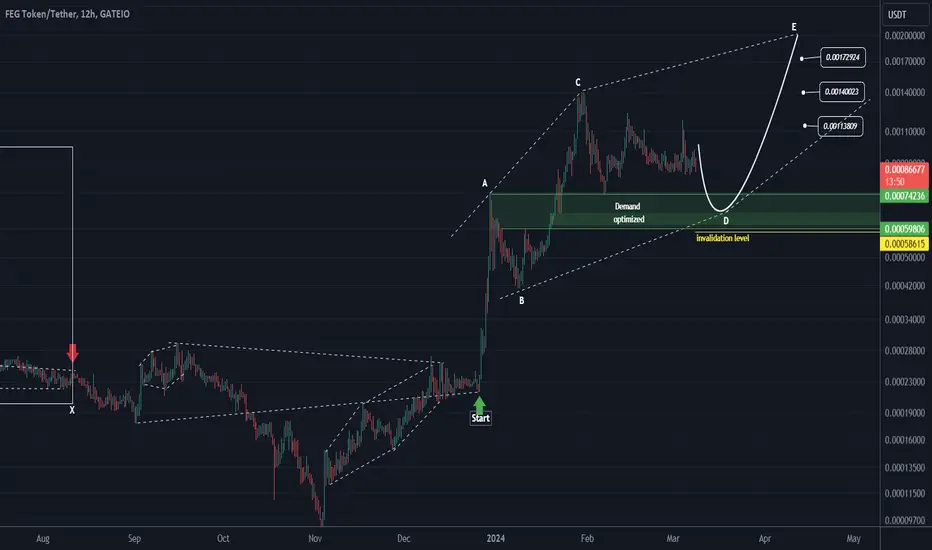
Looking at the FEG chart it looks like we have a triangle from where we put a red arrow on the chart and then a green arrow where we put a green arrow on the chart.
After completing the triangle (where the green arrow is located) it looks like a diamond diametric is formed. Now it seems that we are in wave D of this diametric and it will end somewhere on the green range of this wave and then we will enter bullish wave E.
The closer the price is to the optimized range, the less risky the buy will be.
Closing a daily candle below the invalidation level will violate the analysis.
For risk management, please don't forget stop loss and capital management
When we reach the first target, save some profit and then change the stop to entry
Comment if you have any questions
Thank You