ETH/USD Rebounds, Faces Key ResistanceFenzoFx—Ethereum rebounded from the previous day's low, now trading near $3,639.0. This level contains an order block that triggered bearish reactions earlier this week.
The trend remains bullish as price holds above the VWAP from July 1st. A close above $3,724.0 is needed to confirm continuation.
If bullish momentum holds, ETH may target $3,818.0 and $3,941.0. However, a drop below $3,546.0 would invalidate the bullish outlook. In that case, ETH/USD could revisit $3,410.0 and $3,354.0.
Fenzofx

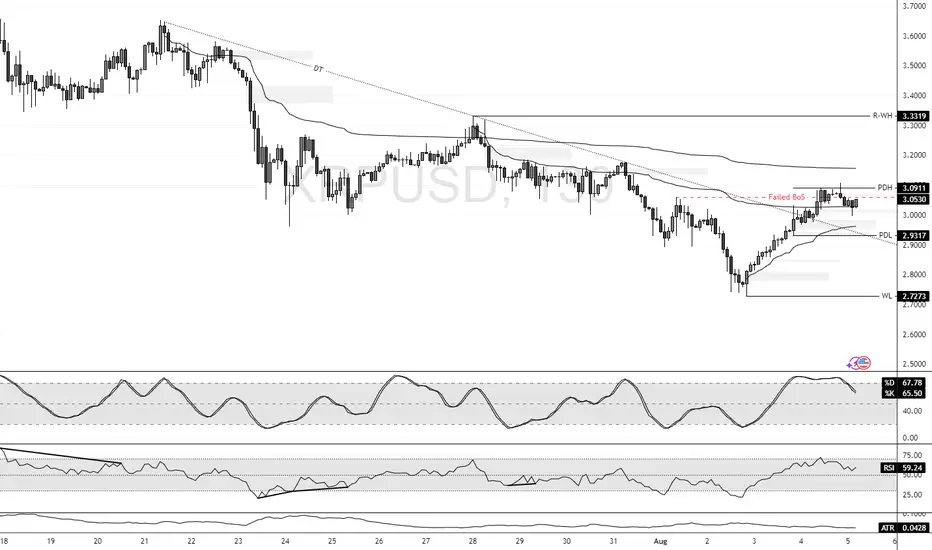
XRP's Failed Structure Break Signals Further ConsolidationFenzoFx—XRP/USD currently trades around $3.045 in a low-momentum market. Stochastic exited the overbought zone and is declining, signaling strengthening bearish momentum. The failed structure break in the New Session suggests a liquidity sweep with weak bullish interest.
Immediate resistance stands at $3.091. Technically, price is expected to decline toward the previous day's low at $2.931, a key liquidity zone. Please note that the bearish outlook is invalidated if price exceeds $3.091.
EUR/USD Breaks Daily Lows as Consolidation DeepensFenzoFx—EUR/USD consolidates after the impulsive bullish momentum. The uptrend initiated after the price swept below the monthly lows at $1.1400. In the current trading session, the price dipped below the previous day's low, meaning the consolidation period will likely extend to a lower support level.
The immediate resistance is at the previous day's high, the $1.159 resistance. From a technical perspective, we expect the currency pair to trade lower, near the support at $1.146, the bullish break of structure.
This level can provide a discounted price to join the dominant trend, which is bullish. We expect the Euro to rise toward $1.169 after the end of the consolidation period.

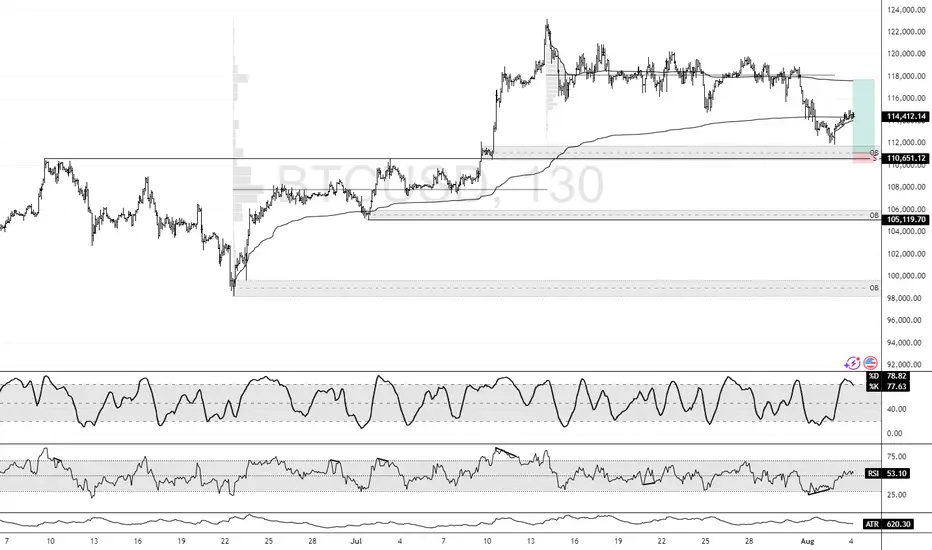
Bitcoin Consolidates Below VWAP Amid Structural UncertaintyFenzoFx—Bitcoin’s downtrend eased near the bullish order block but hasn’t entered the zone. It’s currently consolidating around $114,360.0, below the July 14 VWAP.
No clear break of structure has occurred, making long positions risky. Key support lies at $110,650.0, backed by high volume.
Technically, price is expected to enter this zone. If it does, traders should watch for a break of structure on lower time frames like M15. This setup offers a minimum 1:7 risk-to-reward.
If BTC closes below the main support, bearish momentum may continue toward the next order block at $110,120.0.
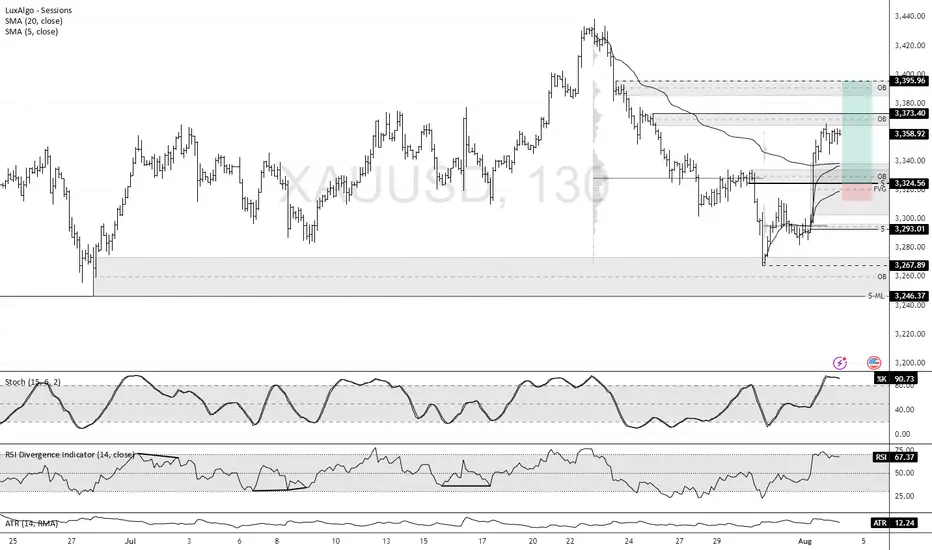
Gold: Key Support Zone Holds Bullish PotentialFenzoFx—Gold turned bullish after testing the order block at $3,267.0. Stochastic is overbought, suggesting possible consolidation. The bullish candle on August 1st created a fair value gap and broke structure, but no discount entry has formed yet.
Immediate support lies at $3,324, backed by weekly VWAP, FVG, and volume point of interest. Traders should wait for price to revisit this zone for a bullish setup. If support holds, momentum could push gold to $3,395.0. The setup offers a favorable risk-to-reward ratio of at least 1 to 6.
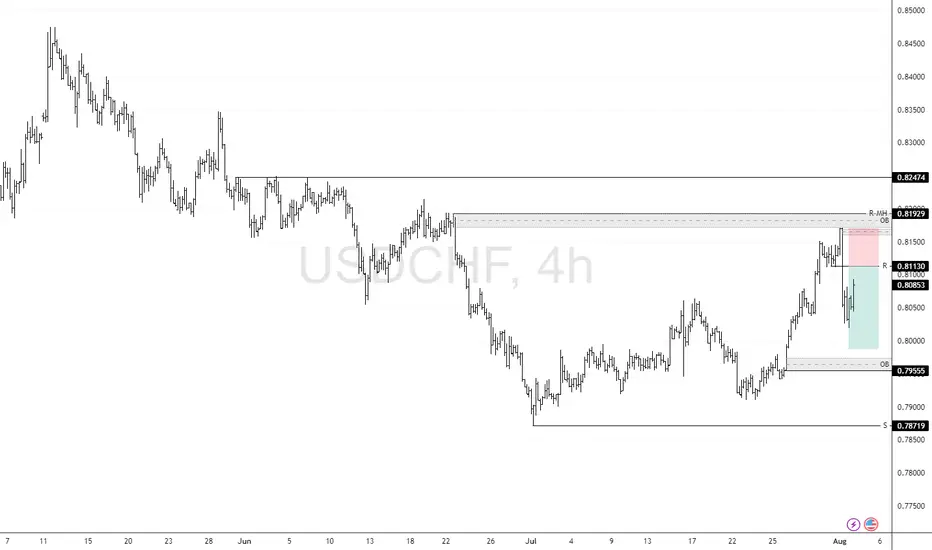
USD/CHF: Order Block Rejection Signals Downtrend ContinuationFenzoFx—USD/CHF started a new bearish wave after it reached the order block at approximately 0.817. Today, the pair is filling the bearish fair value gap by approaching the immediate resistance at 0.8113.
From a technical perspective, if this level holds, USD/CHF will likely resume its bearish trajectory. In this scenario, the price has the potential to target the 'buy-side' liquidity zone at 0.7955.
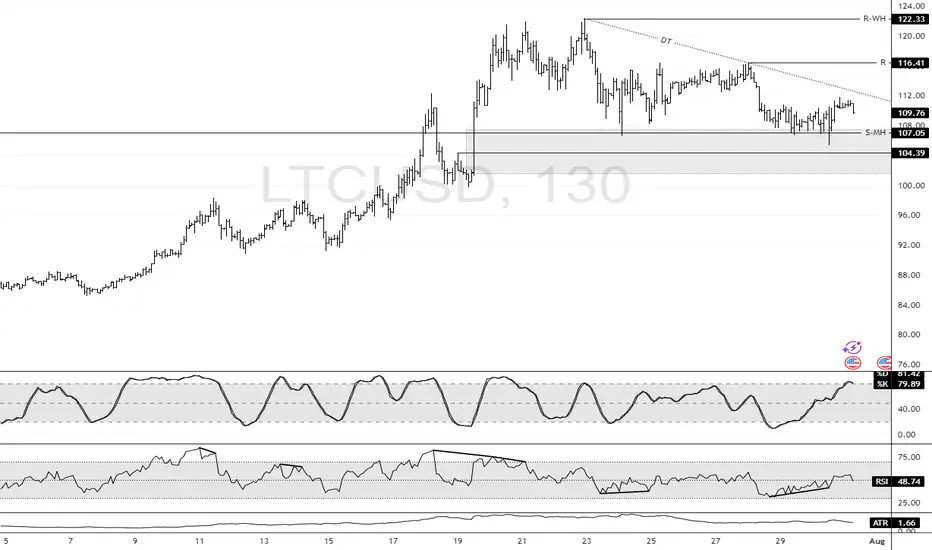
LTC: Bullish Structure Intact Above $104.3 SupportFenzoFx—Litecoin swept liquidity below $107.0 during today’s session and is currently trading near $110.0, supported by a descending trendline.
Technically, key support stands at $104.3. As long as this level holds, the bullish outlook is preserved. A break above the descending trendline could propel LTC toward the previous highs at $116.4 and potentially $122.3.
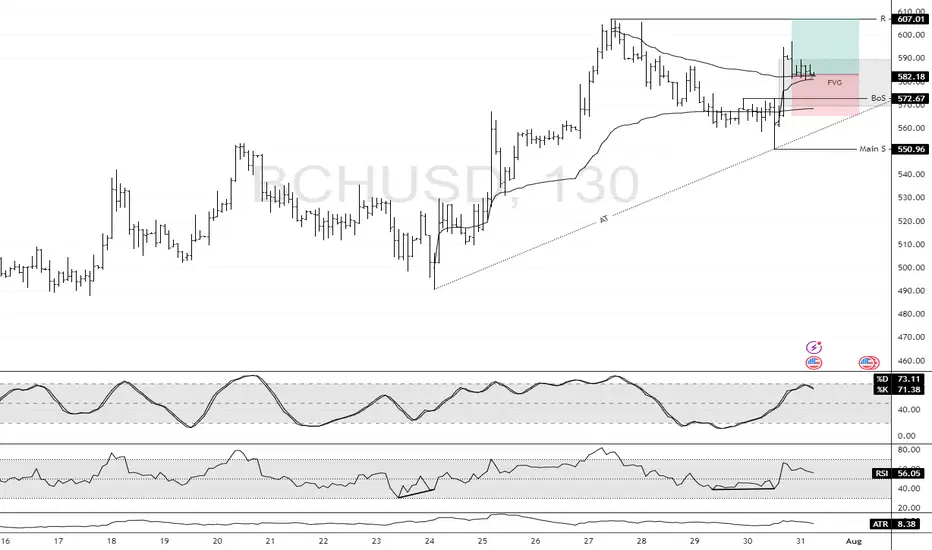
Bitcoin Cash Breaks Structure With Bullish MomentumFenzoFx—Bitcoin Cash remains bullish, trading back above the VWAP from July 24 near $582.9. Today’s breakout above $572.6 featured a strong bullish engulfing pattern, leaving a fair value gap now under test.
The outlook favors revisiting the $607.0 high, and with the trend still positive, it’s advisable to leave a runner open. A further rally toward $630.0 remains likely if momentum persists.
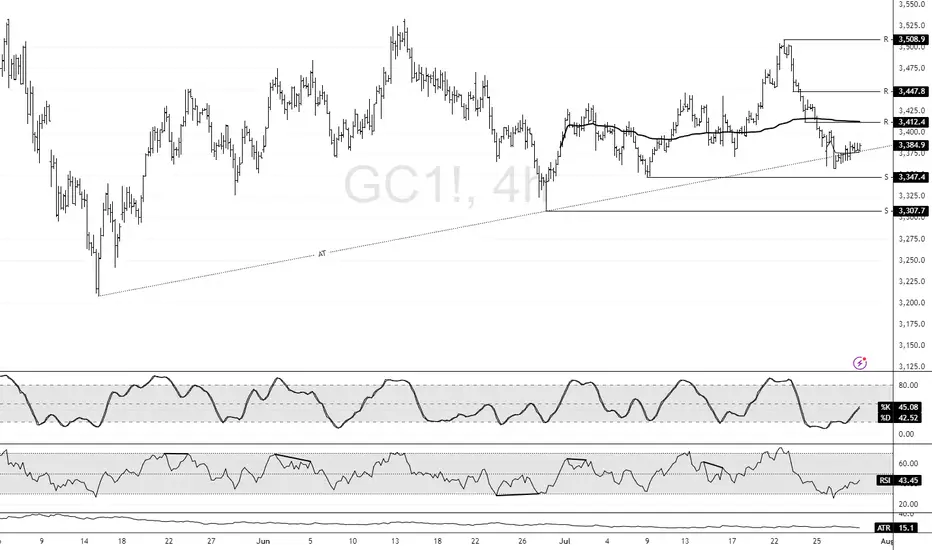
Gold Holds Trendline Amid Rising MomentumFenzoFx—Gold remains above the ascending trendline, trading around $3,386.0. Technical indicators like RSI 14 and Stochastic show rising momentum, reinforcing the bullish bias.
Immediate support lies at $3,347.0. If this holds, XAU/USD may climb toward the monthly VWAP at $3,412.0.
The bullish outlook is invalidated if Gold closes below $3,347.0, which opens the door for further downside toward the next support at $3,307.7.
WTI Crude Eyes Bullish Momentum Above $68.9FenzoFx—WTI Crude Oil broke resistance at $68.9 in the last session, now trading near $70.6. This breakout supports a bullish shift.
Yet, RSI 14 and Stochastic indicate overbought conditions, suggesting possible consolidation. Support at $68.9 could offer a discounted entry if prices retreat.
Watch for bullish signs like candlestick formations and inverted FVG around the $68.9 support.

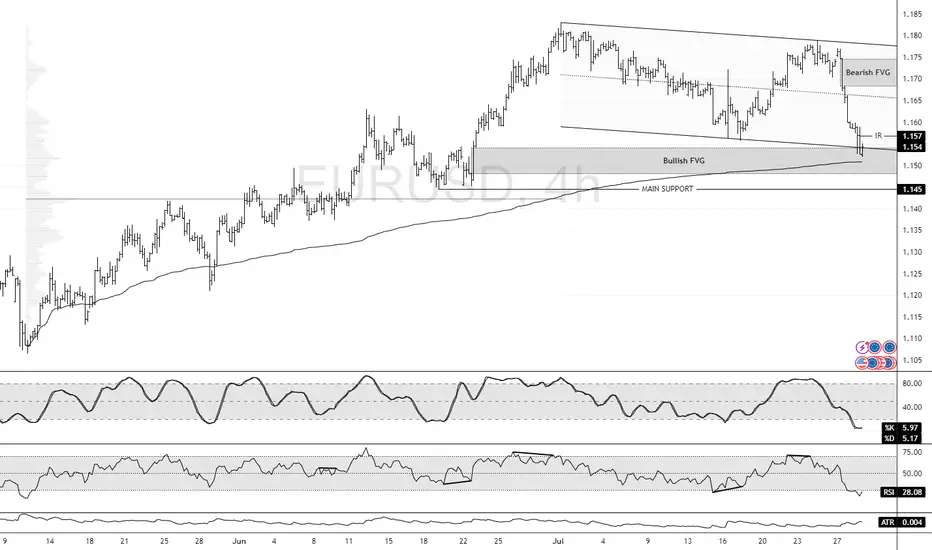
EUR/USD at Discount Level: Bullish Setup in FocusFenzoFx—EUR/USD bearish momentum extended to $1.154, the lower line of the flag. This is a support area backed by the Bullish FVG.
The immediate resistance is at $1.157. From a technical perspective, a close above this level can trigger an uptrend, targeting the bearish FVG at approximately $1.170 to $1.175.
Please note that the bullish outlook should be invalidated if EUR/USD falls below the main support level at $1.145.
XRP: Support at $2.960 Holds the Bullish SetupFenzoFx—XRP dipped from $3.666 but stabilized near the monthly anchored VWAP at $2.960. It now trades at $3.142 above the ascending trendline.
Immediate resistance lies at $3.332, aligned with the descending trendline. A close above this level may propel XRP to $3.432. Strong buying could extend gains to the recent high of $3.666.
The bullish outlook stands while XRP/USD holds above key support at $2.960. A drop below this level would invalidate the bullish scenario.

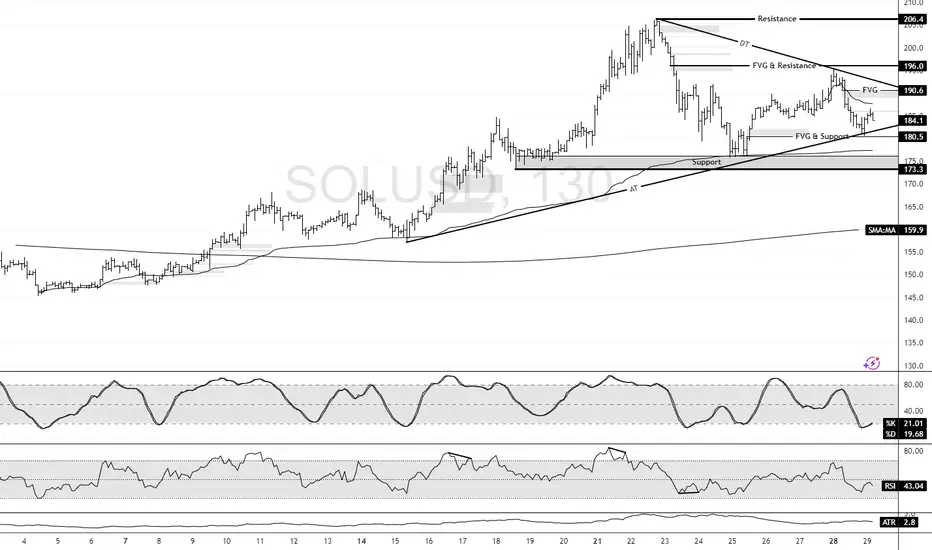
Solana Holds Firm Above VWAP and TrendlineFenzoFx—Solana remained above the ascending trendline and the monthly VWAP, currently trading sideways inside the wedge.
Critical support is at $173.3, and the market outlook remains bullish above this level. If this demand level holds, we expect Solana to resume its bullish trajectory and target the recent highs at $206.4.
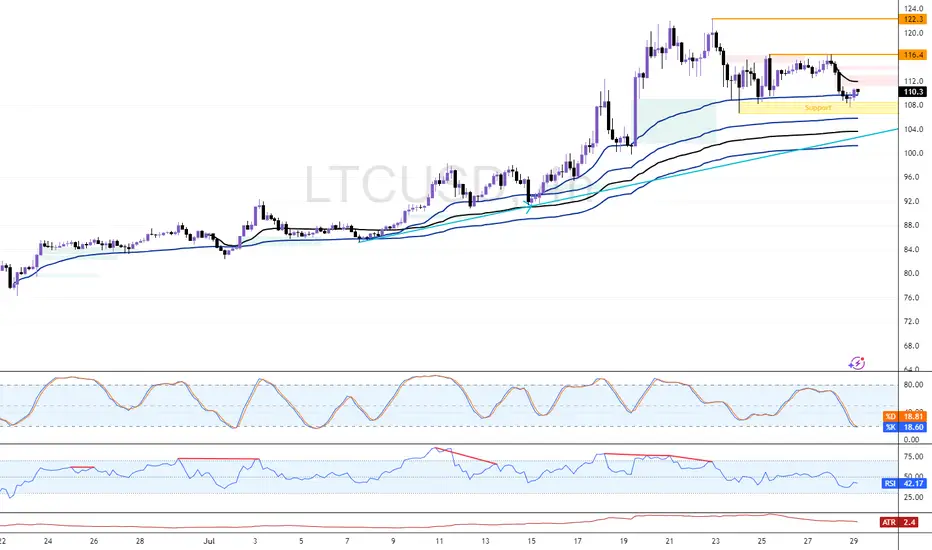
Litecoin: VWAP and Oversold Signal Potential BounceFenzoFx—Litecoin formed a double top at $116.4, causing a price dip. Currently, LTC trades near $110.1 after forming a double bottom. The Stochastic Oscillator is in oversold territory, suggesting a potential bounce, supported by VWAP from July 15.
Technically, if LTC holds above $110.1 and key support at $104.0, the uptrend could resume. In this scenario, the bullish targets would be $116.4 and $122.3.
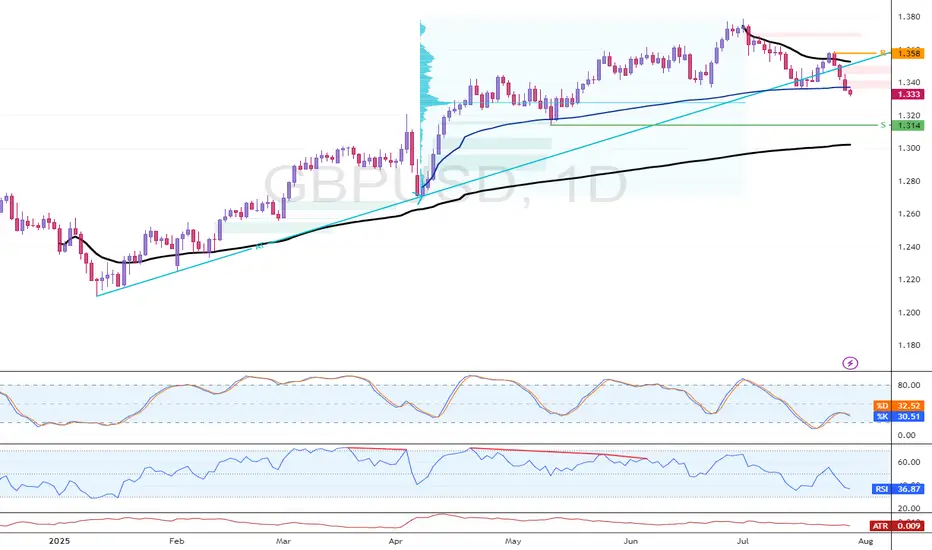
GBP/USD Weakens Below TrendlineFenzoFx—GBP/USD broke below the ascending trendline and currently trades slightly below the VWAP at $1.322. Immediate resistance is at $1.357. From a technical perspective, the downtrend will likely extend to $1.313 if this level holds.
The bearish outlook should be invalidated if GBP/USD closes and stabilizes above $1.357.
Gold: $3,348.0 Resistance in Focus for BullsFenzoFx—Gold's decline reached the ascending trendline near $3,314.0. The bullish trend remains intact while price holds above the trendline.
Immediate resistance is $3,348.0, and a close above this level could lift the market toward $3,389.0 and potentially $3,451.0, aligning with recent higher-lows.

Bitcoin: The Key Buying Level Near $112K Liquidity ZoneFenzoFx—Bitcoin consolidation extended into the bullish FVG, trading near $115,470.0. The 4-hour chart shows an indecisive candle, while the 200-day MA points upward, signaling bullish control.
The bullish outlook remains intact if price holds above the critical $112,000.0 support. However, current bearish momentum may drag price toward this level, potentially filling nearby FVGs.
Traders should monitor $112,000.0 for bullish setups, including break of structure and long-wick bullish candles.

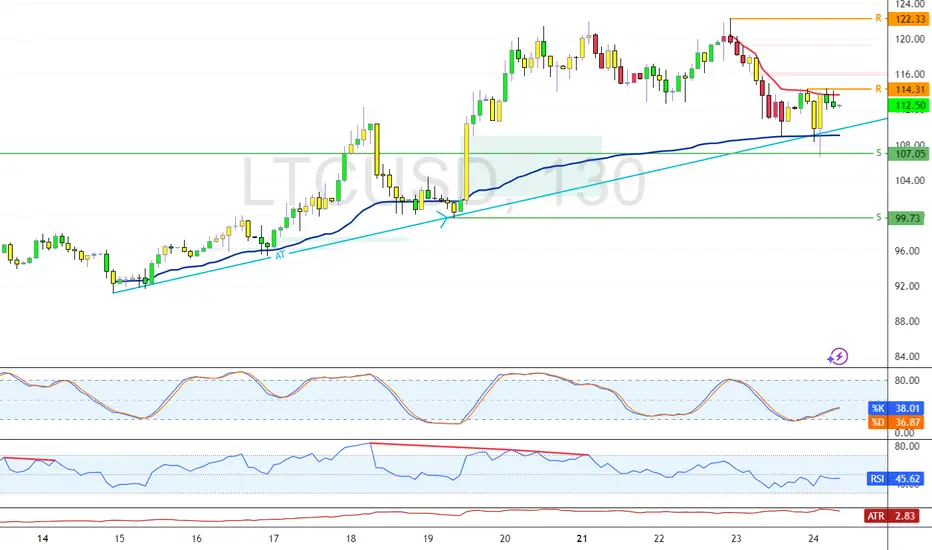
Litecoin Rebounds Off Trendline in Bullish Continuation SetupFenzoFx—Litecoin rebounded from the ascending trendline, a demand zone supported by the VWAP from July 25th.
Immediate resistance stands at $114.3. A close above this level may resume the bullish trend, potentially targeting previous highs near $114.3.
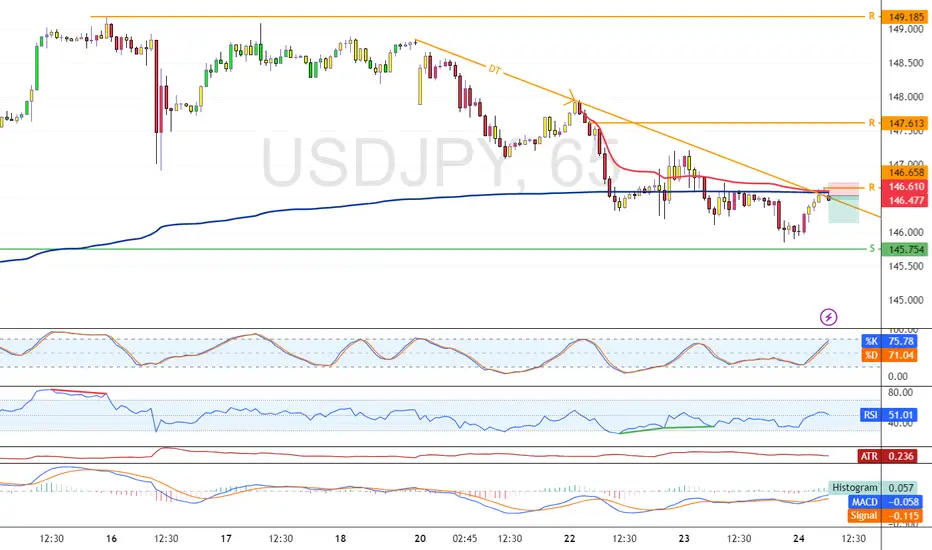
USD/JPY Tests Pivotal Resistance in Bearish ContextFenzoFx—USD/JPY is testing the support at 146.6. This level is backed by anchored VWAP and the descending trendline.
From a technical perspective, the downtrend should resume if this level holds. In this scenario, the next bearish target could be 145.7. Furthermore, if the selling pressure exceeds this level, the price could fall toward the support at 144.1.
Litecoin Retests $112.3 Support Amid Bullish MomentumLitecoin remains bullish above the 50-day SMA, supported by an ascending trendline. As of now, LTC trades near $113.0, retesting this area as support. A sustained hold above the trendline could initiate another bullish leg, targeting resistance at $130.3.
However, a close and stabilization below the trendline would invalidate this outlook and suggest increased selling pressure.

BCH/USD: Bullish Momentum Builds Near Key Volume ZoneFenzoFx—Bitcoin Cash is testing last week's volume point of interest, with bullish long-wick candlesticks signaling buyer strength on the 4-hour chart.
As long as BCH/USD holds above the ascending trendline, the price may rise toward the bearish FVG at $539.6, then target the previous high at $553.5. If the trendline fails, downside momentum could extend to $469.1.

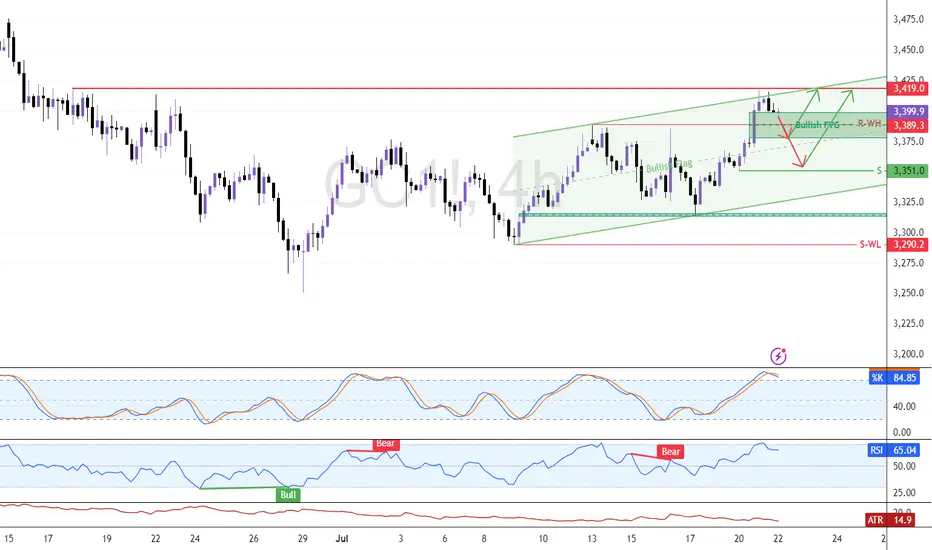
Eye These Levels to Go Long On GoldFenzoFx—Gold remains bullish but eased at $3,419.0 resistance. The Stochastic at 85.0 suggests a pullback may follow. Traders can watch support at $3,389.0 for short-term scalping.
Swing entries may emerge near $3,351.0 if bullish signals appear, such as candlestick patterns, structure breaks, or fair value gaps. Updates will follow if price reacts to these levels.
ETH Eyes Consolidation from Overbought ZoneFenzoFx—Ethereum pulled back from the daily bearish FVG. The recent candle closed with a long wick and flat body, reflecting market uncertainty. Momentum indicators remain in overbought territory, signaling a possible consolidation phase.
If resistance at $3,848.0 holds, the price may decline toward support at $3,461. However, the bullish outlook stays valid as long as ETH/USD holds above $3,848.0.
