Ferrari, very interesting set-upferrari's weekly chart looks quite unsettled: A head and shoulders pattern formed, but on the neckline level I can see a hammer and an inverted hammer. And even this week's candle seems to feel the neckline resistance. What to do then? No fucking idea. Consider a short if it breakes the neckline. But goddamit those two hammers are making me hard and anxious to buy. What do you god forsaken twats think?
Ferrari


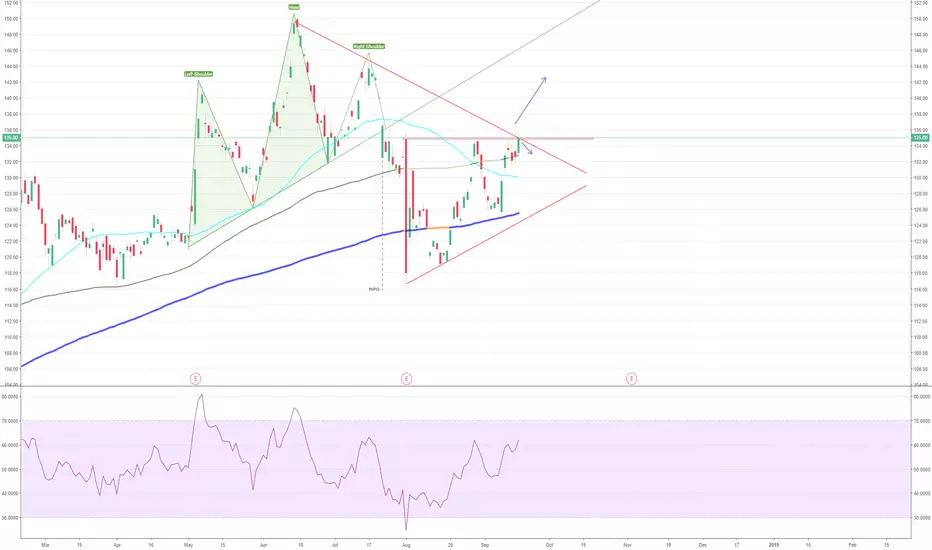
FerrariThe Ferrari chart offers good opportunities to get into this stock. Currently at a resistance level for a few days now, pushing of the 100 SMA. A break above 136 is a trigger for a long trade. Alternatively a small risk on shorting the bounce of the resistance, though waiting for it to push lower than 100 SMA would provide better confirmation.
Ferrari is a new longFerrari seems to be ready to break above its high at 92 Usd Dollars. An increase in volumes has been detected. This might be a signal of the upcoming break of the horizontal resistance at 92 Usd dollars. On 4hr charts, the Price oscillator has now crossed above the zero line, which is a strong bullish signal. Coppock curve is not oriented upwards, as MACD. On a daily and weekly charts, it is clearly visible a stable uptrend

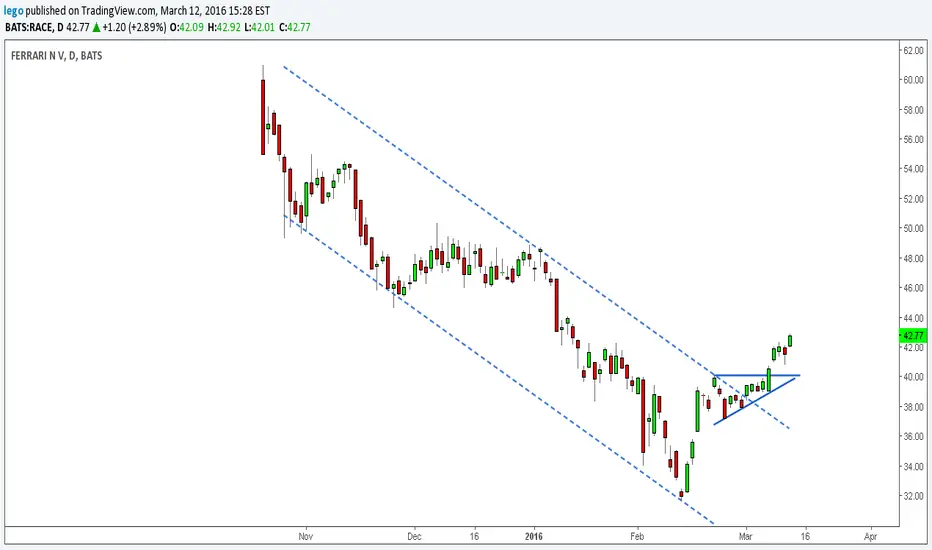
Ferrari: daily triangle breakoutMain signals:
double bottom
triangle
gap
Buy 49.50-50.00
Stop-loss 47.34 (-1 tick under triangle)
Target #1 57.50
Target #2 60.00