FET

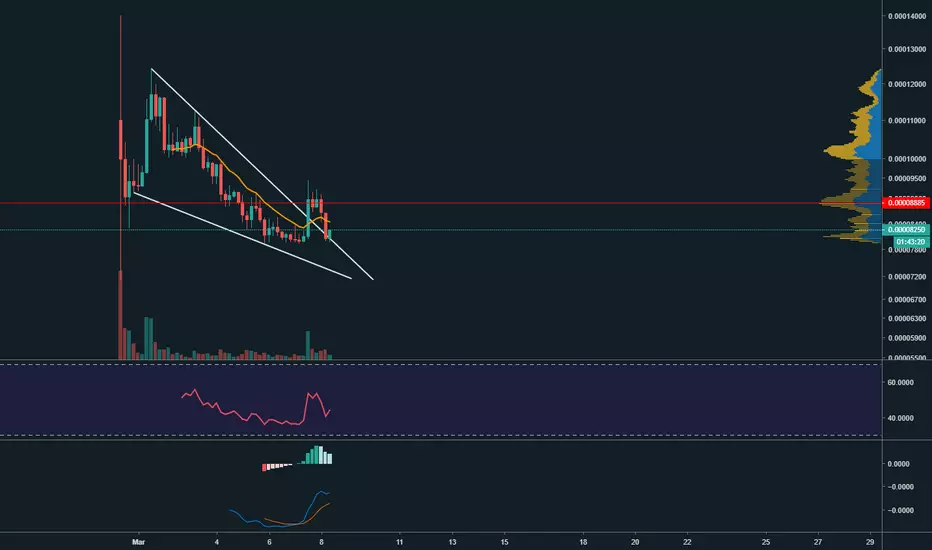
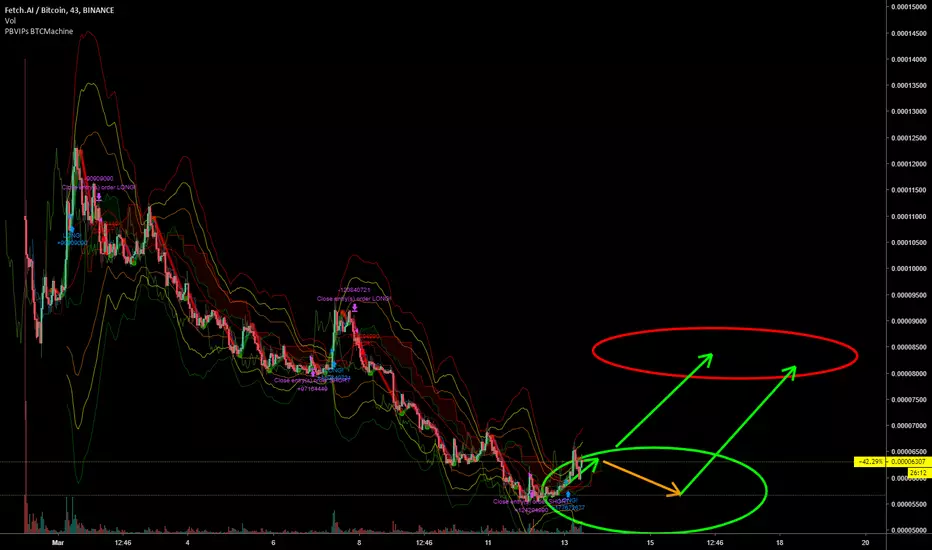
Bullish on $FETLooks like $FET found local bottom.
It broke out of descending channel, it broke the inverse h&s neckline and started making higher lows.
It just needs a volume push for a more significant move.
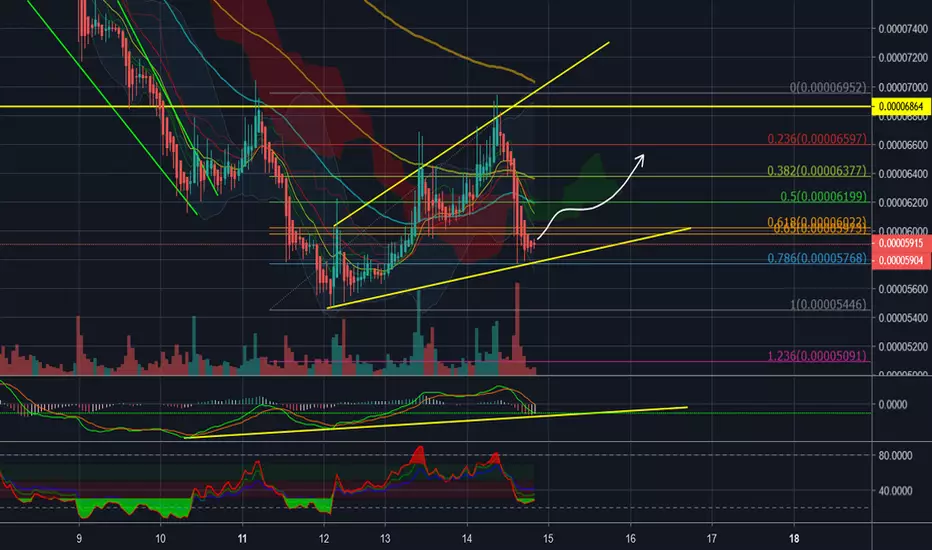
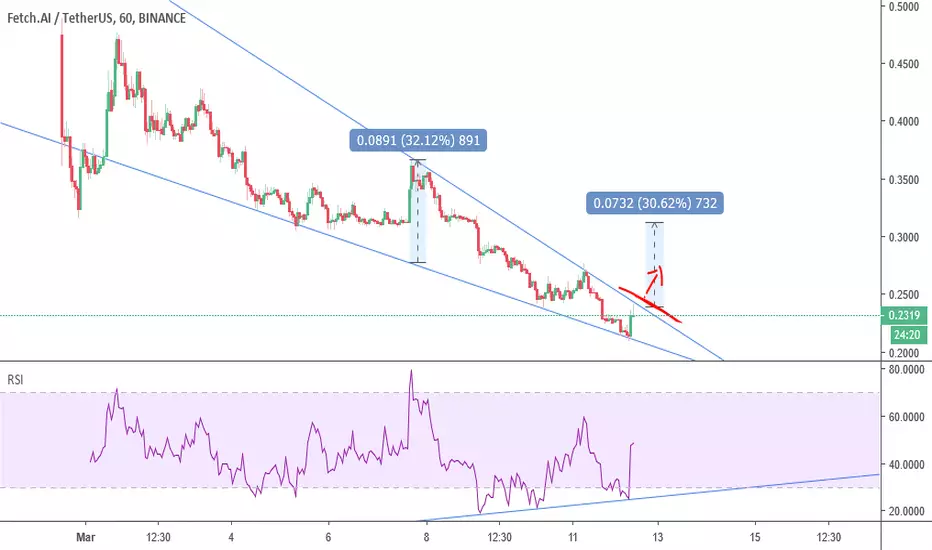
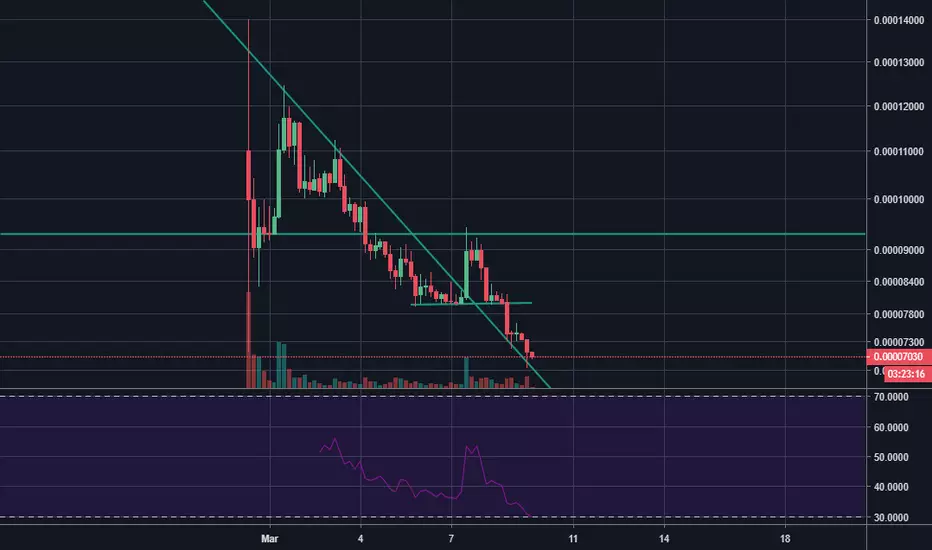
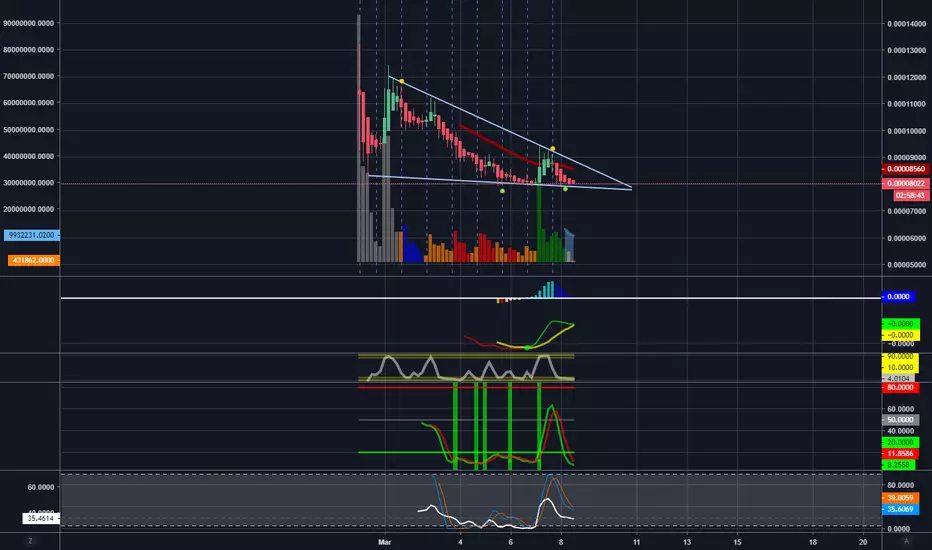
Falling wedge trying to break.
Volume slighty increasing
UCTS buy signal around ~6520sats
RSI rising from oversold levels
MACD rising
Since this is a new asset most of the indicators that I usually check for a trade are not available yet. Proceed with caution.

fet/usdt falling wedge .rsi is acting as a support. **buy only after breaking the resistance.** stoploss under the last fractal or rsi support.
FET exit scam (read description)ok guys so this is not a TA. im publishing this just to share my opinion about this shitcoin.
Remember when XVG developers said they will announce the biggest partnership in crypto history? and it turn out to be just a useless partnership with adult websites? This is the same. In FETCH telegram group admins kept saying they will announce BIG NEWS this week. Lets take a look at those BIG NEWS:
1- Kucoin listing. Kucoin is not a shit exchange but its a minor one. Currently #70 on CMC.
2- 1 week of hard work (so they say) and all they did was releasing a useless wallet. Isn't this an ERC-20 token? If i already have my own ether wallet why i would need to use your useless software to keep my tokens in?
And the most important thing to take a look at this project is the lie in the white paper. As they say, those private sale tokens should be locked for 3 months. But they are being distributed right now (telegram group admin confirmed) and getting dumped by investors every day.
If you dont want to get BOGGED, dont buy this coin. But this is just my opinion and not a financial advice. DYOR

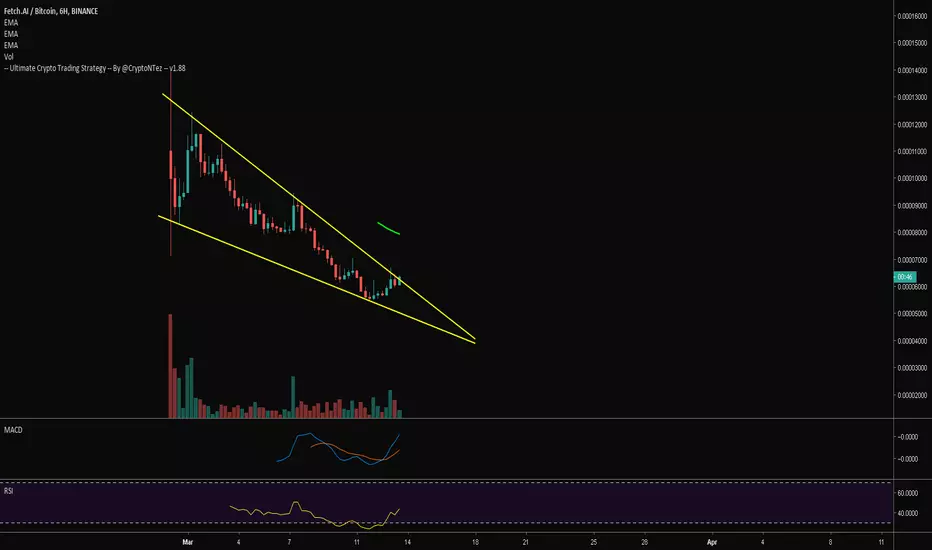
My chart on FET/BTCI did this chart some days ago before the breakout and it was rejected, followed by the dump
Like and follow
BINANCE:FETBTC
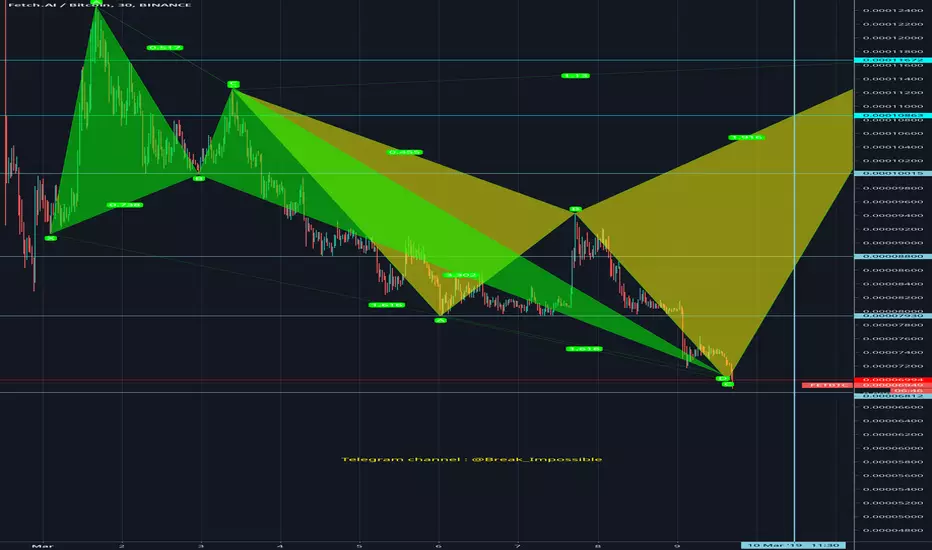
Fet analysis Fet analysis update
We can buy some of fet from from the current price to 6812~6994 and the target is
7930~8800~10015~10863~11672
Second analysis for fet that show we can rise from the lower trend to the given target and make the stop loss Break the lower trend and close below it
Third analysis for fet that shown now form an inverse head and shoulders and now in the formation of the head level
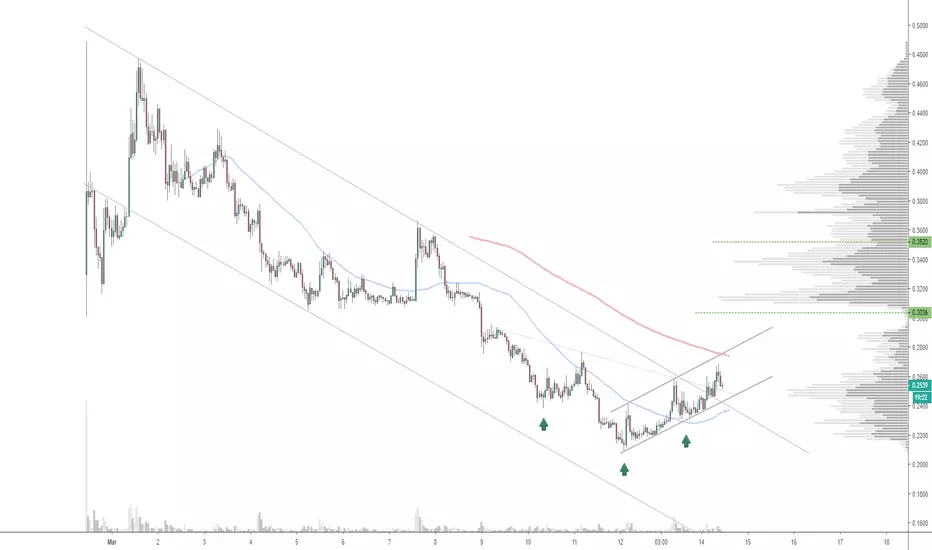
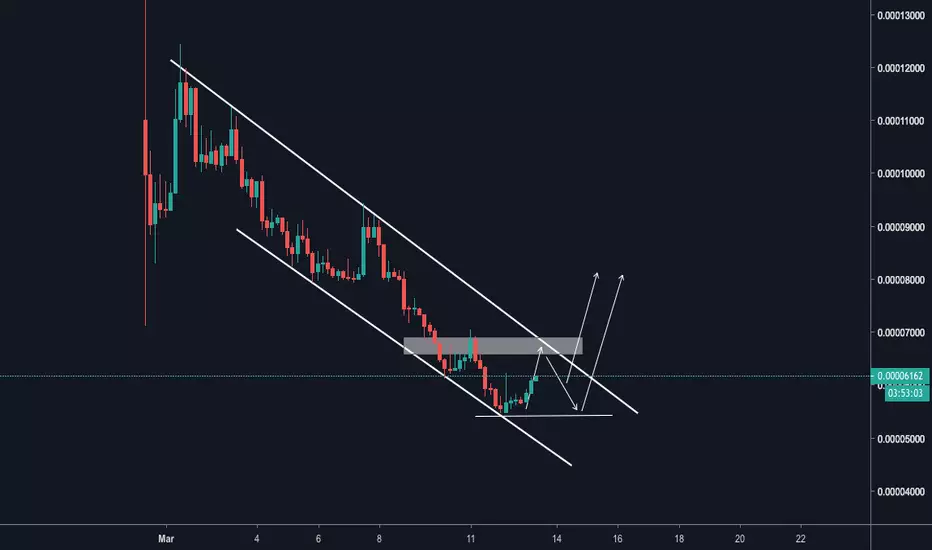
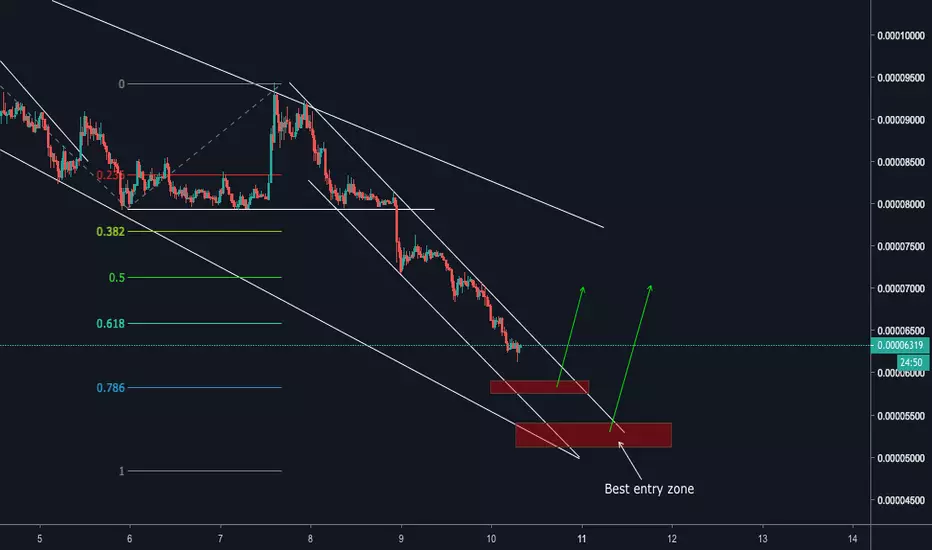
FET breakout from wedge, retesting level, buying zone!Morning fellow traders!
So far, FET have been flagging out of the falling wedge, before the sudden 20% spike we saw yesterday. This spike quickly got sold off again, and we're back to retest the level for the third time. This is a LOW RISK trade. You'd want to enter within the green zone, and place your SL at/below the red line. If we break the red line, we are likely to retest the lowest point on the chart, which is from the listing-day. The black lines are representing different levels you'd expect FET to respect if we break up from here again.
I want to get this chart out as quickly as possible, so I'm cutting it here!
If you like it and would like to receive future updates - Please, follow me on TradingView!
If you follow me, I guarantee you will receive timely updates to this chart, and all other interesting tickers. This will allow you to stay on top of the current Fetch.ai trend and hopefully maximize your profits!
If you agree, please, Like this Idea - This would be the best feedback and encouragement for me!

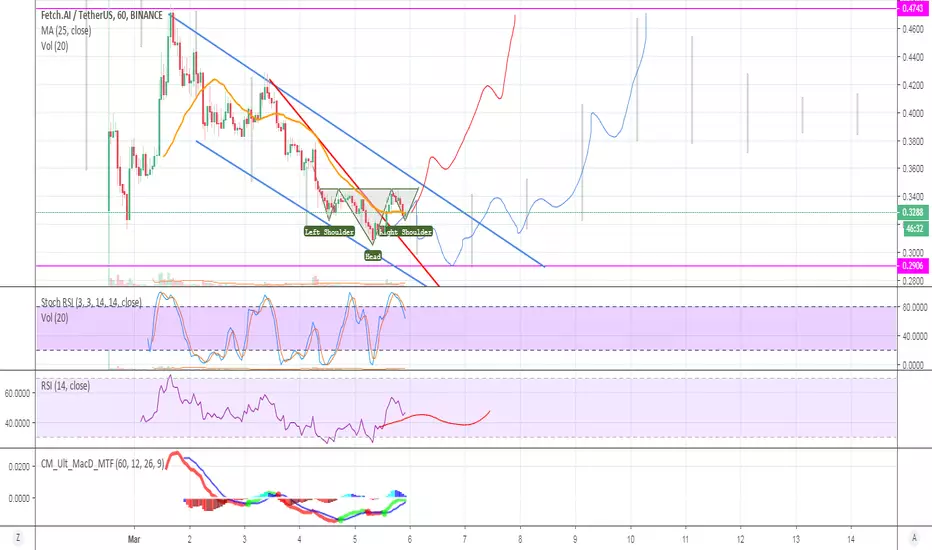
FET Descending WedgeFET was just released and has been extremely volatile. It's currently moving in a descending wedge, some sort of action should occur, could be up or down.
We just hit a short term double bottom at 8000 sat and also the bottom of the wedge, I'd buy in now at 8000-8100 sat and put a stop loss at 7900 sat. Low risk, high reward.
This is not financial advice. Proceed at your own discretion.
FET/BTC getting ready to retest previous high. Bullish!Double bottom formed on the 4H. We have a retest of former resistance line with bullish RSI.
If you havn't entered yet wait for higher low on 15 min or 1H before entering.
TP1: 0.000105