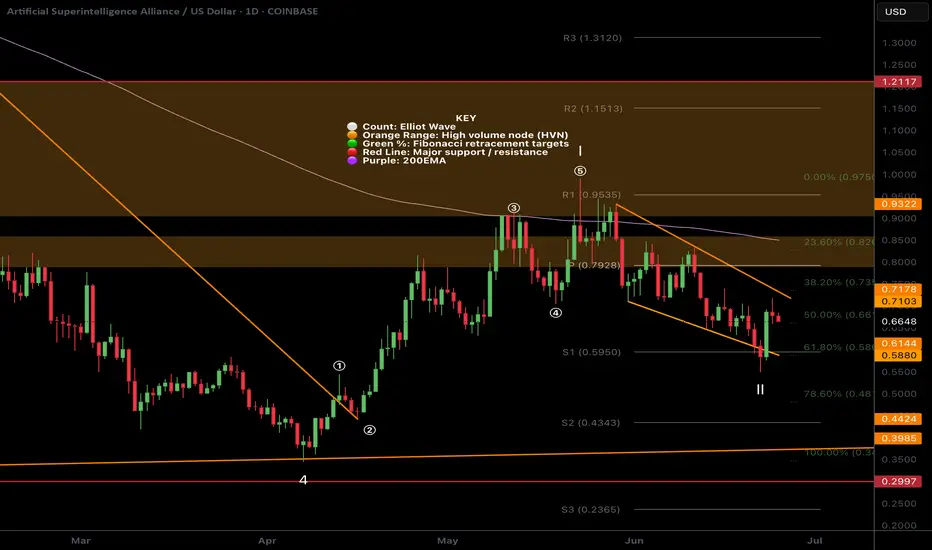
$FET local ending Diagonal and wave 2 near completion?NYSE:FET was rejected for the 4th time at the daily 200EMA! Each time the probability of a breakout increases.
I have adjusted the High Volume Nodes for accuracy.
Locally Fetch appears to have completed a motif wave up with an ending diagonal for wave 5. Wave 2 is expected to find support at the daily pivot and .618 Fibonacci retracement before attempting a breakout of the daily 200EMA once more.
A move below wave II will invalidate this analysis.
Safe trading
Fetusd
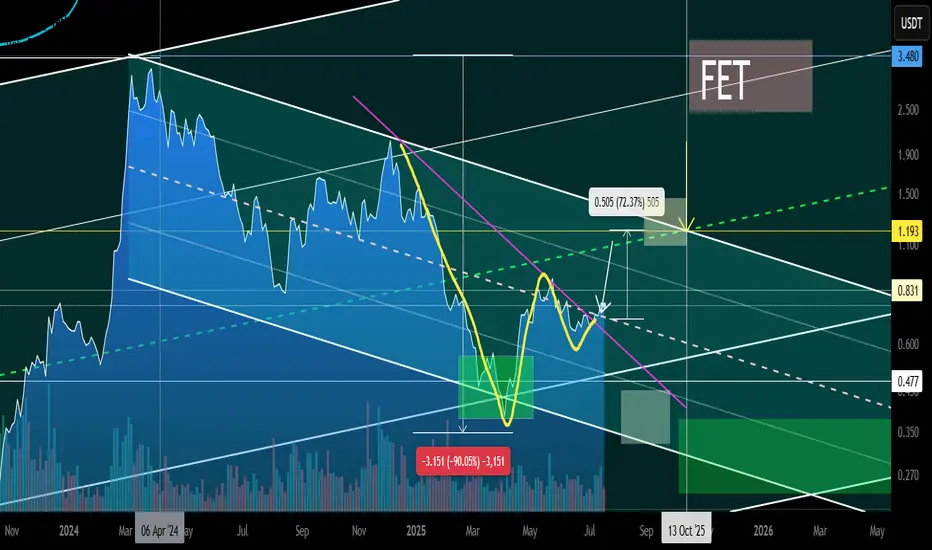
FET Secondary trend 19 07 2025Logarithm. Time frame 1 week for clarity.
Main trend is an ascending channel.
Secondary trend is a descending channel
Local trend is a Ross hook, at the median resistance. Reversal zone.
By the way, the trading idea from 2022 FET/BTC is still relevant. Pay attention to where the price is.
FET/BTC Main trend. Pump zone cycles . 2022 06
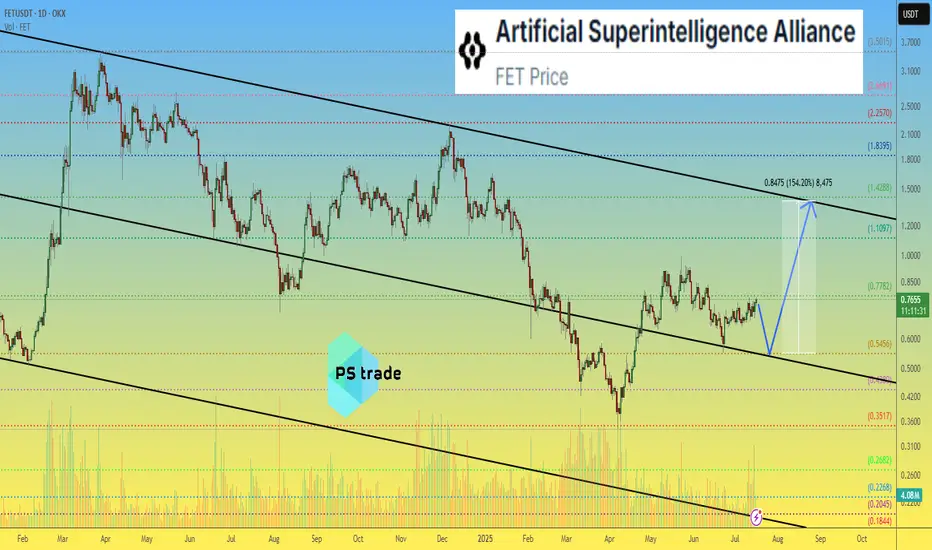
Artificial Superintelligence Alliance - FET price analysis📈 It looks like the price of the combined and updated #FET is trying to consolidate at the top of the channel.
All that remains is to wait for confirmation, i.e., for the OKX:FETUSDT price to stay above $0.55 in the coming days/weeks.
🤖 And then the #ArtificialSuperintelligenceAlliance token (the name is more complicated than the stop word from the movie “Eurotrip” — "hello olds" :) can be purchased for an investment portfolio with a growth potential of at least +150%.
_____________________
Did you like our analysis? Leave a comment, like, and follow to get more
$FET Does Zooming out look better?NYSE:FET has been underperforming lately and the local chart looks trash so I wanted to zoom out to give us all some context on the larger picture which hasn't really changed.
Price appears to have completed wave II at the High Volume Node (HVN) support and 0.5- 0.618 'Golden Pocket' Fibonacci retracement and wave 3 is underway but finding local resistance.
Pivots are warped due to the strength of the move last year so wouldn't count them as reliable so focusing on support and resistance. The megaphone pattern is clear and the next area of resistance when FET starts moving is the $1.2
Weekly RSI is decreasing and is attempting to cross bearishly. If Bitcoin has a significant pullback I would expect new lows for FET at this rate. I have a neutral stance at this point.
Analysis is invalidated below $0.546
Safe trading
FET – HTF Setup Primed for ExpansionFET is looking strong here from a high time frame perspective — currently sitting around $0.739, well into the discount zone of the macro trend channel.
We’ve got:
✅ Price holding monthly demand
✅ A clear swing higher low forming on the weekly and 3W
✅ Already seen the first expansion leg out of demand
✅ Now potentially loading the next move higher
Zooming out, price is still trading below the midline of the long-term uptrend channel — and a move back to the upper boundary puts targets in the $6 region, aligned with a new higher high.
📈 HTF Structure
Midline rejection flipped support
Demand tested and respected
HL printed after clean retest
370% upside just to retest the prior HH at $3.50
HTF trend structure still fully intact
This setup is also supported by the broader HTF bullish bias across BTC, ETH, and majors, which adds confluence to a potential larger expansion phase for alts — especially strong narratives like AI.
🎯 Targets
🎯 $3.50 = prior high
🎯 $6.00+ = upper channel target / next HTF extension zone
From current levels, risk/reward looks very clean.
1W:
3W:
3M:

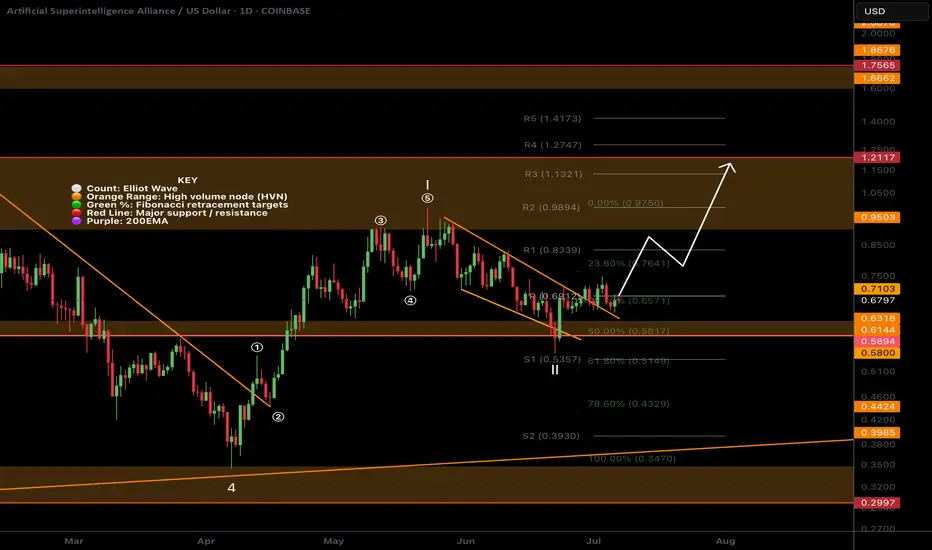
$FET Ready for the next move up?NYSE:FET looks ready for the next move up with a similar analysis to many other alts I have shared.
It is breaking out of descending resistance after testing the .618 Fibonacci retracement and High Volume Node (HVN) as support. Price broke above the daily pivot and is now swinging below, a recovery above the local swing high will be a bullish signal to go long with a wave 3 target of the R3 daily pivot and major resistance HVN at $1.13.
Analysis is invalidated below $0.54
Safe trading
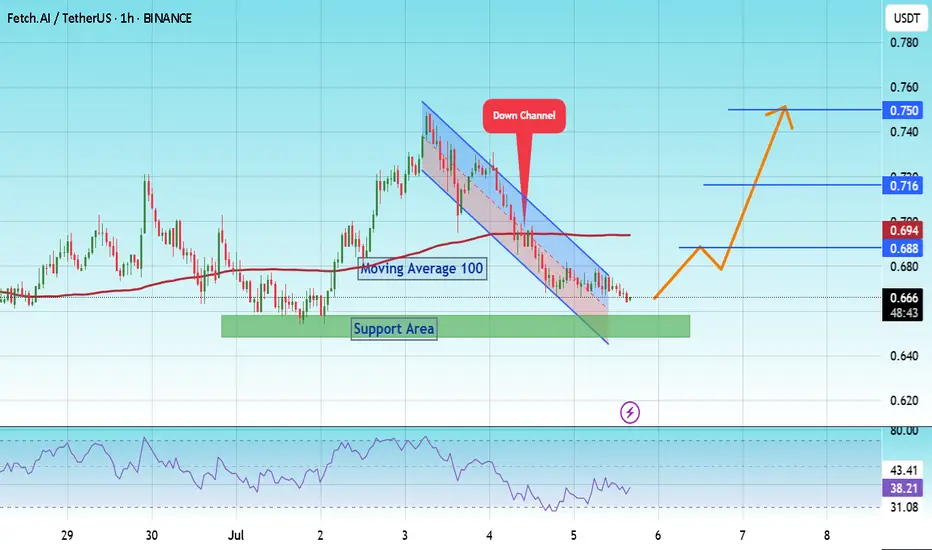
#FET/USDT Preparing for a Major Rally ?#FET
The price is moving within a descending channel on the 1-hour frame and is expected to break and continue upward.
We have a trend to stabilize above the 100 moving average once again.
We have a downtrend on the RSI indicator that supports the upward break.
We have a support area at the lower boundary of the channel at 0.655, acting as strong support from which the price can rebound.
We have a major support area in green that pushed the price upward at 0.650.
Entry price: 0.665
First target: 0.688
Second target: 0.716
Third target: 0.750
To manage risk, don't forget stop loss and capital management.
When you reach the first target, save some profits and then change the stop order to an entry order.
For inquiries, please comment.
Thank you.
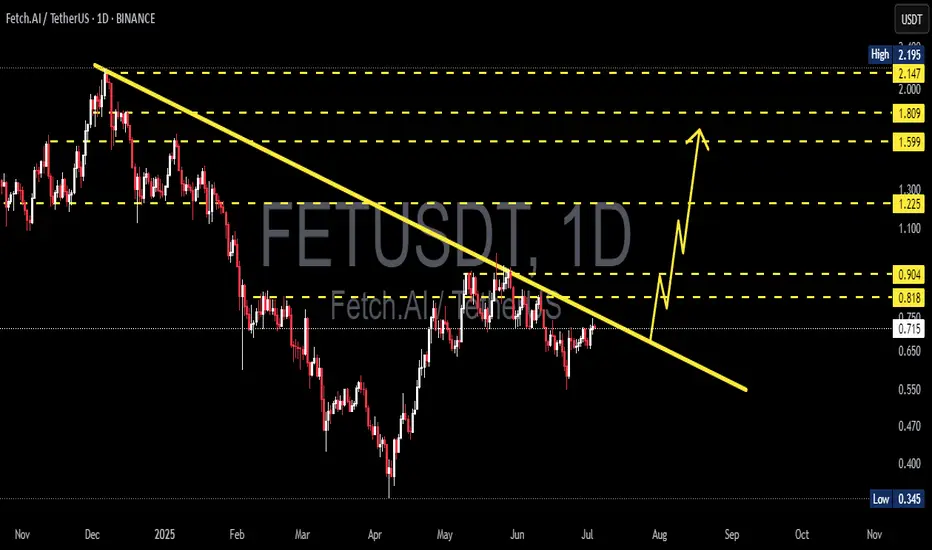
FET/USDT Breakout Imminent? Preparing for a Major Rally!
🧠 Key Pattern: Descending Trendline Breakout
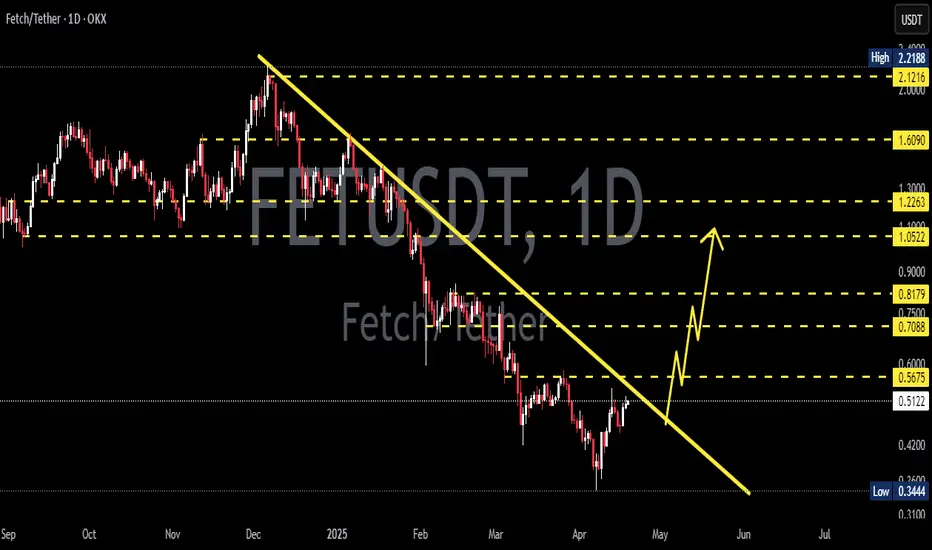
On the daily chart (1D), FET/USDT (Fetch.AI) has been consolidating under a strong descending trendline since its late 2024 highs. Currently, price action is coiling tightly just below this resistance, signaling a potential explosive breakout.
The price is trading near $0.72, right below the trendline — is this the calm before a major move?
🔍 Technical Analysis Overview
📉 Previous Downtrend Structure:
After peaking above $2, FET underwent a prolonged correction phase marked by lower highs and lower lows.
Sellers dominated for months, but the momentum is now shifting.
📈 Current Setup:
FET is forming a series of higher lows since March — an early sign of bullish reversal.
Volume is showing slight increases, which often precedes breakout attempts.
✅ Bullish Scenario (Breakout Rally)
If the price breaks and closes above the descending trendline (~$0.75–$0.78):
1. Initial Resistance: $0.818 → minor overhead supply zone.
2. Confirmation Level: $0.904 → breakout validation zone.
3. Major Upside Targets:
$1.225 → psychological resistance & previous consolidation level.
$1.599 & $1.809 → Fibonacci extension targets from prior impulse.
$2.147 – $2.195 → potential retest of the previous high.
📌 Upside Potential: Over +150%, if breakout is confirmed with strong volume and sustained momentum.
❌ Bearish Scenario (Rejection & Pullback)
If the price gets rejected from the trendline:
Possible pullback to $0.65, the recent higher low support.
Breakdown below this could extend the move toward $0.55 or even $0.47.
Major support: $0.345 → long-term demand zone.
📉 A failed breakout (fakeout) is possible if volume does not support the move.
📊 Trading Strategy Suggestions:
Breakout Entry: Above $0.78 with stop-loss below $0.70.
Retest Entry: Wait for a pullback to confirm support at the trendline after breakout.
Volume Confirmation is Critical — avoid chasing without strong bullish candles.
🧠 Narrative Bonus:
Fetch.AI remains one of the top AI-related projects in the crypto space. As the AI narrative resurfaces, a technical breakout could align with renewed fundamental attention — creating the perfect storm for a rally.
📌 Conclusion:
FET/USDT is positioned at a highly critical technical and psychological level. A confirmed breakout could initiate a large bullish wave, while rejection could drag the price lower. Manage your risk wisely and watch for volume cues.
#FETUSDT #FetchAI #BreakoutSetup #CryptoTrading #AltcoinRally #TechnicalAnalysis #DescendingTrendline #CryptoSignals #AIcoins
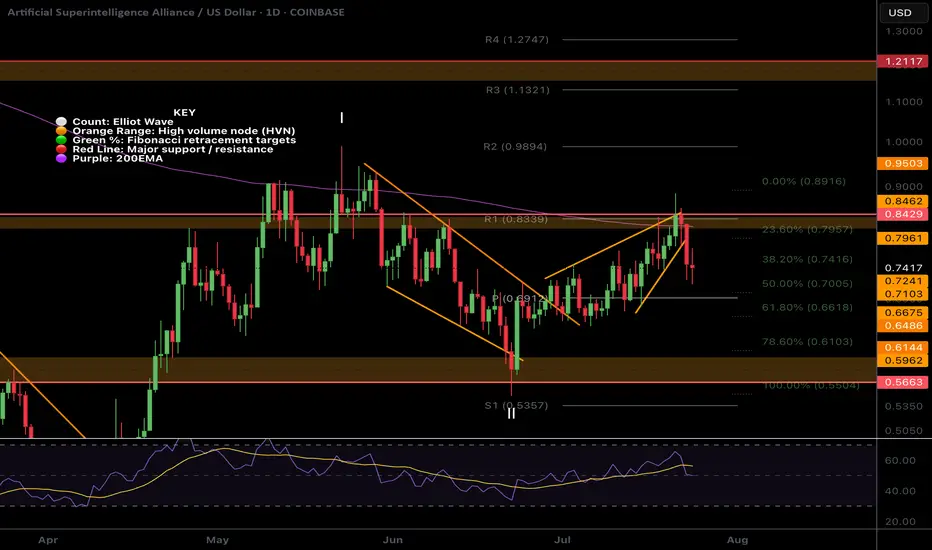
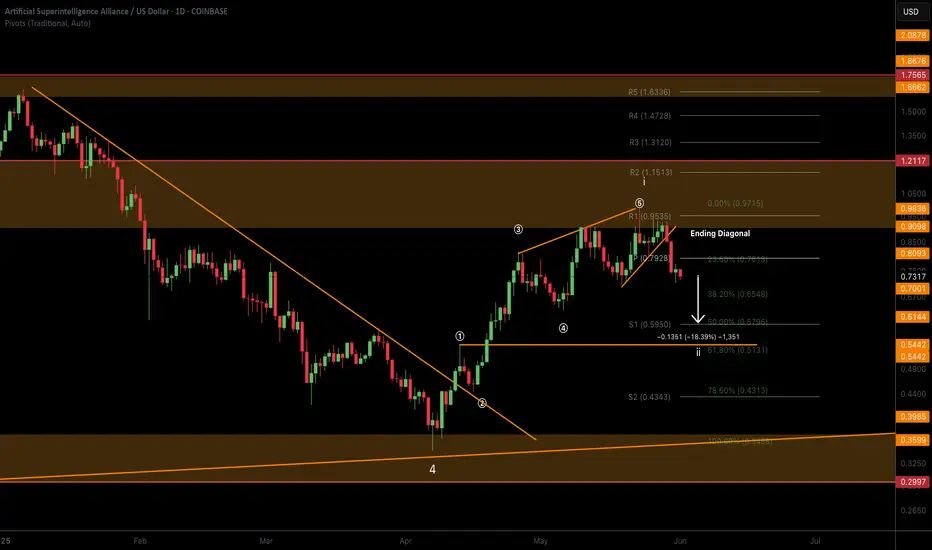
FET Wave 2 Complete?NYSE:FET (Fetch.ai) appears to have completed a wave 2 pullback and looks set for the next move up towards $1.1
Price swung below the bottom of the wedge, tested the S1 daily pivot and 61.8 Fibonacci golden pocket. It quickly recovered with a bullish engulfing daily candle negating the 3 previous days bearish price action.
A close above the top wedge line and daily pivot will be the signal to go long again.
Analysis is invalidated below $0.54 and that will bring up a downside target of $0.34 which is the ascending macro support from June 2023.
Safe trading
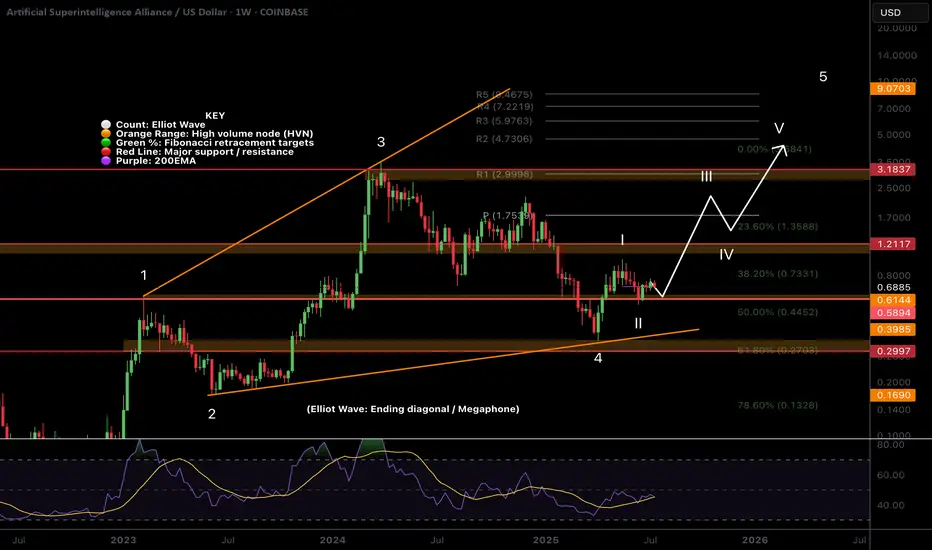
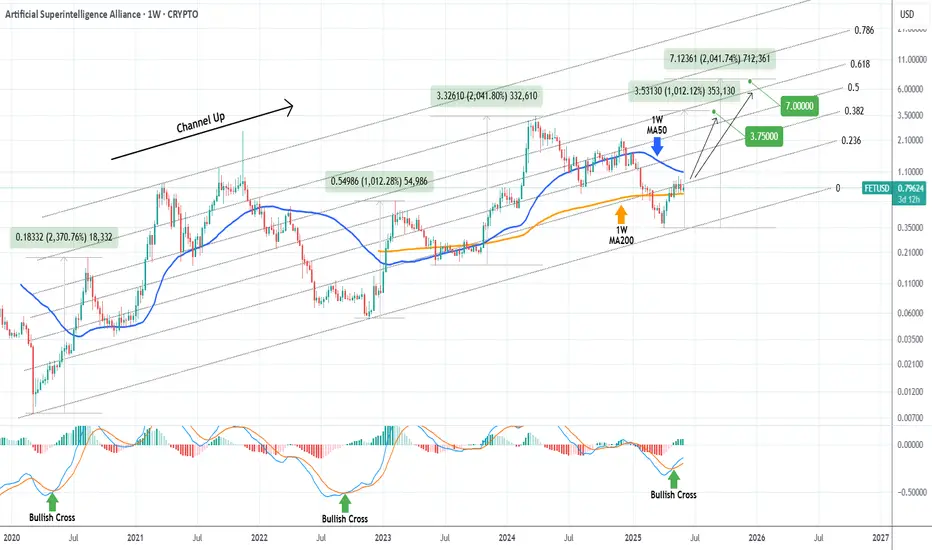
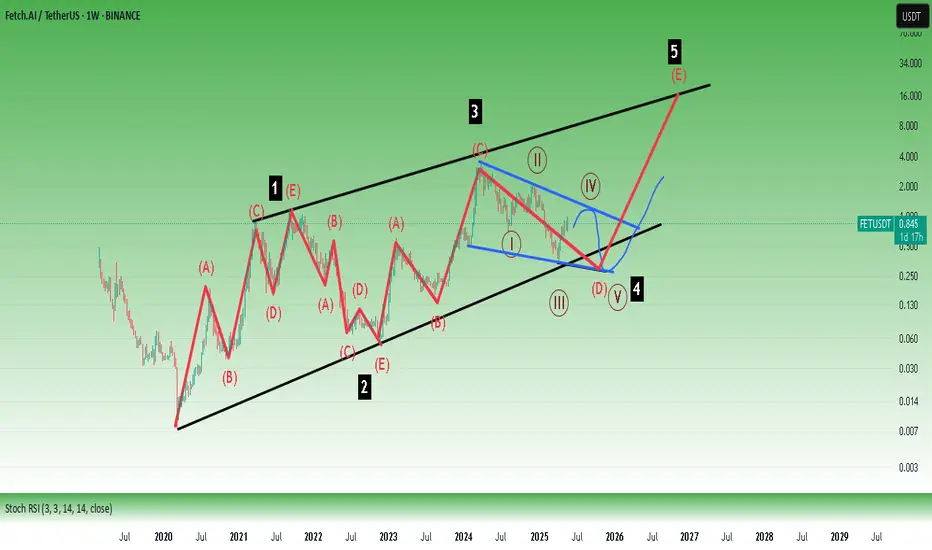
FETUSD is an excellent buy, targeting at least $3.75Artificial Superintelligence Alliance (FETUSD) or otherwise known as FETCH.AI has been trading within a multi-year Channel Up and right now is on its latest Bullish Leg and quite possibly the last for this Cycle.
Given that all similar Bullish Legs that started with 1W MACD Bullish Crosses that low, grew by at least +1012%, we expect a minimum Target for this Cycle at $3.75. If it follows the more aggressive +2041% rise of 2023/ 2024, we can even see $7.00 but that is the more optimistic scenario.
-------------------------------------------------------------------------------
** Please LIKE 👍, FOLLOW ✅, SHARE 🙌 and COMMENT ✍ if you enjoy this idea! Also share your ideas and charts in the comments section below! This is best way to keep it relevant, support us, keep the content here free and allow the idea to reach as many people as possible. **
-------------------------------------------------------------------------------
💸💸💸💸💸💸
👇 👇 👇 👇 👇 👇
Fet (Daily) Elliot Wave ii underway after ending diagonalFetch appears to have completed a motif wave (1) with an ending diagonal after finding a bottom at the major support high volume node (HVN) macro wave 4.
Wave 2 has not retraced as deep as other alt coins showing strength in the move up. The downside target is just above the wave (1) swing high, the 0.618 Fibonacci Retracement.
Wave 3 should be a powerful move up taking price into all time high.
Failure to hold this support could see price heading back to fresh lows and testing the $0.35 HVN once more.
Safe trading
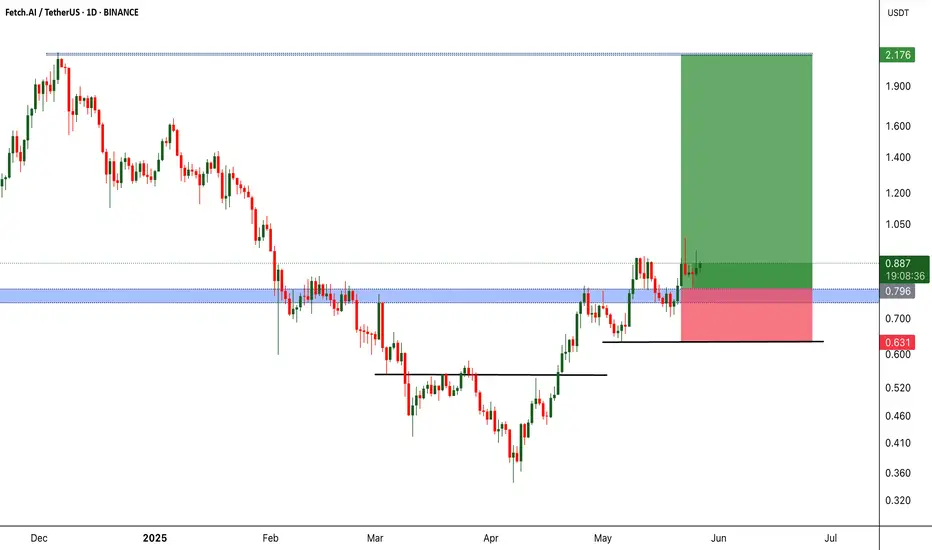
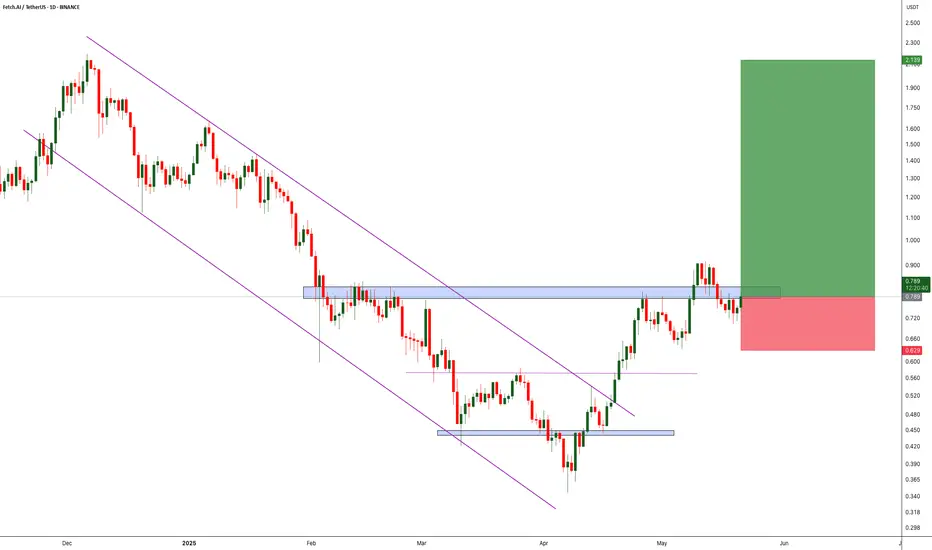
FETUSDT Major Resistance Cracked, Eyes on Sky!BINANCE:FETUSDT has recently broken out from a significant resistance level that previously acted as a strong barrier. After this breakout, the price action displayed a textbook retest of the former resistance—now turned support which held firm, confirming the bullish move.
This successful retracement signals strength in the current uptrend and opens the door for potential continuation towards higher highs. The market structure is showing signs of higher lows and increasing momentum, which could fuel a strong rally in the near term.
While the setup looks promising, it’s essential to emphasize risk management. Always use a stop-loss to protect your capital and manage your position sizing according to your trading plan. The crypto market can be volatile, and smart risk control separates long-term winners from short-term chasers.
All eyes are now on NYSE:FET for its next move. If momentum continues, we could witness a significant upward leg. Stay sharp and let the trend be your guide!
BINANCE:FETUSDT Currently trading at $0.88
Buy level : Above $0.8
Stop loss : Below $0.63
Target 1: $1.1
Target 2: $1.4
Target 3: $2.1
Max leverage 3x
Always keep stop loss
Follow Our Tradingview Account for More Technical Analysis Updates, | Like, Share and Comment Your thoughts
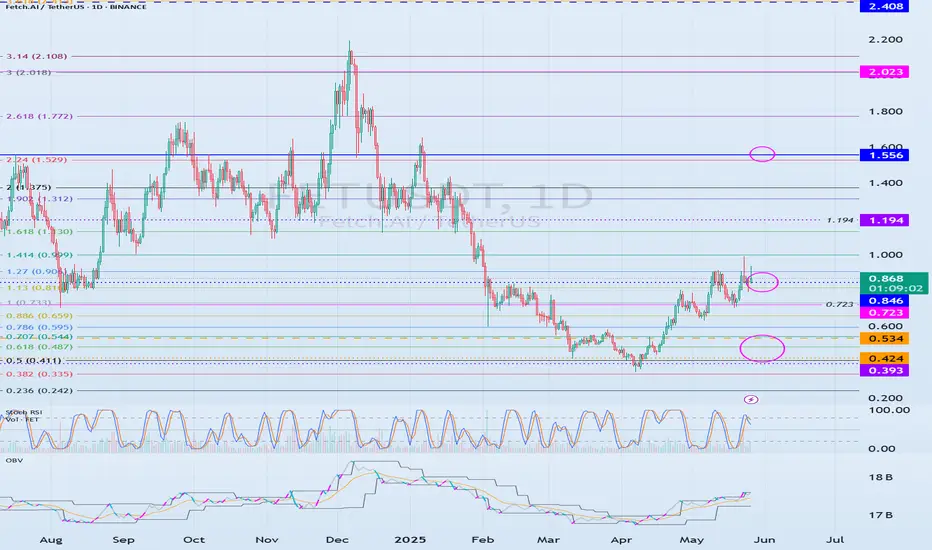
The key is whether it can find support near 0.846 and rise
Hello, traders.
If you "Follow", you can always get new information quickly.
Have a nice day today.
-------------------------------------
(FETUSDT 1D chart)
The M-Signal indicator on the 1M chart is abnormal, so the key is whether it can hold the price.
If the price is maintained above the M-Signal indicator on the 1M chart, it is highly likely that the upward trend will continue in the medium to long term.
Accordingly, we should check whether it can be supported and rise around 0.846.
If it fails to rise, the support range is expected to be around 0.424-0.534.
-
When the rise begins,
1st: 1.194
2nd: 1.556
Responses are required depending on whether there is support around the 1st and 2nd above.
The 1.194 point corresponds to the support and resistance range in the candle arrangement.
-
Thank you for reading to the end.
I hope you have a successful transaction.
--------------------------------------------------
- This is an explanation of the big picture.
(3-year bull market, 1-year bear market pattern)
I will explain more details when the bear market starts.
------------------------------------------------------
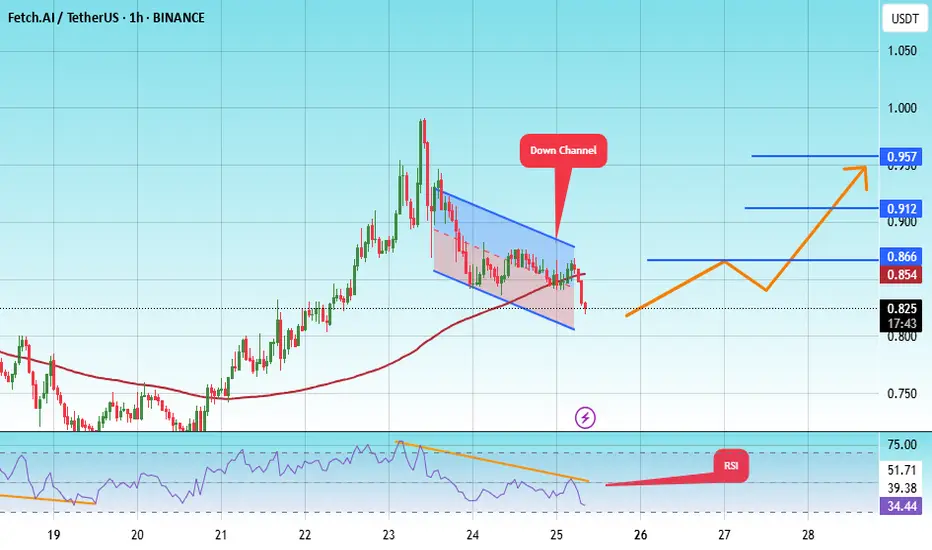
#FET/USDT#FET
The price is moving within a descending channel on the 1-hour frame, adhering well to it, and is heading for a strong breakout and retest.
We are seeing a bounce from the lower boundary of the descending channel, which is support at 0.814.
We have a downtrend on the RSI indicator that is about to be broken and retested, supporting the upward trend.
We are looking for stability above the 100 moving average.
Entry price: 0.823
First target: 0.866
Second target: 0.912
Third target: 0.957
FET ROADMAPTo me the view is pretty clear.
* The purpose of my graphic drawings is purely educational.
* What i write here is not an investment advice. Please do your own research before investing in any asset.
* Never take my personal opinions as investment advice, you may lose your money.
Eyes on FET – The Calm Before the Bullish Storm?BINANCE:FETUSDT previously broke out of a clean descending channel, flipping the trend and shifting into a bullish structure. Since the breakout, the price has been forming consistent higher highs and higher lows — a clear sign of growing momentum. Right now, it’s testing a local resistance zone. A strong breakout above this level could trigger a significant move to the upside, potentially setting the stage for a new bullish leg. Keep an eye on volume confirmation and price action at the resistance.
As always, manage your risk carefully — smart stop loss placement is key in volatile markets. Let the trend be your friend, but don’t forget your seatbelt!
BINANCE:FETUSDT Currently trading at $0.8
Buy level : Above $0.8
Stop loss : Below $0.63
Target : $2.1
Max leverage 3x
Always keep stop loss
Follow Our Tradingview Account for More Technical Analysis Updates, | Like, Share and Comment Your thoughts
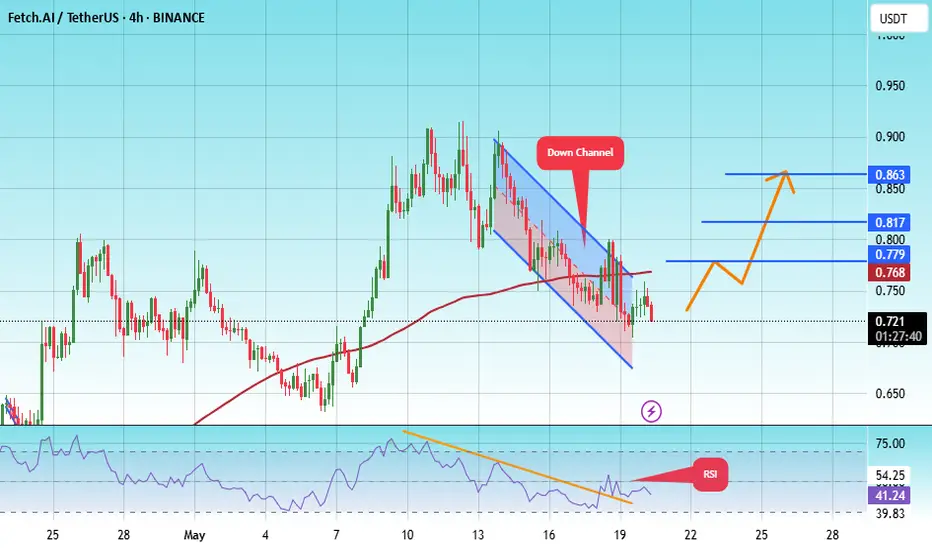
#FET/USDT#FET
The price is moving within a descending channel on the 1-hour frame, adhering well to it, and is heading for a strong breakout and retest.
We are experiencing a rebound from the lower boundary of the descending channel, which is support at 0.696.
We are experiencing a downtrend on the RSI indicator, which is about to break and retest, supporting the upward trend.
We are looking for stability above the 100 Moving Average.
Entry price: 0.721
First target: 0.779
Second target: 0.817
Third target: 0.863
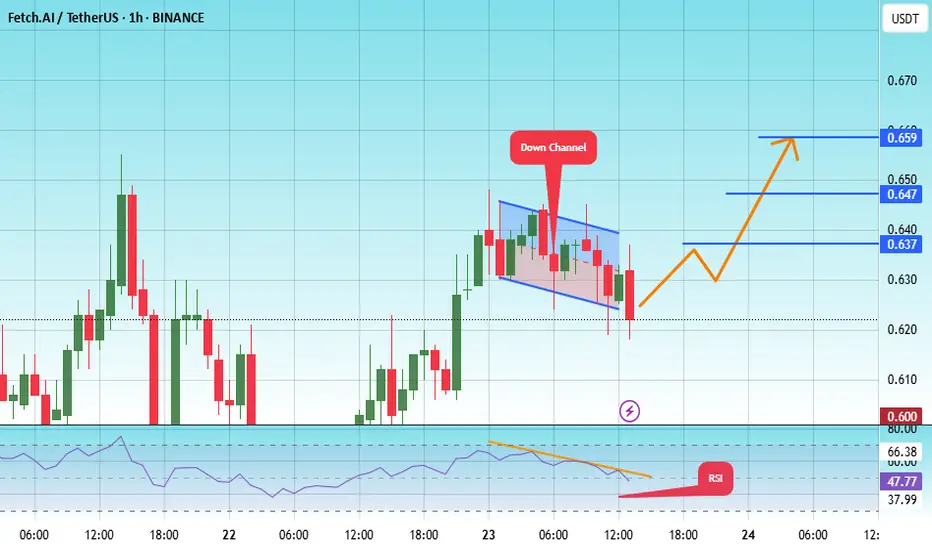
#FET/USDT#FET
The price is moving within a descending channel on the 1-hour frame, adhering well to it, and is heading for a strong breakout and retest.
We are experiencing a rebound from the lower boundary of the descending channel, which is support at 620.
We are experiencing a downtrend on the RSI indicator, which is about to break and retest, supporting the upward trend.
We are looking for stability above the 100 moving average.
Entry price: 0.625
First target: 0.659
Second target: 0.647
Third target: 0.659
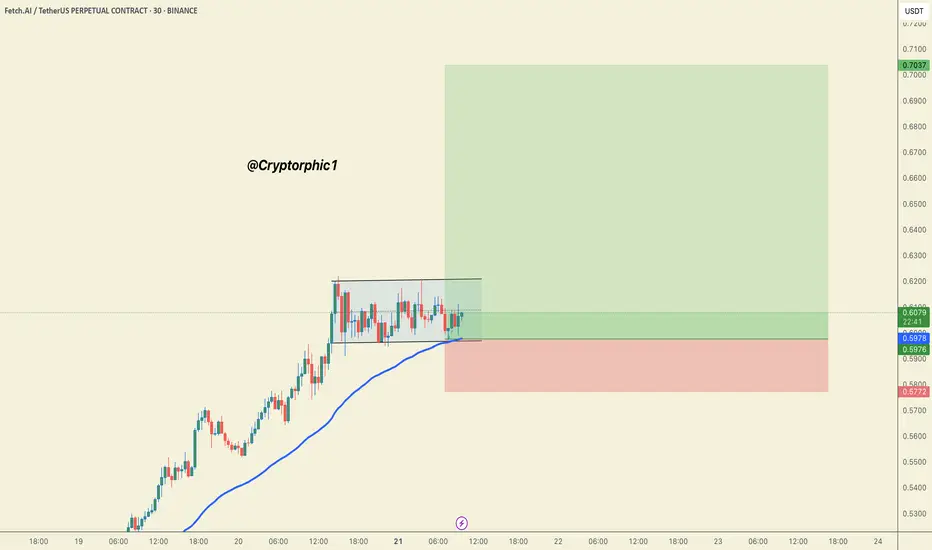
#FET/USDT Futures Trade Setup!#FET looks good if you missed.
Two options to enter:
1. You can accumulate .5869 to .6080
2. Wait for the US Open and buy at CMP with confirmations.
Targets : .6377 .6522, .6755, .6838 and .7021
SL .5772
Dyor, NFA
Do hit the like button if you want me to post more setups like this.
Thank you
#PEACE
FETUSDT 1D AnalysisFET ~ 1D Analysis
#FET Buy after successfully penetrating this resistant line with a short -term target of at least 10%+ from here.
#FET/USDT#FET
The price is moving within a descending channel on the 1-hour frame, adhering well to it, and is heading for a strong breakout and retest.
We are seeing a bounce from the lower boundary of the descending channel, which is support at 0.477.
We have a downtrend on the RSI indicator that is about to be broken and retested, supporting the upward trend.
We are looking for stability above the 100 moving average.
Entry price: 0.500
First target: 0.513
Second target: 0.529
Third target: 0.550

FETUSDT at Key Support with Bullish Indicators!FETUSDT Technical analysis update
FET/USDT is currently trading at its major support zone. Key observations:
-The resistance from March 2022 and March 2023 is now acting as support.
-The daily chart's RSI has dropped below 30, indicating oversold conditions.
-A bullish MACD crossover has occurred below the histogram.
-A bullish divergence is visible in the RSI on the daily chart.

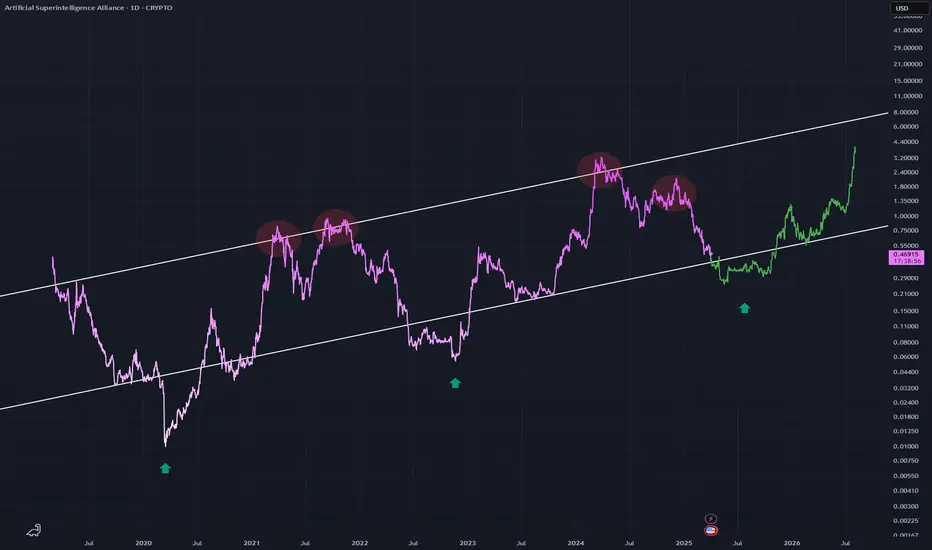
FETUSD - Recovery From a Double TopShowing my thoughts with the bars pattern tool in green
The red circles contain two double top patterns
I expect price to recover below the lower white line and then move back up into the channel following short term time below this white channel
Daily timeframe