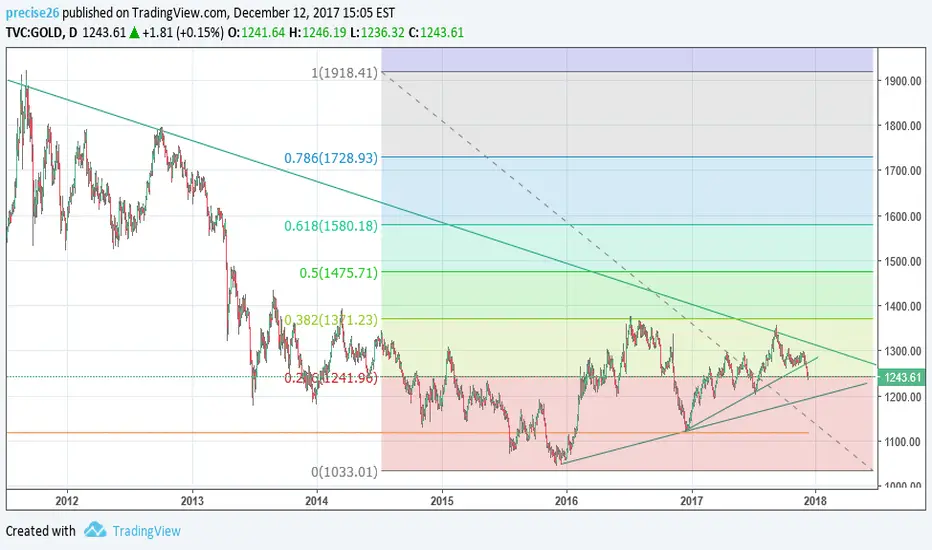
Indepth Gold AnalysisLets go deeper with this analysis for gold D1 time frame. Looking back we recently broke support and dropped to the first 38% fibo target. This fibo appears to have failed to hold and price started to make its way down to the next resistance line which only has two bounces. Naturally we will likely see a third.
The price action shows absolutely no indication that we will stop here and there doesn't appear to be any kind of resistance here.
PLEASE NOTE: "I dont have the indicators displayed on this chart. To see the full visual of the analysis go to www.precisiondigital.ca it is on the home page."
Looking at a full tool chest of indicators we can see much of the same thing:
The MFI so heading south, is below 50 and shows no sign of letting up. We will likely see a spike down with some price action if/when it hits the oversold mark.
The RSI has just hit oversold and generally speaking is still pointing down, although the very moment we see a little softness. Because of the MFI, I suspect the RSI will rise slightly and smash back through over sold territory. This will also cause some price action down.
The OSMA shows great strength for the bears and indicates that we are still very much heading downward. It is rising and well above the zero mark.
The RVI has recently broken support and is slightly below the 0.00 level. If it continues lower, this would indicate that the bear push has just begun.
The Stocastics is oversold and starting to turn up indication that the bull wave may be close. This means we might see some short term stalling until it turns back around. In conclusion I am fairly confident that we will be seeing some more bear movement, at least to the support level at approx. 1228.
With the indicators the way they are, we could easily pass that to hit one of our other support level targets at approx. 1210 and 1194.
Always remember to manage your risk properly and avoid chest pains. Try smaller lot sizes for a while, you just might like it. Good luck!
Fibo
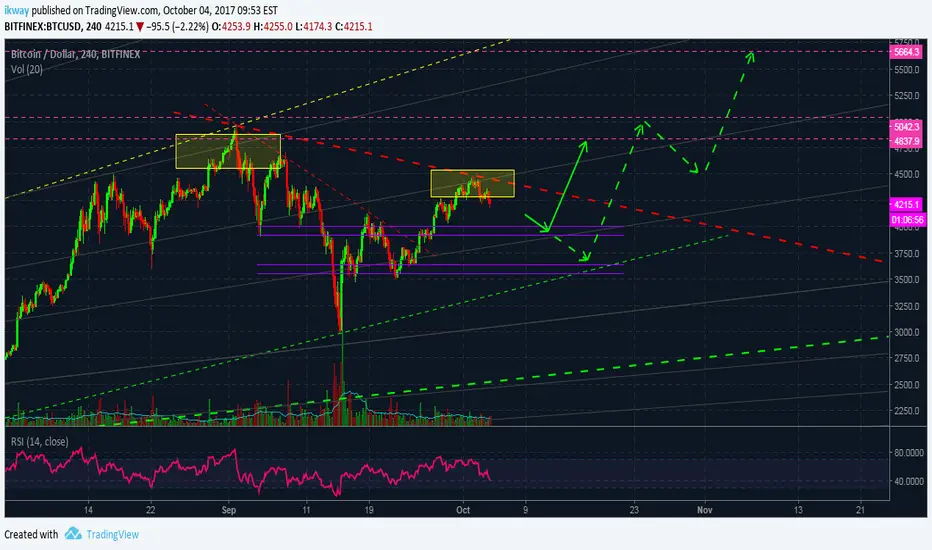
Updated Bitcoin Chart: 45% TradeREAD READ READ
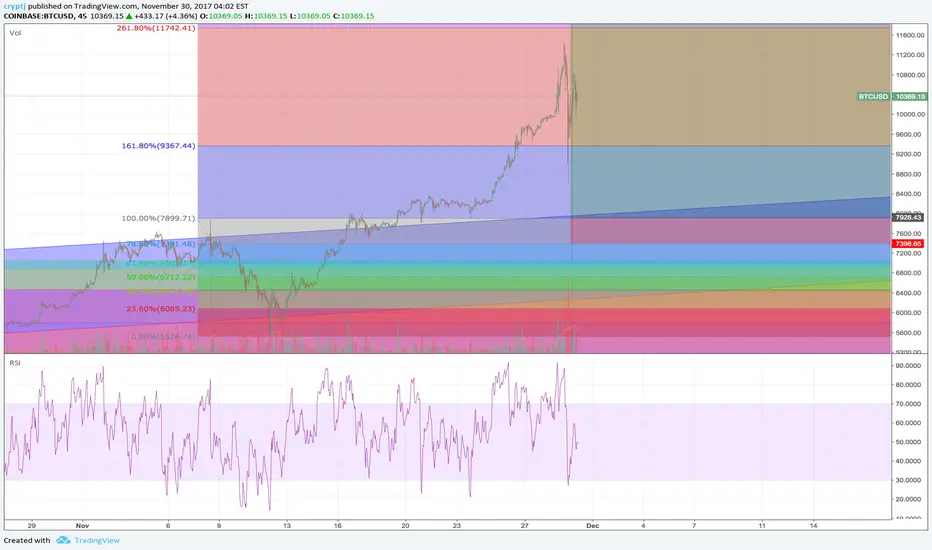
Here is my updated Bitcoin Chart: 45% Trade Opportunity Timeframe unkown
For those that have been with me on the previous trade, you have known that we shorted bitcoin near the 11,000 levels (chart was posted earlier, however). Currently still an active trade. I will close short at 9500 levels safely and watch the key levels between 9500-7860 keenly, and consider going long at 9300, and 7900 levels. I may use a weighted cost average between the two, depending on price movement at the given price.
Entry: 7860
Stop Loss: 7200
Target Profit: 13700
I believe the price will consolidate around the 9300 levels for a couple day timespan, and then continue dropping to our target entry points.
History has the potential to repeat itself and I would see this as a medium risk trade.
In the past, bitcoin had retraced from BTC High in June, and corrected itself in a full retracement to the near 3000 levels. After so, it continued to pass the Fibonacci going for 261.8% retracement levels. After, it had then dipped down to the 161.8% levels, and surely bouncing and rising yet again. As you guys can see, the fib retracement has been very accurate thus far.
Currently, following this trend, bitcoin had passed through a full retracement from 7800 levels previous to 5600 levels. Thus far, bitcoin had retraced and passed through the 161.8% and 261.8% retracement levels.
In conclusion, I see a potential buy opportunity on a bounce to the 161.8% fib level. We will watch closer as the price dials in to see if we can find more technical analysis.
Happy Trading to you all.
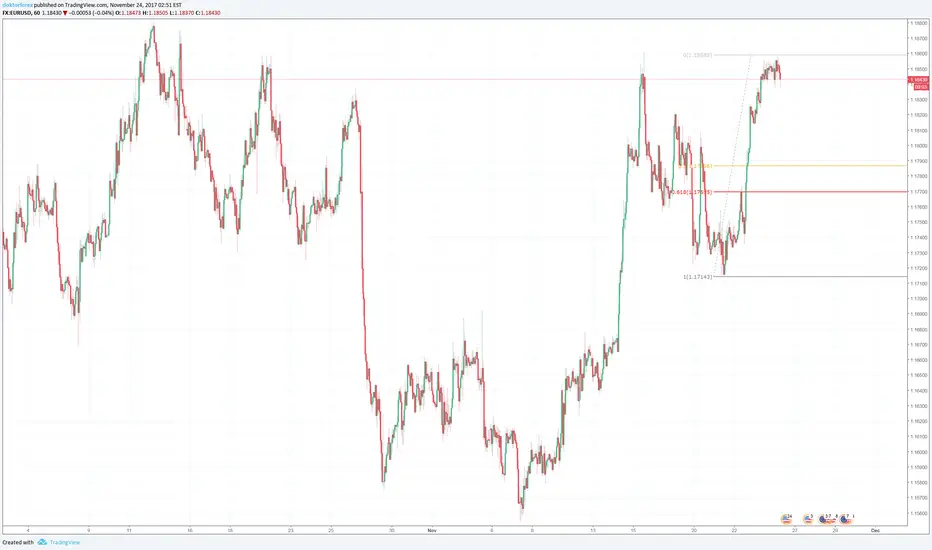
German IFO business index potential shortWill take a short entry on EURUSD if IFO business sentiment deviates by more than 1.5. Stop Loss 5 pips, Take Profit ~ 40 pips at the 1.1790 level.
Easiest Way to Draw Fibonacci LevelsMy entire trading strategy is built around how I draw and utilize Fibonacci levels. I use Fibonacci levels to determine precise entry, target, and stop loss placement in combination with other technical analysis methods. The biggest problem I see with a lot of traders is that they do not know how to draw Fibonacci levels properly. So I will show you my method and you will see that the market really seems to react to it. If you have any questions please post a comment below.
Step 1: Go to the Monthly timeframe and pick the previous month's fully formed candle. If the previous month's candle does not have a large body relative to the rest of the order flow, then it is perfectly acceptable to go back two months and pick that candle instead.
Step 2: If it is a Bullish candle draw your Fibonacci levels from the high of the candle to its low. If it is a Bearish candle draw your Fibonacci levels from the low of the candle to its high.
Step 3: Switch to a lower timeframe (daily chart and lower) and observe how price reacts to the Fibonacci levels as support / resistance
Step 4: The following month re-draw your Fibonacci levels if required
Tips:
1)On my charts I include the 1.272 and 1.414 levels as well as the 2.0 level. These are not automatically visible
2)You can also 'reverse' the levels (simply draw them in the opposite direction or use the reverse function in the Fibonacci tool's settings) if the current month's price action violates the 0 level. This does not happen often.
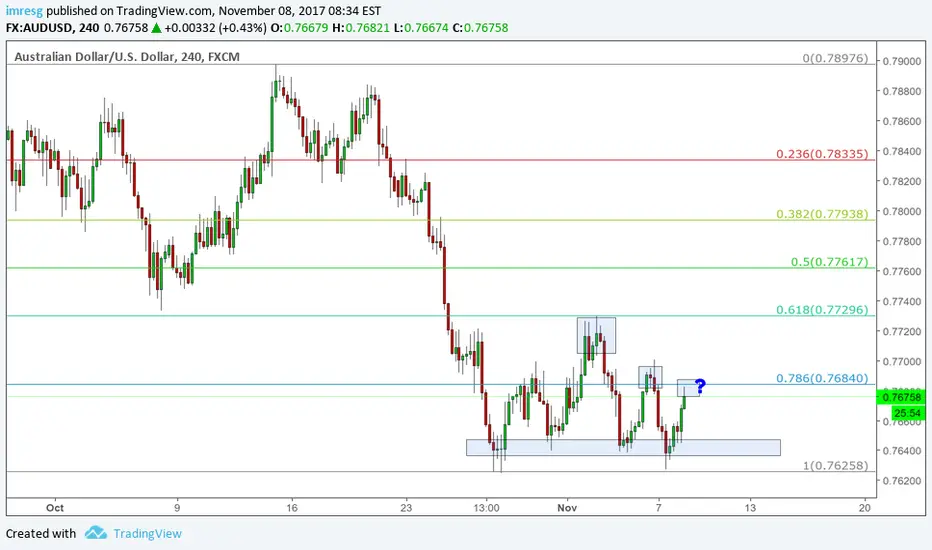
Example: AUDUSD. I have drawn the Fibonacci levels from the low to the high of the October Monthly Candle
Now look at the same Fibonacci levels on the Hourly Timeframe. I have highlighted clear rejections in November of Fibonacci levels that can be used as entry points and the elongated rectangle shows a clear demand region near the 1.00 level.

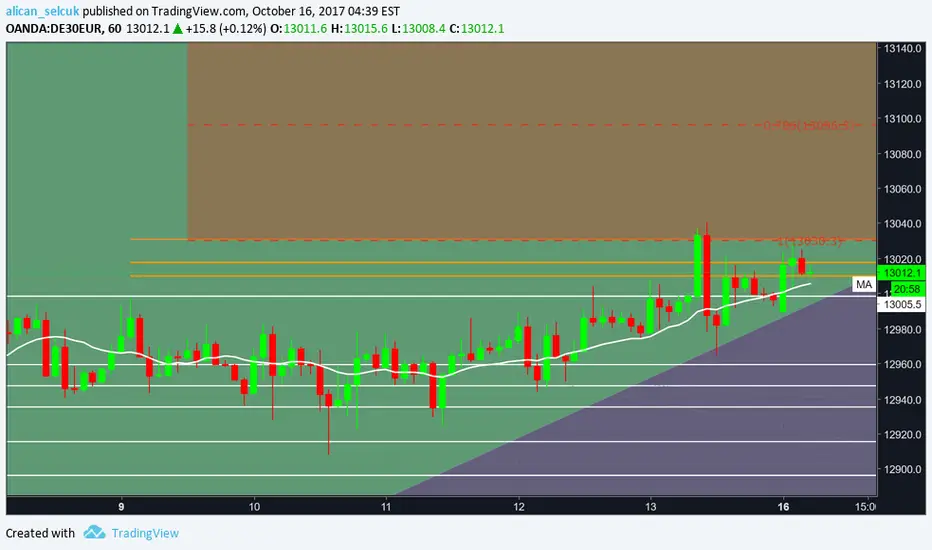
DAXEger fiyat 13.030'u gecer ve 13.030 ustunde kalicilik saglarsa ana hedef noktasina varana kadar turuncu olarak cizdigim fibo seviyeleri arasinda hizli hareket edip tirtikli fibo çizgilerinde yavaslayacaktir. Birincil ana hedef olan 13.330 da ise duzeltme dususu gelebilir, islemden cikip beklemek gerek.
___________________________________
If the price exceeds 13,030 and sustains above 13,030, it will move quickly between the fibo levels I draw in orange until it reaches the main target point(13.330) and slow down in the serrated fibo straps.
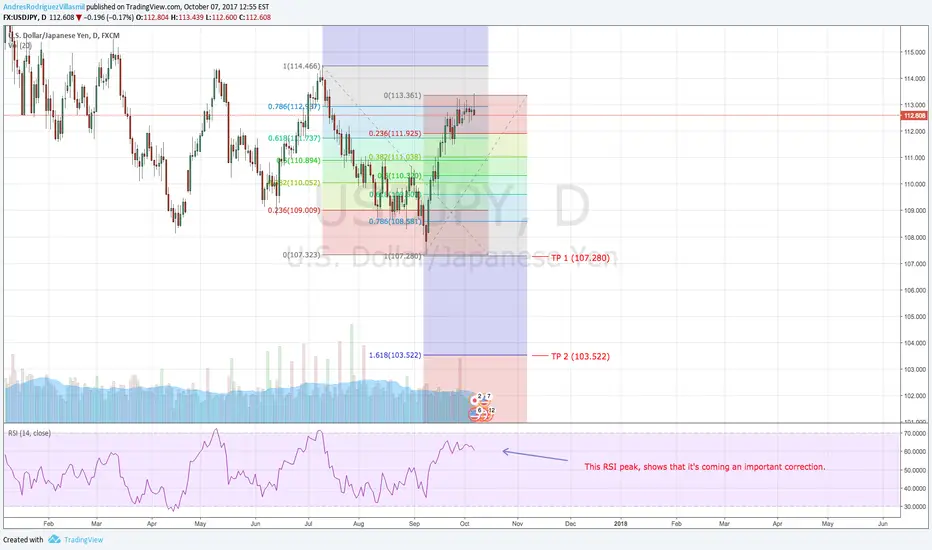
Bearish USD/JPY: An outlook for next 6-8 weeksWe can see right now at RSI that is accumulating to the overbought territory, the price is too high, reaching the level of a previous higher high which consequently produced a big sell-off turning down the price to 108 levels. So in this case, anytime soon we could see the opportunity to enter in a hard downtrend rally.
USDCAD short idea (H1/H4)Hello, All!
CAD FX:USDCAD has been continuously strengthening versus USD since May 2017.
The last major breakout of the previous support level of 1.233x occurred on 06 September.
After that, the pair was moving inside the ascending triangle which is most likely to be the accumulation phase prior to the next major move. If indicated point 5 is reached, it will also make Wolfe wave formation a reality and will provide an interesting opportunity to go short.
This setup was inspired by TomHall's original idea, many thanks for it!
GL and nice profits!

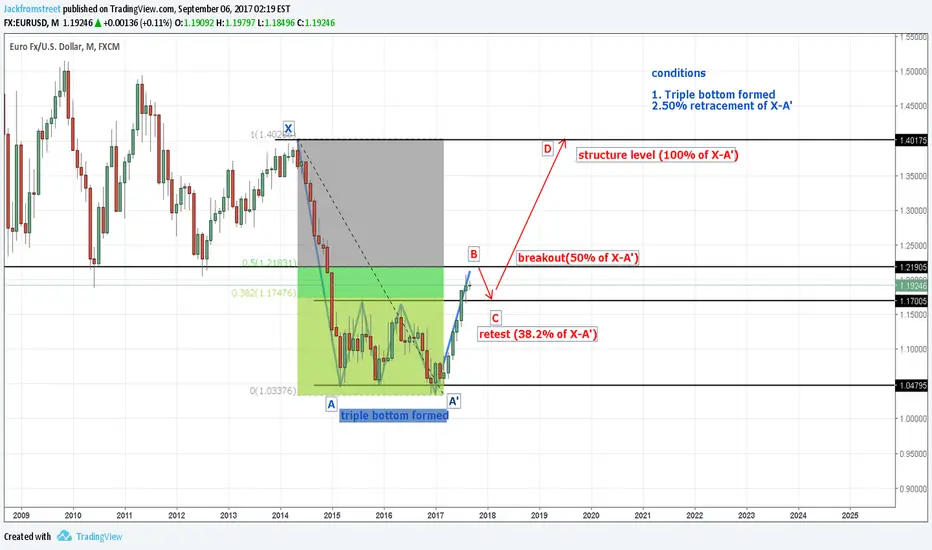
triple bottom formationjust confirmed above the resistance zone
looking to see a reversal and hold at 38.2 then gain higher
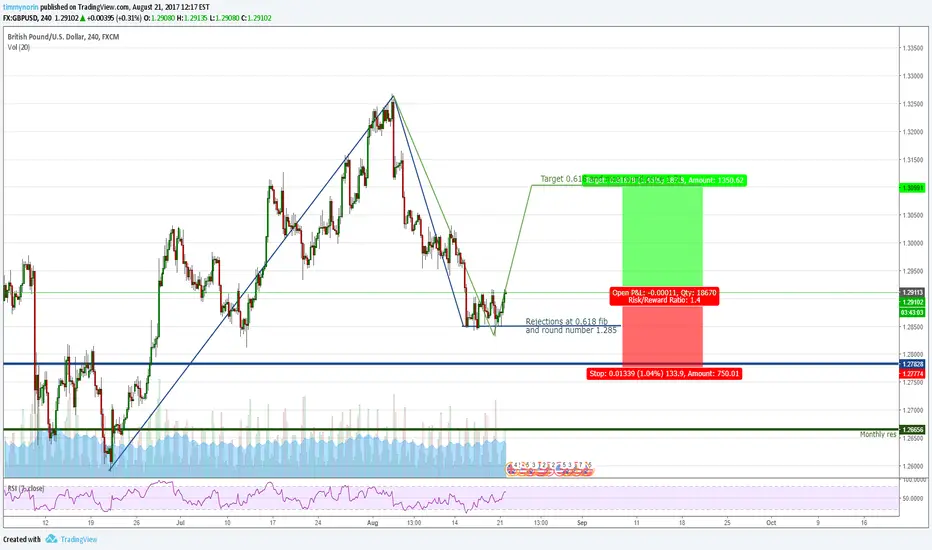
GBPUSD (4H) Dancing with round numbers and fibonacciIm buying into the strong support showed by 0.618 fib together with 1.285 round number.
For target prognosis Im also using fib - same level, 0.618 which coincides with another round number, 1.31.
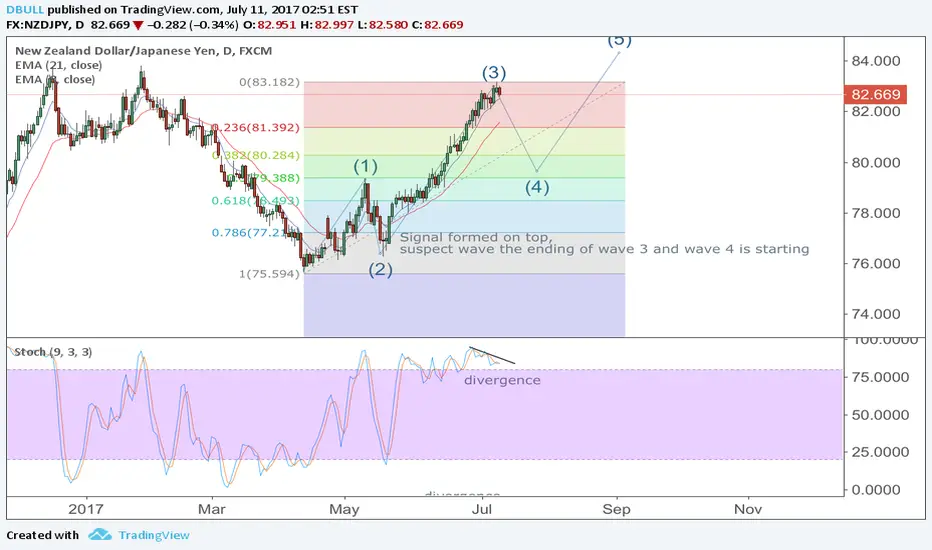
NZDJPY DAILY/WEEKLY TRADE (SELL)The grand bearish wave FX:NZDJPY is forming on DAILY/WEEKLY time frame. Fibo fan is indicating the possible future location of point V . Being a long-term project, it'll take significant time to reach its goals, but if reached, they're definitely worth* it :-)
This idea was largely inspired by beauty and simplicity of Tradewonk's analysis:
Good luck and profitable trading!

NZDJPY shortNZDJPY
Wave 4
Short @ 82.700
Target for wave 4 is on fibo 38.2 % level @ 80.284
Wave 5
Sit, relax and wait till signal formed to start the wave 5 engine, wave 5 long target will be
84.890
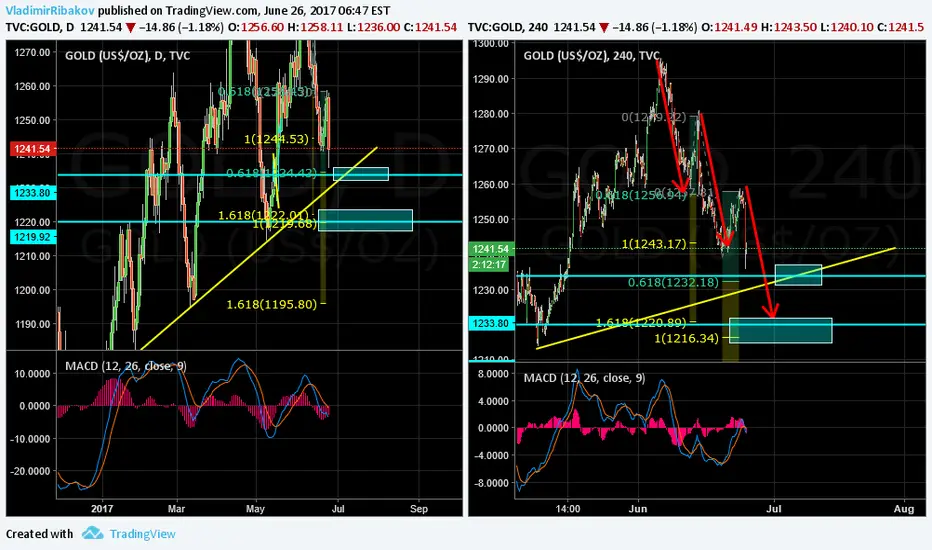
Gold Buy ZoneD1 - We have a good up trend line and is already very close to it. We can look for buys as long as 1214 zone holds.
H4 - Triple cycle would end at 1220 zone which is also a magnet zone and a very strong supportive area of the D1 swing low.
1234 is the Fibonacci expansion 61.8% along with the daily trend line. Price already bounced from it, providing a good movement up. Keep in mind price is already in a good place for buys.
Summary - Until the 1234 zone holds we can look for buy opportunities already. Next zone to follow is slightly lower around 1220.
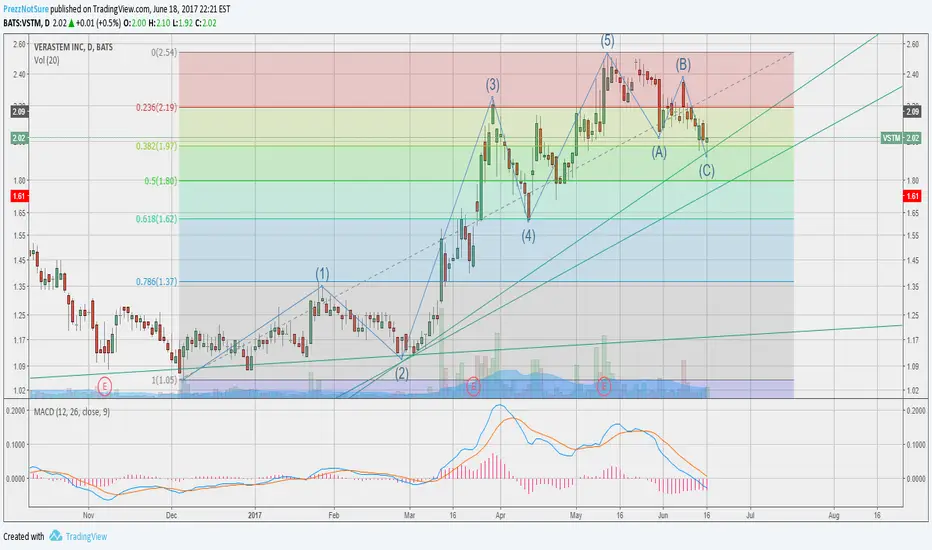
VSTM Wave completion + other concurrent price action
I'm long 500 units VSTM given the completion of the wave cycle + concurrent daily close above .38 fibo AND minor support from the initial trend reversal line established back in March.
Be careful though, fundamentals are fairly weak with this small cap company failing to produce a profit. Stop loss set tight at around 1.8. 5 year target at $15+. Short term, I expect to see $5/share, hopefully by the end of the year. Assets alone value over $2/share, so for me, it's a moderate risk.
My first day here at TradingView, cut me some slack :-D Any input would be greatly appreciated.
NIKKEI225 H4/DAILY TRADE (SELL)Hello, traders!
NIKKEI 225 formed a bearish wolfewave and made a good move below the line 2-4 being supported by medium volume.
Opened sell position, but as the price bounced from fibo fan 61.8, it may retrace to line 2-4 later. If so and supported by divergence/volume, this can become an opportunity for more shorts.
GL All!

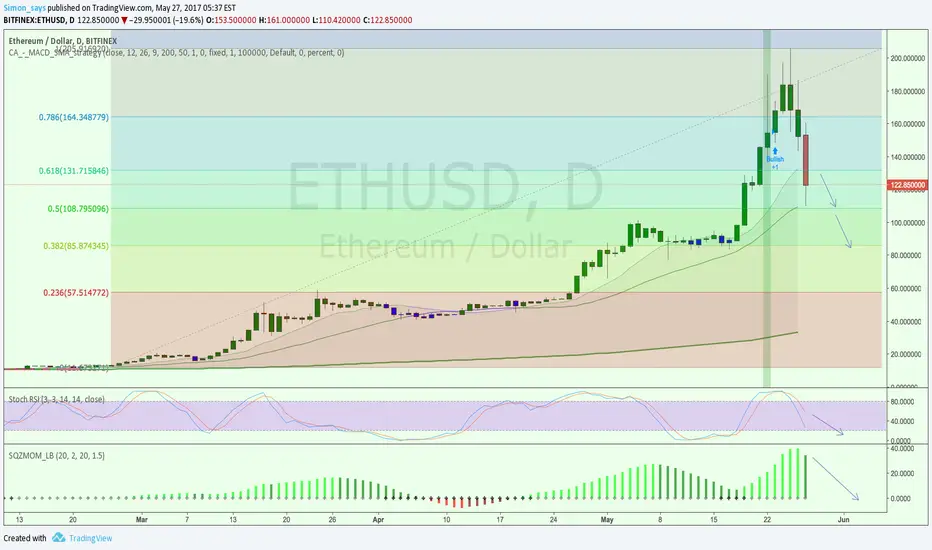
ETHUSD 1DMy previous two plots on ETHUSD were very accurate, please check:
In my perception ETHUSD is overbought alike BTCUSD.
Price has to go down for both of these cryptocurrencies.
Please have a look at the oscillator they still have some space to go down.
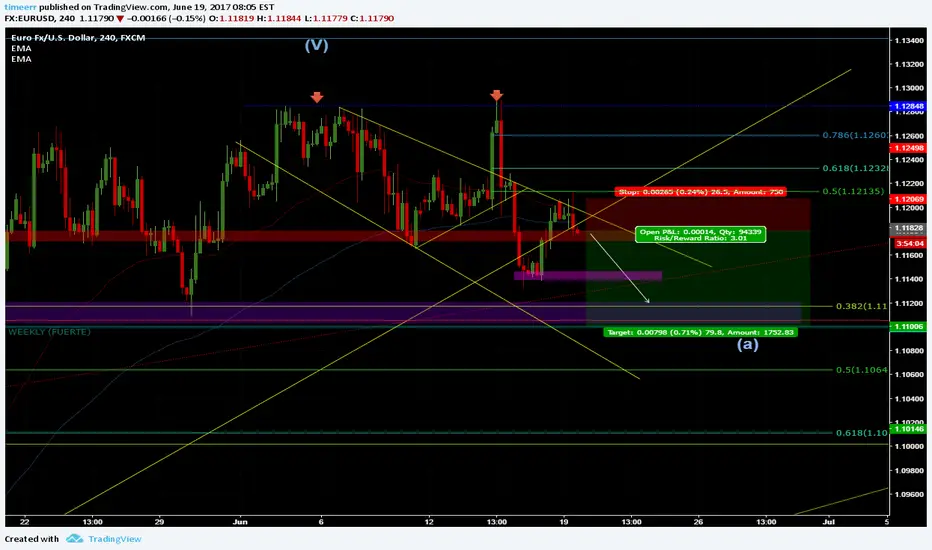
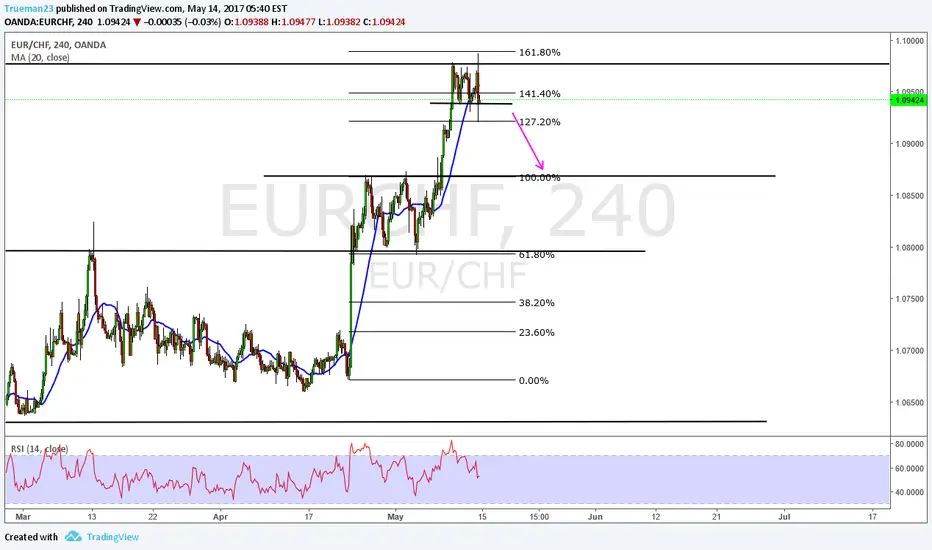
Short Eur Chf looking for a short here ..
Price hit daily resistance and is forming a top pattern ...we also have a very nice fib sequence with retracment to 61% and expansion to 161 % ...
all i wanna see is a break of the support to get in short .
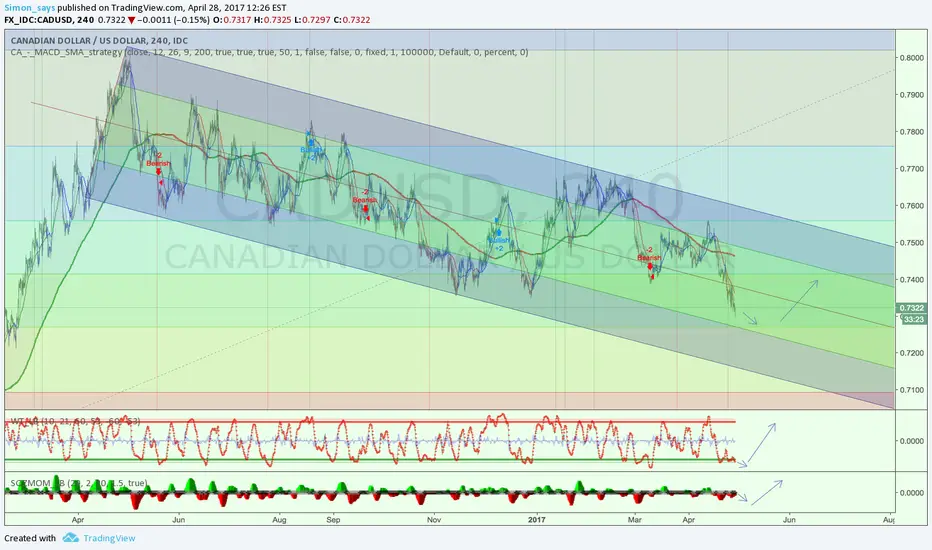
CADUSD 4HIn short term price of CAD will move down however, in long term will re-bounce to touch EMA.