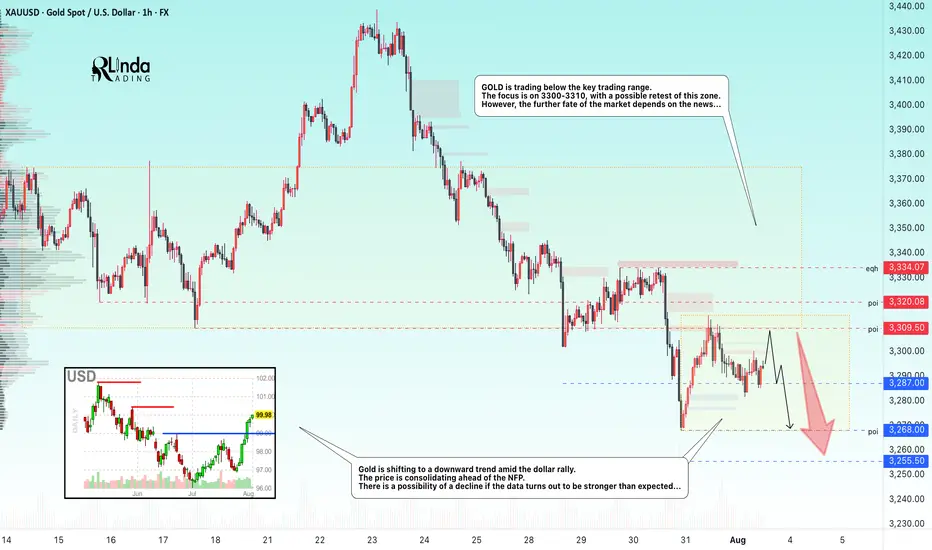
GOLD → The market is waiting for NFP. What could happen?FX:XAUUSD is bouncing off resistance at 3310, confirming the upper limit of the new trading range. The dollar continues to rally, but the market as a whole is stagnating ahead of upcoming news—NFP is coming up!
Gold is consolidating at monthly lows around $3268, awaiting key US labor market data (NFP). Trump's new tariffs (10% globally, 35% for Canada, 39% for Switzerland) have boosted demand for the dollar, putting pressure on gold. Markets are waiting for NFP: forecast +110K jobs, unemployment 4.2%. Weak data (<100K) → gold may rise to $3400. Strong (>150K) → the dollar will strengthen, gold will continue to fall. The probability of a Fed rate cut in September is <50%.
Based on yesterday's data, I would cautiously suggest that NFP will be in the range of 125K–145K, slightly above the consensus (110K). This will play into Trump's hands (I think you understand what I mean...).
Resistance levels: 3300, 3310, 3320
Support levels: 3287, 3268, 3255
The news has a negative nuance — unpredictability. Be careful.
Technically, based on the data we have at the moment, I would assume that the market may test resistance at 3300-3310 before a possible pullback to the specified support. BUT! Unpredictable data could turn the game around, and in that case, if the dollar falls, gold could start to rise.
Best regards, R. Linda!
Fibonacci
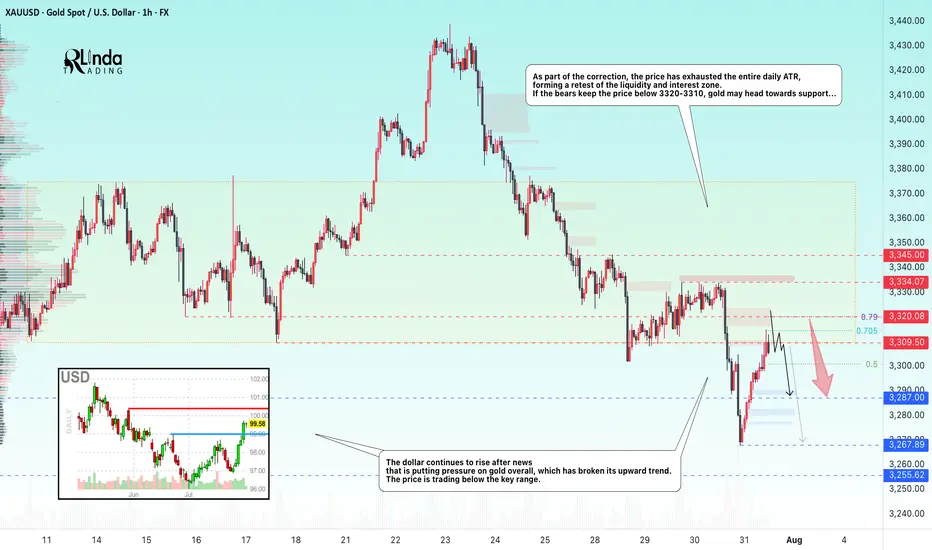
GOLD → Retest of resistance within a bearish runFX:XAUUSD breaks through the upward trend support amid a rallying dollar. Since the opening of the session, the price has been testing the zone of interest, but bears are quite aggressive...
Gold is partially recovering after falling to $3,268, a monthly low caused by the Fed's hawkish tone. The Central Bank kept its rate at 4.25–4.5% (9 votes to 2), highlighting uncertainty due to Trump's tariffs. Markets now estimate the probability of the rate remaining unchanged in September at 58% (previously 35%). The dollar's rise slowed amid concerns about the extension of the US-China trade truce and profit-taking ahead of key US employment data (after strong ADP and GDP reports). The nearest drivers are labor market statistics and trade news, while the technical picture for gold remains bearish.
Technically, on D1, the price is breaking key support zones, including the trend line, which overall only increases selling pressure on the metals market...
Resistance levels: 3310, 3320, 3334
Support levels: 3287, 3267, 3255
As part of the correction, the price has exhausted the entire daily ATR, forming a retest of the liquidity and interest zone. If the bears keep the price below 3320-3310, gold may head towards support...
Best regards, R. Linda!
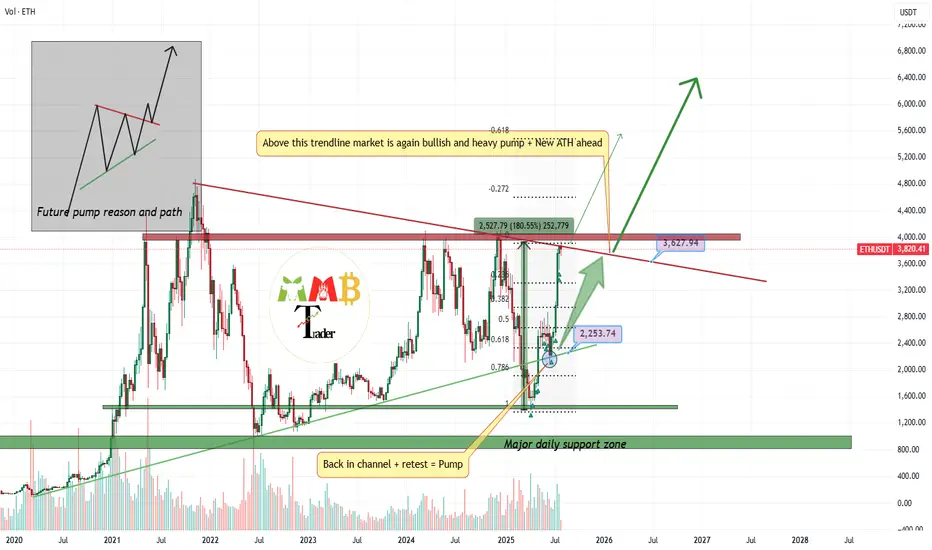
4000$ is last resistance left Ready for breakout and pump?market is still bullish and i am looking for breakout here to the upside for sure But we should consider this factor that major resistance now is touching and we may have first short-term fall.
so for now we may have correction and dump to the targets like 3300$ which is first support of 0.23 Fibonacci level.
and after this healthy correction or without it we can expect more pump and breakout of 4K$ and heavy pump to the targets like 7K$.
DISCLAIMER: ((trade based on your own decision))
<<press like👍 if you enjoy💚
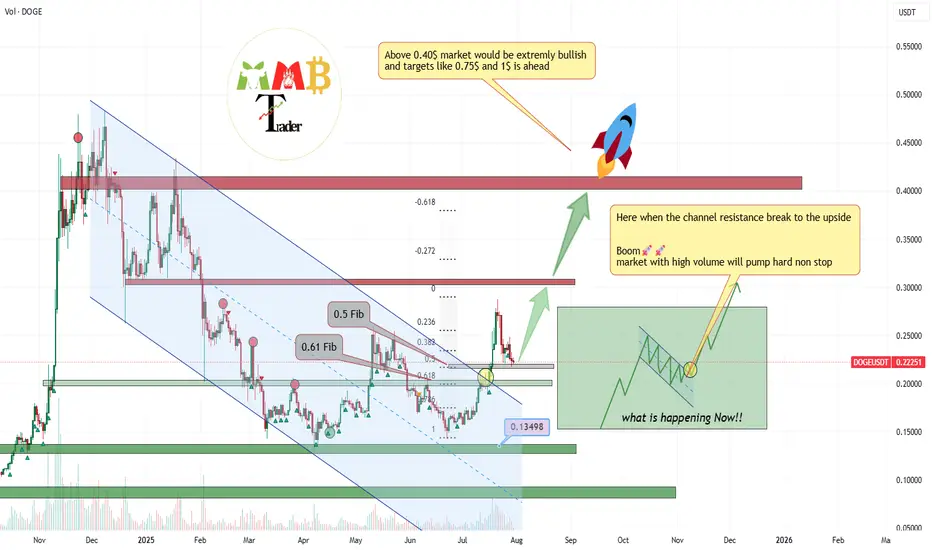
Those daily +20% to +30% candles soon will appear!!Those Fibonacci levels which are last supports for healthy & #Bullish market are all touching i mean the 0.218$(0.5 #Fibonacci) & 0.202(0.61 #Fibonacci) and i think these supports are strong enough to stop the correction and soon again it will pump and even can break daily high near 0.42$ and hit targets like 0.5$ and 0.75$.
DISCLAIMER: ((trade based on your own decision))
<<press like👍 if you enjoy💚
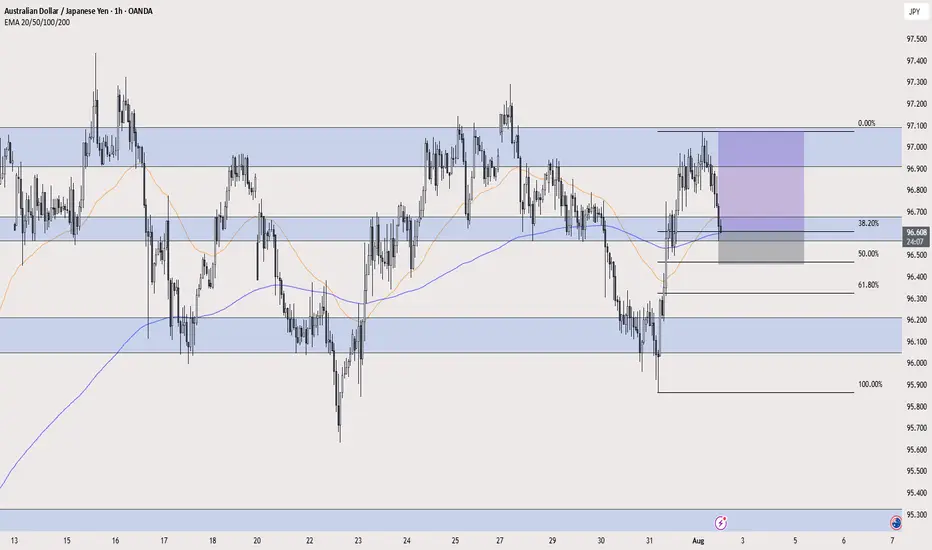
AUD/JPY LONG AUD/JPY LONG " break of a resistance area and retest it + 38.2% fib retracement + 50 and 200 ema dynamic support + risk on environment "
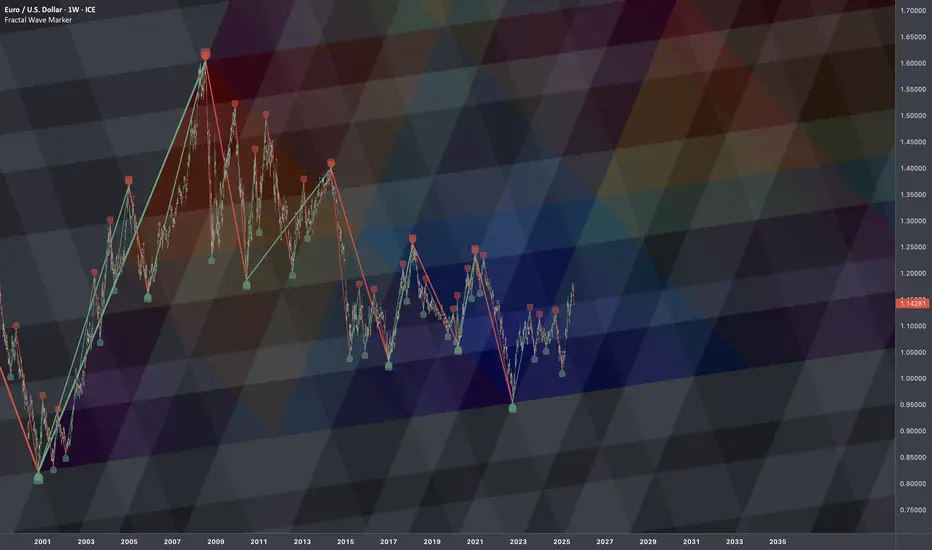
€/$: Fractal Geometry (Cycle 2000-2022)🏛️ Research Notes
Research on order in chaos using scaling laws and math sequences found in nature.
Sierpinski triangle will be used as basic heatmap layer - orienteer for next buildups.
Cross-cycle interconnection 3 cycle knot
Considering the fact that structurally current price is in a new cycle, the core structure which is previous cycle can be extended with another layer that emphasizes phase of the cycle in its angle.
Extended Fibonacci Sierpinski Triangle should look like this:
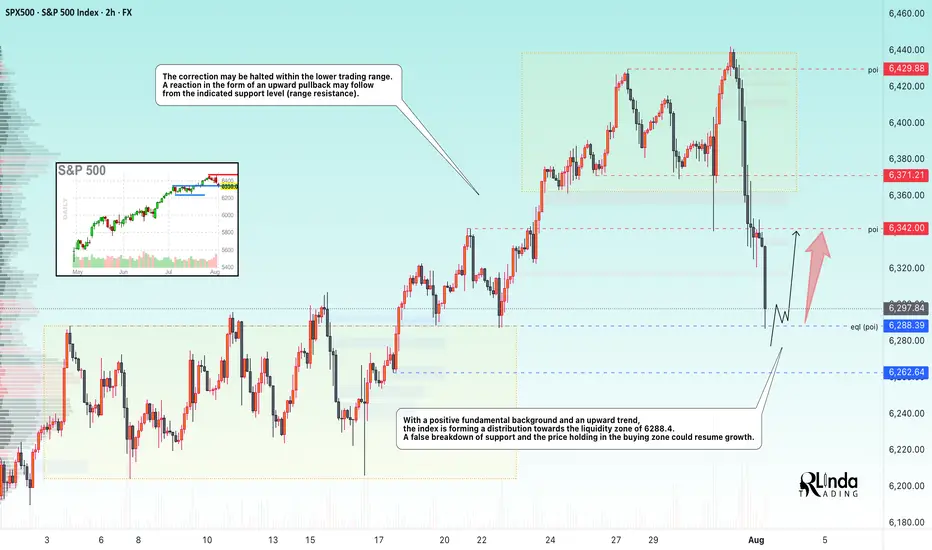
SP500 → Countertrend correction before growthFX:SPX500 is correcting against an upward trend. In the second half of the week, the market received fairly positive fundamentals during the reporting period.
S&P 500 futures found support after strong reports from Meta and Microsoft, which exceeded earnings expectations and forecasts thanks to AI. The rise in futures supported demand for the “Magnificent Seven” despite Powell's hawkish comments. The focus is on Apple and Amazon reports in the evening, which could strengthen the tech rally. On Friday, we are seeing a countertrend correction in which the market is testing the 6288 zone of interest.
Support levels: 6288.4, 6262.6
Resistance levels: 6342, 6371
Most likely, the market will form a false breakout of support during the correction. If the bulls keep the index above the key level, we can expect continued growth in the short and medium term.
Best regards, R. Linda!
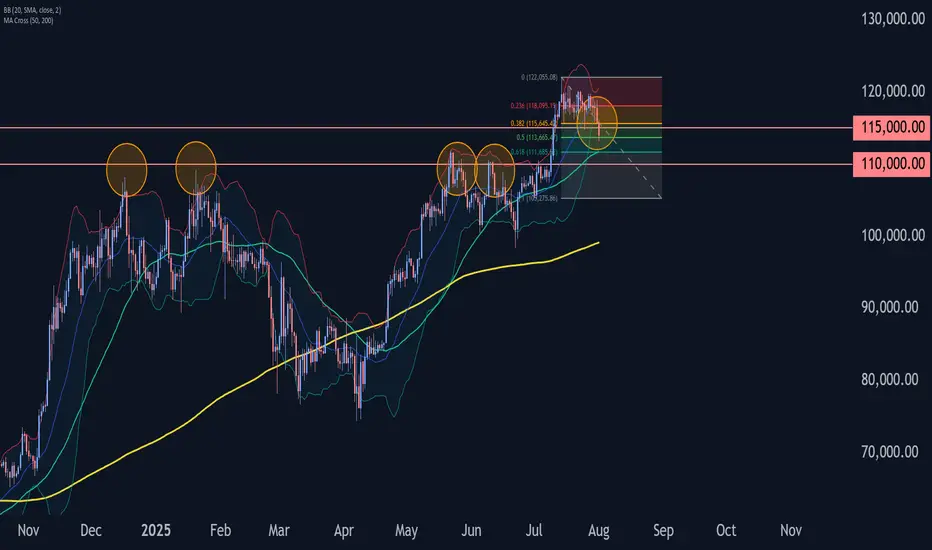
Bitcoin Wave Analysis – 1 August 2025- Bitcoin broke the pivotal support level 115000.00
- Likely to fall to support level 110000.00
Bitcoin cryptocurrency recently broke below the pivotal support level 115000.00, coinciding with the 50% Fibonacci correction of the sharp upward impulse from the start of July.
The breakout of the support level 115000.00 strengthened the bearish pressure on Bitcoin.
Given the bearish sentiment seen across the cryptocurrency markets today, Bitcoin can be expected to fall to the next support level at 110000.00 (former resistance from May and June).
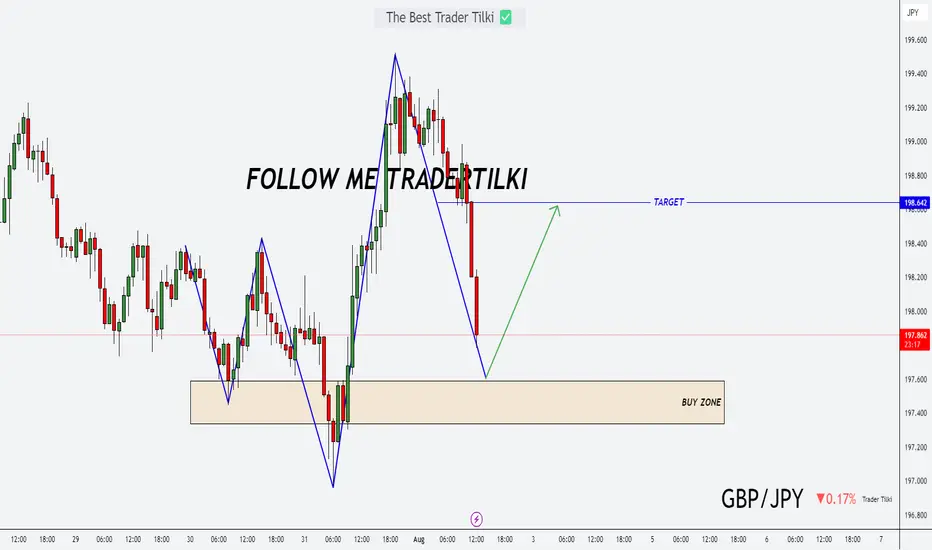
Today’s Opportunity: Stay Sharp on GBPJPY!Hey friends,
Here's my latest analysis on GBPJPY.
📌 Buy Entry Zone: 197.590 - 197.336
🎯 Target Level: 198.642
📅 Today, major economic data will be released from the U.S.
Make sure to factor this into your fundamental analysis.
📊 It’s not just about the charts—fundamentals matter too.
Technical + Fundamental = Powerful outcomes ✅
💬 Every like and bit of support keeps me going.
Thanks so much to everyone backing this journey! 🙌
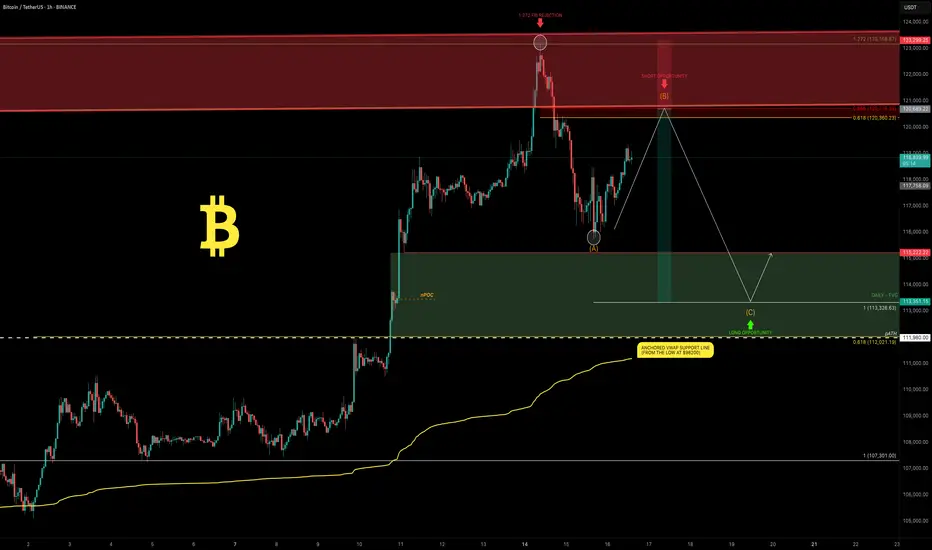
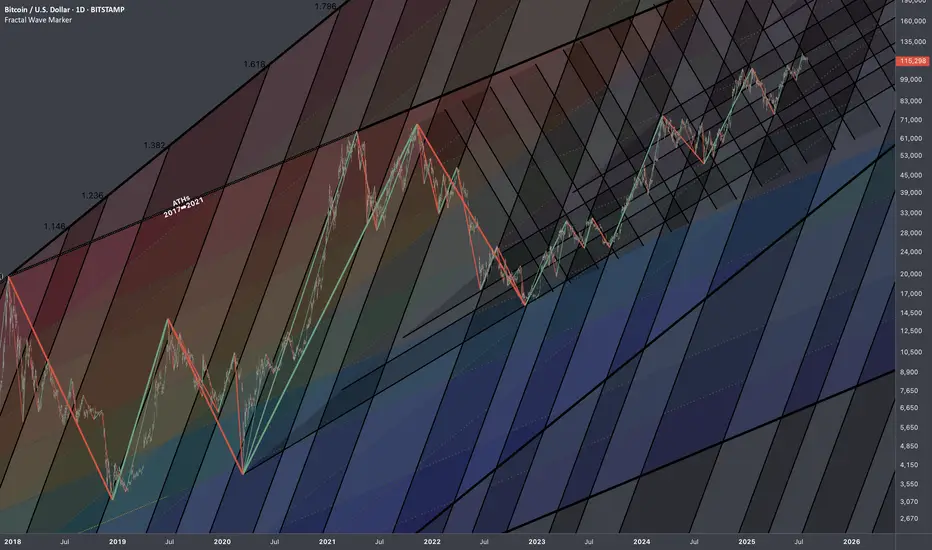
Bitcoin: New All-Time High — What’s Next?Bitcoin had an incredible run, breaking the old all-time high ($111,980) with strong bullish momentum and setting a fresh ATH at $123,218 (Binance). We just witnessed the first major corrective move of ~6% and a decent bounce so far — but the big question is:
What’s next? Will Bitcoin break higher over the summer or form a trading range here?
Let’s dive into the technicals.
🧩 Higher Timeframe Structure
May–June Range:
BTC was stuck between $110K–$100K, forming an ABC corrective pattern. Using trend-based Fib extension (TBFE) from A–B–C:
✅ C wave completed at $98,922 (1.0 TBFE)
✅ Upside target hit at $122,137 (-1 TBFE)
Full Bull Market TBFE:
➡️ 1.0 → $107,301 → previously rejected
➡️ 1.272 → $123,158 → recent rejection zone
Pitchfork (log scale):
➡️ Tapped the upper resistance edge before rejecting.
Previous Bear Market Fib Extension:
➡️ 2.0 extension at $122,524 hit.
2018–2022 Cycle TBFE:
➡️ 1.618 at $122,011 tapped.
Macro Fibonacci Channel:
➡️ Connecting 2018 low ($3,782), 2021 ATH ($69K), 2022 low ($15,476) →
1.618–1.666 resistance band: $121K–$123.5K.
✅ Conclusion: Multiple fib confluences mark the $122K–$123K zone as critical resistance.
Daily Timeframe
➡️ FVG / Imbalance:
Big daily Fair Value Gap between the prior ATH and $115,222 swing low.
BTC broke the prior ATH (pATH) without retest → a pullback to this zone is likely.
Lower Timeframe / Short-Term Outlook
We likely saw a completed 5-wave impulse up → now correcting.
The -6% move was probably wave A, current bounce = wave B, next leg = wave C.
➡ Wave B short zone: $120K–$121K
➡ Wave C target (1.0 TBFE projection): ~$113,326
➡ Confluence at mid-FVG + nPOC
Trade Setups
🔴 Short Setup:
Entry: $120,300–$121,000
Stop: Above current ATH (~$123,300)
Target: $113,500
R:R ≈ 1:2.3
🟢 Long Setup:
Entry: Between Prior ATH and $113,000
Stop: Below anchored VWAP (~$110,500)
Target: Higher, depending on bounce confirmation.
🧠 Educational Insight: Why Fibs Matter at Market Extremes
When markets push into new all-time highs, most classic support/resistance levels disappear — there’s simply no historical price action to lean on. That’s where Fibonacci extensions, channels, and projections become powerful tools.
Here’s why:
➡ Fibonacci extensions (like the 1.272, 1.618, 2.0) help estimate where trend exhaustion or profit-taking zones may appear. They are based on the psychology of crowd behavior, as traders anchor expectations to proportional moves from previous swings.
➡ Trend-Based Fib Extensions (TBFE) project potential reversal or continuation zones using not just price levels, but also the symmetry of prior wave moves.
➡ Fibonacci channels align trend angles across multiple market cycles, giving macro context — like how the 2018 low, 2021 ATH, and 2022 low project the current 1.618–1.666 resistance zone.
In short:
When you don’t have left-hand price history, you lean on right-hand geometry.
That’s why the $122K–123K zone wasn’t just random — it’s a convergence of multiple fib levels, cycle projections, and technical structures across timeframes.
⚡ Final Thoughts
Bitcoin faces major resistance around $122K–$123K backed by multiple fib and structural levels. A retest of the prior ATH zone (~$112K–$113K) looks probable before the next big directional move. Watch lower timeframe structure for signs of completion in this corrective phase.
_________________________________
💬 If you found this helpful, drop a like and comment!
Want breakdowns of other charts? Leave your requests below.
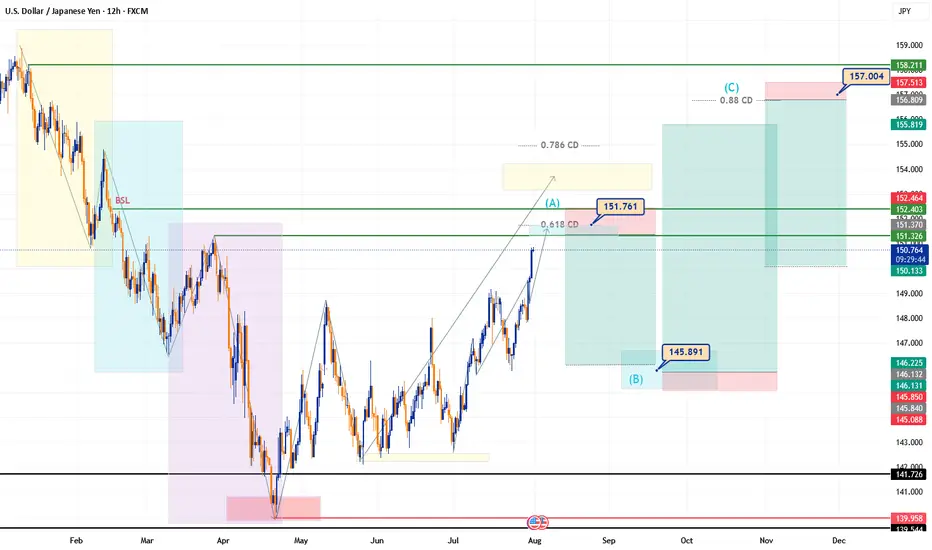
First Monthly Analysis – USDJPYThe USDJPY pair ends the month of July with a strong bullish impulse reaching 150.6, a price area that may signal the exhaustion of the uptrend that has dominated throughout the month.
An ongoing ABC harmonic structure is taking shape, with wave A likely completing between 151.36 and 152.00, which aligns with the 0.618 CD retracement — a confluence that reinforces the zone as a key resistance area.
From there, a potential bearish correction (wave B) may develop, targeting the 145.89 region. If this structure plays out correctly, a final bullish expansion (wave C) could aim for the 157.05 area.
Key Zones for the Week:
Projected exhaustion zone (wave A): 151.36 – 152.00
Expected pullback (wave B): 145.89
Final bullish target (wave C): 157.05
⚠️ Disclaimer
The correction of July’s bullish trend may begin before reaching the expected zone (151.36–152.00) due to liquidity buildup beneath current levels. A premature reversal is possible if institutional players decide to hunt that liquidity before continuing the larger move.
💬 “Sometimes it’s not about if it will get there, but when they let you in. If the party’s heating up above, check if they’re locking the door from below.”
Order Setup (Speculative Idea)
Sell Limit Order
Entry (Open): 151.362
Stop Loss (SL): 152.403
Take Profit (TP): 146.210
Risk–Reward Ratio : 4.79
Use this as a reference setup. Always manage your risk and adapt based on evolving price action
Solana coin Long setupIn this video I go through the current price action and talk about how the 126$ target level was recently reached for a clean long entry and on the daily timeframe we printed a higher low .
I expand on my thoughts for a continuation to the upside and to retest some higher levels of resistance 180$s and time will tell if we print a higher high at the 180$s before retesting the $200 zone .

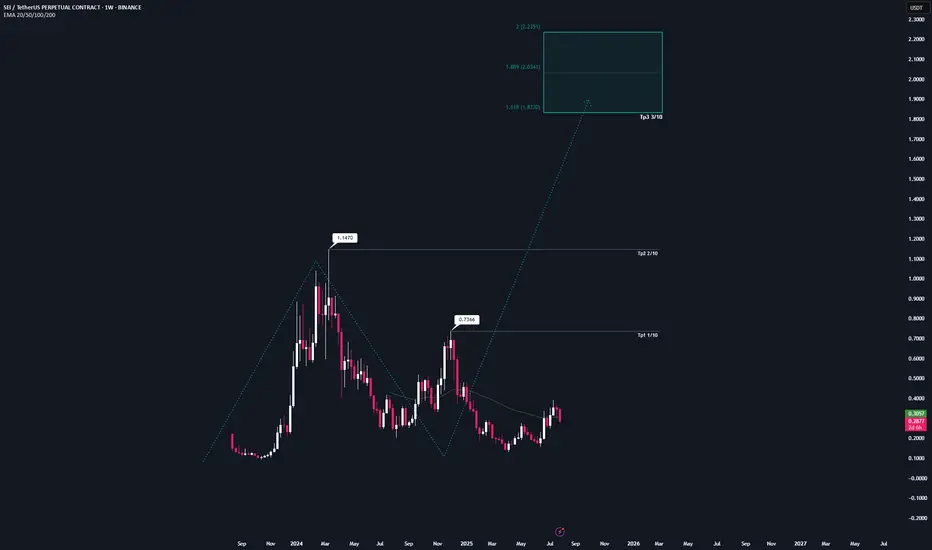
SEI | Full AnalysisHere is the top-down analysis for Sei as requested 🫡
Weekly Timeframe:
We have a potential large structure forming on the weekly chart that will be activated once we break the ATH. Its target zone lies between $1.8 and $2.2.
My sell targets for SEI this cycle are:
TP1: $0.73
TP2: $1.14
TP3: $1.83
These are my sell targets based on my technical analysis. However, I won’t rely on them alone — I also follow several on-chain indicators. Once retail euphoria kicks in and my indicators trigger, I’ll start selling accordingly.
Daily chart:
On the daily, we have a sequence that has already been activated and almost reached its target zone. That’s why the B–C correction level remains a valid buy zone, which I’ll also use for additional long entries.
This would be the second attempt from a B–C correction level, as we’ve already tapped it once (where I went long) and I’ll be entering again here.
Target zone for this sequence: $0.39–$0.44
Local Price action:
On the lower timeframe, we’ve just completed a bearish structure that perfectly overlaps with the B–C correction level. This increases the probability of this setup significantly, as both sides (bulls and bears) want the same thing here: bulls are buying the market, while bears are covering shorts and taking profits.
-----
Thats the my full Analysis for SEI, hope it was helpful if you want me to do another analysis for any other pair just comment down below.
Also, if anyone is interested in how my trading system works, let me know and I’ll post some educational content about it.
Thanks for reading❤️
XRPUSDT → Range formation. Retest of resistanceBINANCE:XRPUSDT.P , after a false breakout of the daily resistance level of 3.352 and the elimination of traders, has entered a correction phase. The trading range shown below has been formed, with an emphasis on resistance...
XRP previously formed a false breakout of the daily resistance level of 3.352, as indicated in the idea above. After changing its market character, the price entered a correction phase. Focus on the range of 3.00 - 3.264. A retest of resistance (zone of interest and liquidity) is possible before falling to 3.161, 3.05 or to the liquidity zone of 3.00. There are no technical or fundamental reasons for exiting the consolidation; most likely, a retest of the zone of interest may end in manipulation and a pullback to support...
Resistance levels: 3.1609, 3.264, 3.352
Support levels: 3.05, 3.00
I do not rule out the fact that a retest of the 3.264 resistance level may have a breakout structure and the price will continue to rise, but based on the price behavior pattern on D1, the market structure, and market stagnation, I conclude that at the moment, the chances of seeing a correction from resistance are higher. Further developments will need to be considered after the retest of key zones on the chart...
Best regards, R. Linda!

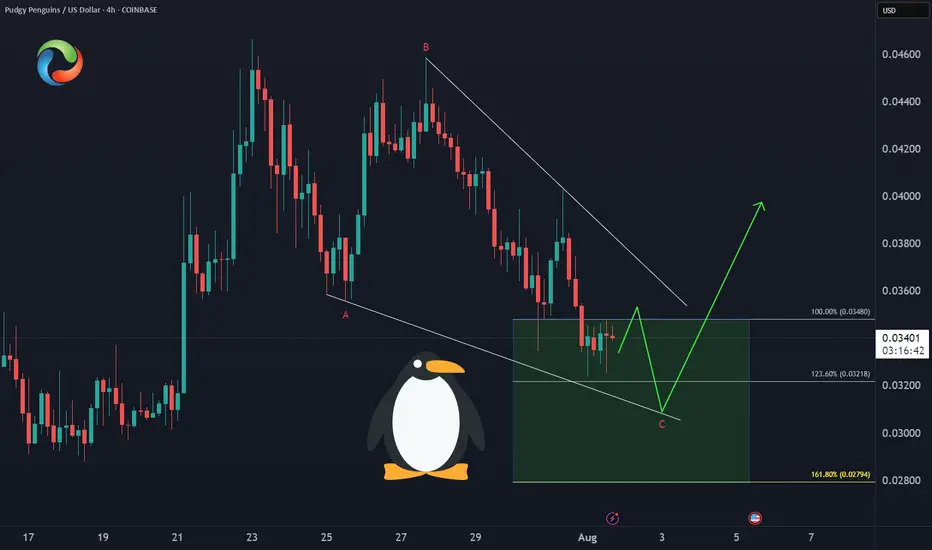
PENGU Enters Demand ZoneCOINBASE:PENGUUSD 🐧Price has developed a clean A-B-C correction into the equal legs support zone at $0.034-$0.028, offering:
✅ Optimal risk/reward entry
✅ Wave structure confirmation
✅ Higher low potential
This is the technical sweet spot for the next rally leg.
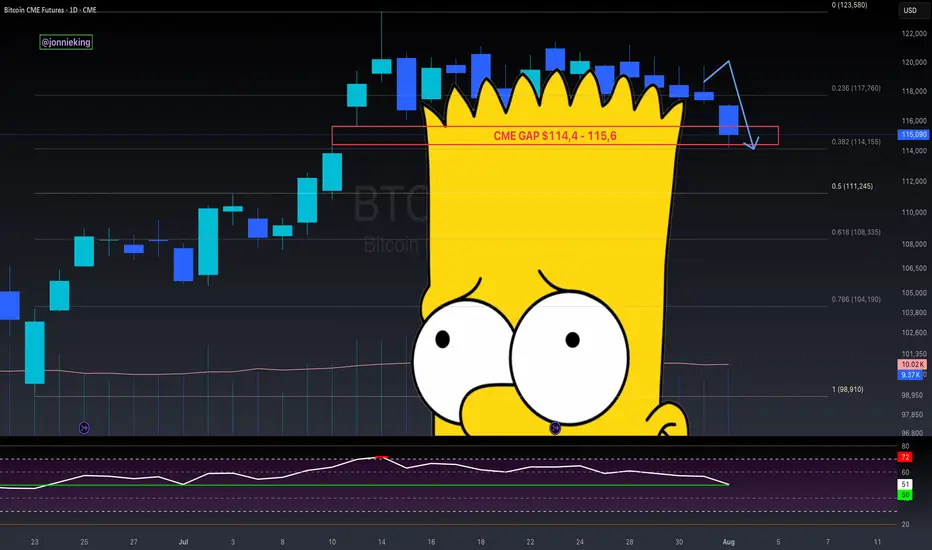
$BTC CME Gap + Bad Bart = Easiest Short EverCME Gap + Bad Bart is like taking candy from a baby 👨🏻🍼
Look at that textbook bounce off the .382 Fib 🤓
Pain ain’t over folks.
RSI still shows room on the downside 📉
Global Liquidity drain on the 4th.
Looking like the 50% Gann Level is next ~$111k
Get those bids in 😎
And never forget the BullTards who were telling you about the “Bollinger Band Squeeze” and UpOnly season 🫠
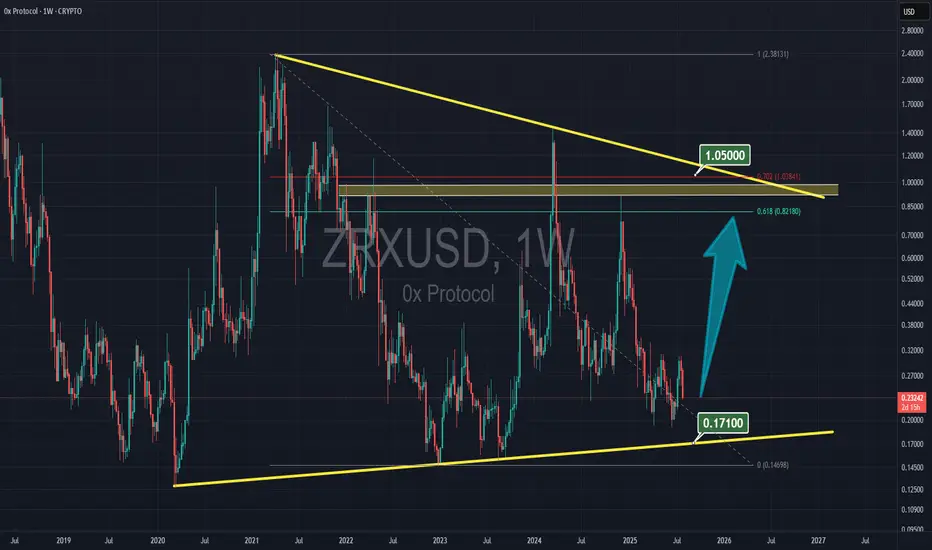
ZRX to $1 ZRX is consolidation at the very bottom price, and with alt-season hopefully get a rally to $1
Bitcoin: Interconnections Rewired🏛️ Research Notes
Keeping fib channel of the rising trend angles as they've number of times covered well that aspect of cycle texture.
The other frame of reference would be with fib channel that covers drop from 2021 ATH to late 2022 bottom.
Last bit would be integrating fib channel discovered while ago that connects covid & late 2022 bottoms
Together they create a framework that addresses the complexity and makes even the most chaotic price movements seem to be a part of structural narrative.
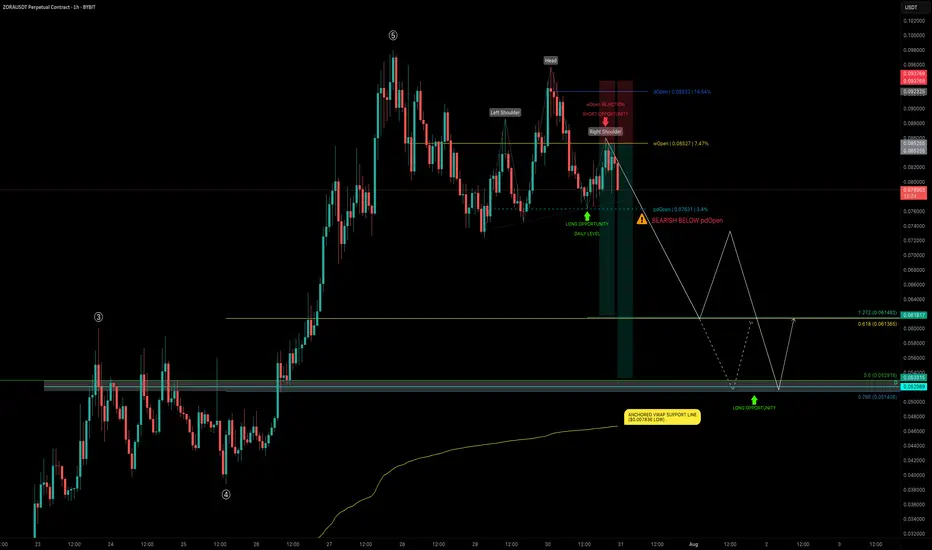
ZORA 5-Wave Completion — 30% Crash Incoming?After exploding +1150% in just 20 days and completing all 5 waves, ZORA is now consolidating — trading sideways just under the $0.10 psychological level for the past 4 days.
📉 Current Market Structure
The current structure shows signs of a developing Head & Shoulders pattern, with price:
Trading below the daily open (dOpen) and weekly open (wOpen) → Bearish signs
Hovering near the prior daily open (pdOpen) → a breakdown here would confirm bearish continuation
🔴 Short Setup - Bearish Scenario
If ZORA breaks below pdOpen, we’re likely heading for:
0.618 Fib retracement at $0.06137 of the final wave 5
Confluence with 1.272 Trend-Based Fib Extension (TBFE) at $0.06148
This zone marks the next high-probability reaction point and a potential long opportunity if price shows a bounce or reversal.
📉 Overall Short Trade Target
The full retracement target sits between $0.0529 and $0.0514, offering multiple layers of confluence:
0.5 Fib retracement of the full 1150% move
0.786 Fib retracement of the final wave 5
Aligned with an old trading range and daily level
This makes it an ideal demand zone for patient bulls but only once price confirms.
💡 Educational Insight
This setup highlights an example of Elliott Wave Theory in action — after a strong 5-wave impulse move, markets often enter a corrective phase. The completion of wave 5, especially near key psychological levels like $0.10, often marks a local top, where price corrects toward key Fibonacci retracement zones.
Combining wave structure with confluence factors like Fib levels, VWAP, and prior trading ranges helps traders identify high-probability reversal zones — allowing for better timing, risk management, and trade planning. Always wait for confirmation before jumping into any trades.
Summary
Bearish continuation confirmed on pdOpen breakdown
First support zone: $0.0613–$0.0614
Final downside target: $0.0529–$0.0514
Look for long opportunities only on reaction + confirmation
_________________________________
💬 If you found this helpful, drop a like and comment!
Want breakdowns of other charts? Leave your requests below.
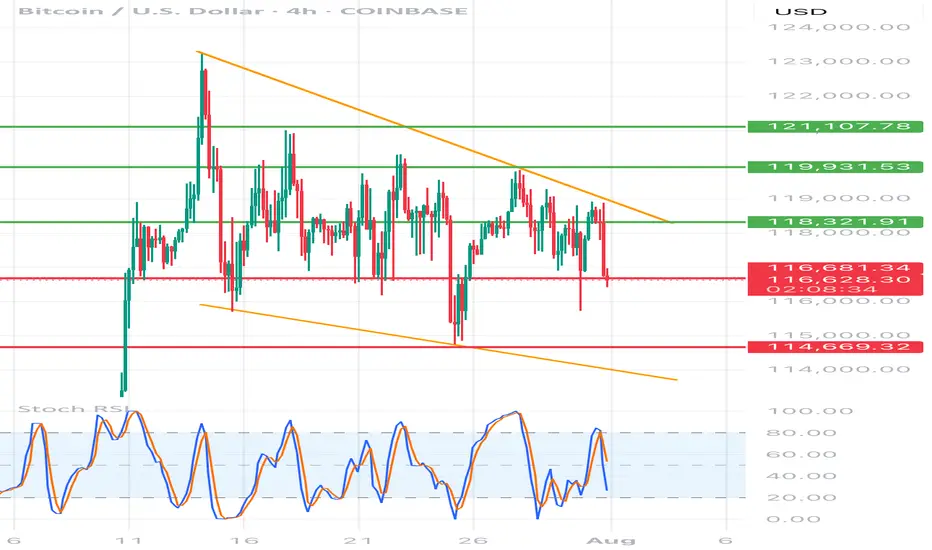
BTC/USD 4h chart🔸 Formation: Triangle descending (descending)
• Upper trend line (orange) - inheritance, connects lower and lower peaks.
• Lower support line (red) - approx. 116,700 USD - key support, tested many times.
🔻 Support
USD 116,700
Tested several times, currently threatened
🔻 Another support
USD 114,669
Target level when struck with a triangle
🔼 Resistance
USD 118,321
The nearest resistance - the former level of support
🔼 Resistance
USD 119,931
Local peak
🔼 Strong resistance
USD 121,107
Upper level of structure
📉 STOCHASTIC RSI (lower indicator)
• Line cutting and a decrease in the purchase area (> 80) towards the center.
• No extreme sales signal, but the trend begins to be negative.
⸻
📌 Applications and possible scenarios:
🔻 Bearish script (more technically likely):
• If BTC breaks below USD 116,700 with a 4H candle closure, possible:
• a decrease around USD 114,669 (lower limit of the triangle)
• Even lower - around 113,500-112,000 USD with an increased volume
🔼 Bullly script (less likely but possible):
• needed quick breaking above USD 118,300 and maintaining above this level
• Then the goal will be USD 119,931, and then possible traffic up to USD 121.107
⸻
📍 Summary:
• We see classic triangle descending-pro-draft formation.
• Support 116,700 USD very close to breaking - if it falls, down movement can be dynamic.
• Stochastic RSI coincides with the deterioration of the moment.
• The inheritance scenario seems dominant, unless there is a strong demand and over 118,300 USD.
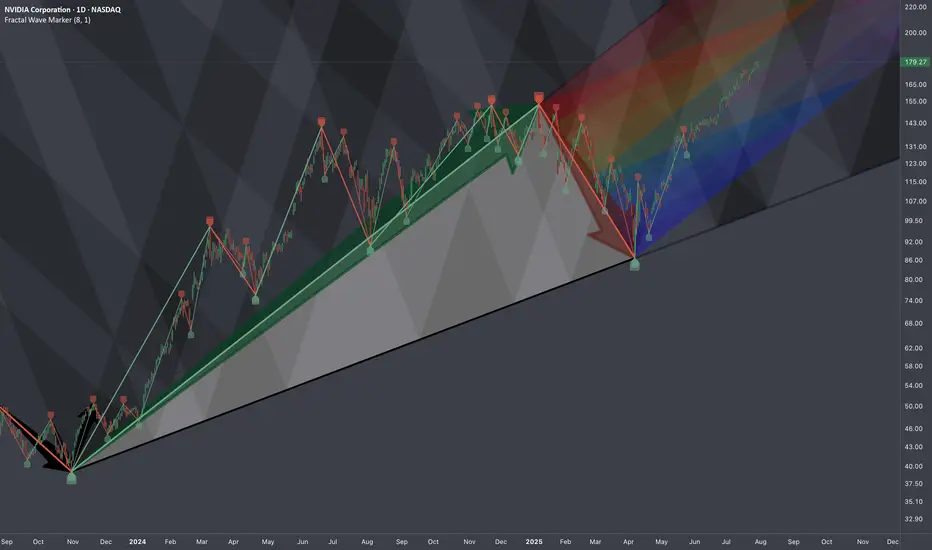
$NVDA: Cycle-Wired Levels🏛️ Research Notes
The fact that the angle of linear connection between 3rd degree points (fractal hierarchy) acted multiple amout of times as support and eventually resistance from which tariff drop happened establishing bottom and expanding from there.
That means if we were to justify the texture of ongoing wave from that bottom, we would geometrically quantify the area of that triangle to project considering historic data to remain objective approach (and NOT what levels we subjectively want to see whether we are bullish or bearish). There is mean reversion rule also going on which will be structurally addressed.
No matter where your actual target is at, there are always structural boundaries that price must break through first in order to get there. And because markets tend to move in proportion to their own scale — often aligning with exponents of the golden ratio, we treat phi as a constant within this probabilistic space.
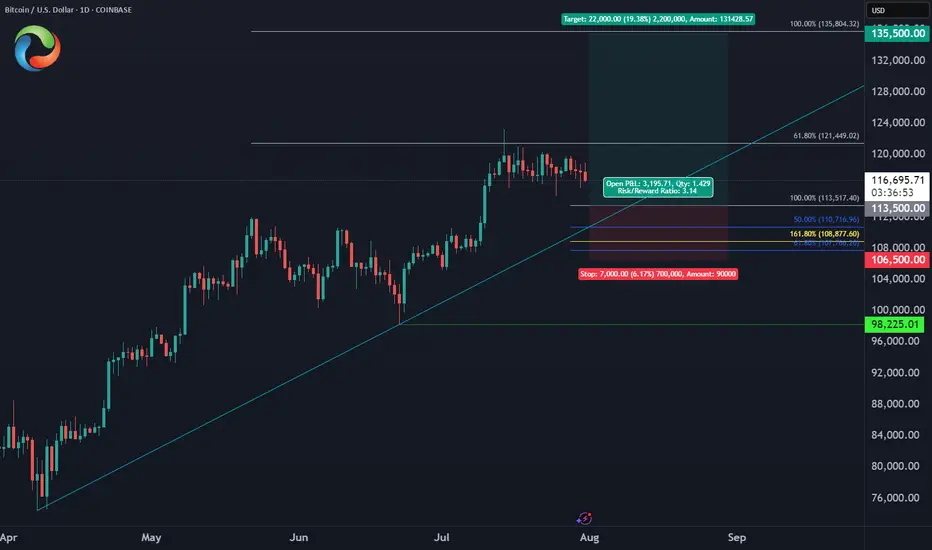
Bitcoin August Trade PlanBINANCE:BTCUSD
✅Entry Zone: $113,500 - $110,700
⛔️Stop: $106,500 (below June low)
🎯Target: $135,500 (ATH liquidity)
🔖Risk/Reward: 1:3
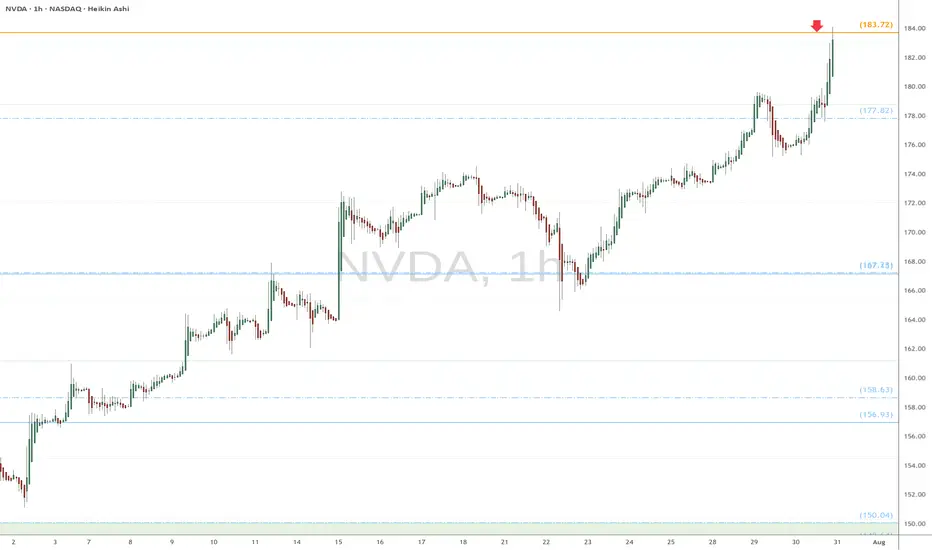
NVDA heads up at $183.72: Golden Genesis fib to mark a TOP?Chips have been flying high since the April lows.
NVDA has just hit a Golden Genesis fib at $183.72
This is a "very high gravity" fib so expect a reaction.
It is PROBABLE that we "orbit" this fib a few times.
It is POSSIBLE that we reject to form a major top.
It is PLAUSIBLE that we Break-n -Retest to continue.\
.
See "Related Publications" for previous EXACT plots ------>>>>>>>>
Such as this post at the last Golden Genesis:
Hit the BOOST and FOLLOW for more such PRECISE and TIMELY charts
============================================================
.