AMPG Intermediate Term view Update 07Feb2024Intermediate Term expectations continue on course. Retracement into Bearish Weekly Swing leg Internal Liquidity underway (Swept first Internal Lower High Pivot on Tue 23Jan).
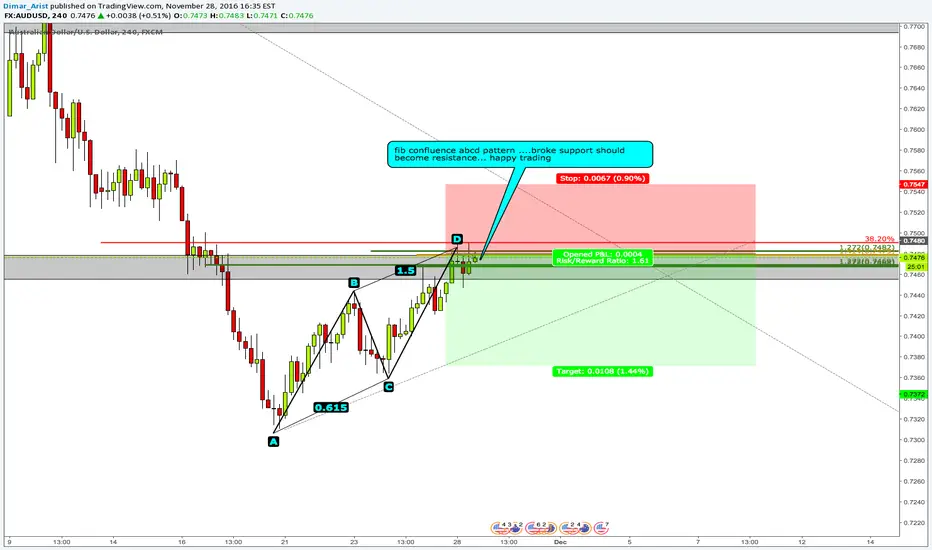
Fibonacci-confluence

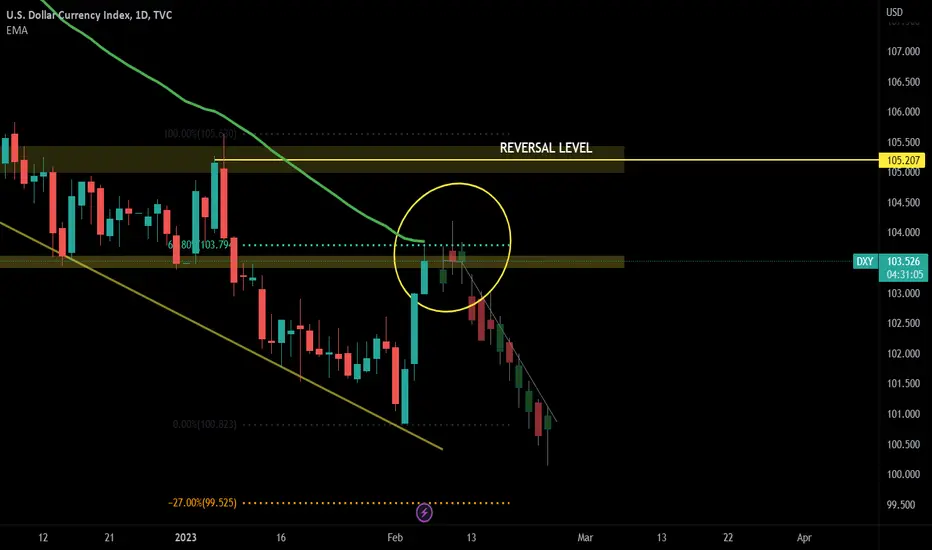
DXY: what I want to see for AUDUSD, GOLD, EURUSD long ! Hello guys, I've put ghost candles on the chart to show you what I want to see to support my Gold, EU, AU long setups.
So DXY approached very crucial zone now, there is a current strong level of S/R, a 61.8% Fibonacci level and a daily 50EMA.
Right now the bullish momentum is very strong, so I will wait to see if the confluences I mentioned are strong enough to hold the level.
If I see a daily closure above these confluences, I'll cancel all my XXXUSD setups, because they would be invalidated.
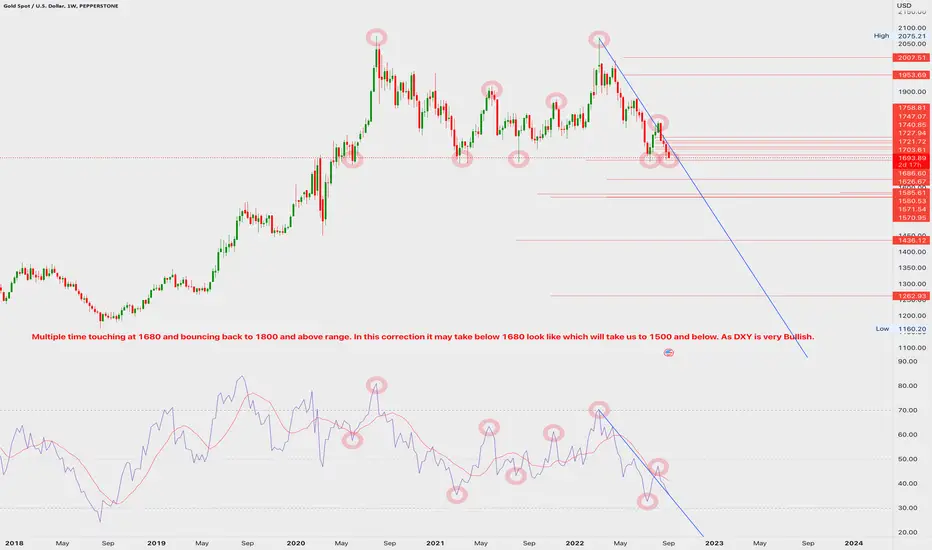
Bullish and Bearish Gold WeeklyMultiple time touching at 1680 and bouncing back to 1800 and above range. In this correction it may take below 1680 look like which will take us to 1500 and below. As DXY is very Bullish.
Trend Analysis Fibonacci Multiple Time Frame Analysis XAUUSD Gold goldanalysis fibonaccianalysis Fibonacci Confluence
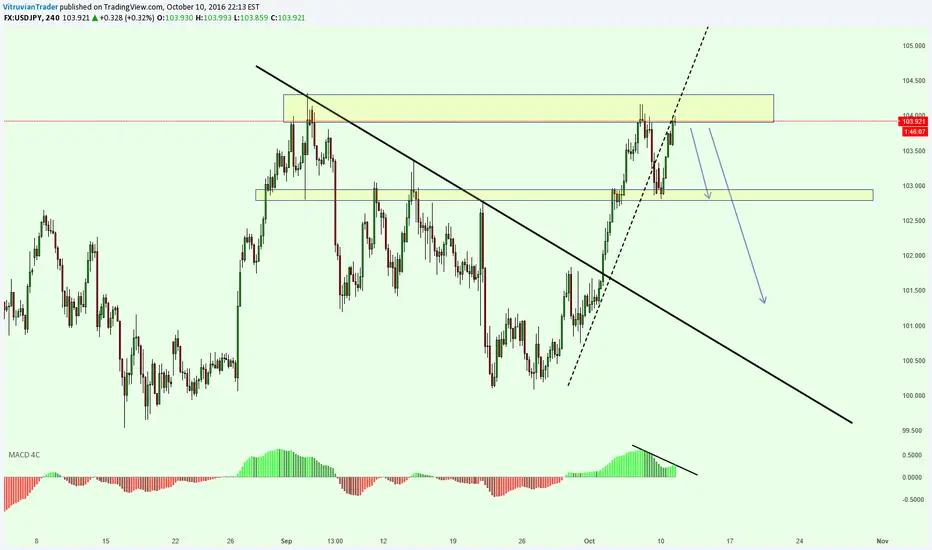
Conflunce Level | USDJPYThe movement of prices to historically low levels has created an imbalance in the forces of supply and demand as well as in the sentiment of investors. The corrections created in the current downtrend channel give the opportunity to apply a Fibonacci system consisting of a Fibonacci Retracement and a Fibonacci Expansion.
This system has provided a confluence level which may be a critical turning point for the subsequent course of exchange rates.
Specifically, this point appears at the price level around 103,100. Successful breakout of this point can lead to further price declines to even lower levels. FX:USDJPY

EUR/JPY Long IdeaLong idea from a 3 confluence setup:
1 - Trendline 3rd touch
2 - Break and retest of structure
3 - Fib level confluence
Entry on the wick after a bullish engulfing was formed on the lower time frames.
more confirmation is good confirmationJust updating from earlier. Still a jumbled mess of lines and Fibs, but enough to get a good entry. (for me. This is not advising anyone on financial decisions.)
USDCHF - Multiple confluence bullish moveConfluence factors
· Retested major support
· Broke 2 resistance levels
· Broke trendline
· Resistance turned support and is on fibonacci 38%

Short on 4h 61.8 Confluence.We have a sell on the 4h and showing a divergence on a 1h, we also are in confluence with the Daily chart as well which gives us a better reason to sell off the 61.8 and get back in the daily trend. We have a trend line break on the one hour as well as a possible head and shoulder forming on the 1h so to sum up reasons
1. Daily confluence BEAR MARKET
2. 4h 61.8 fibonacci
3. Supply zone at 61.8
4. 1H trend line break
5. 1H head and shoulders

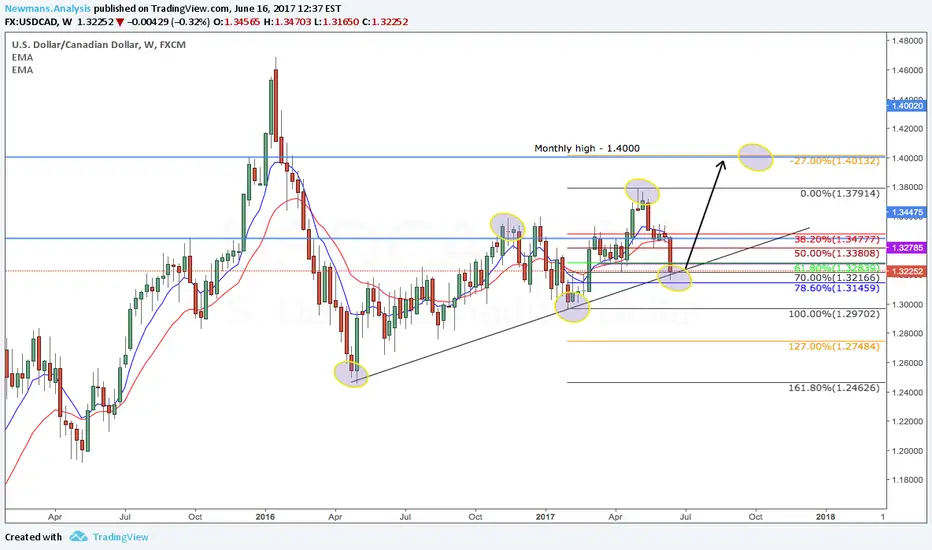
Possible long setup on USDCAD?A few confluences that are giving me a long bias. We have the weekly ascending trend line being respected, higher highs and higher lows, and price stalling around the 61.8% Fibonacci. Also have 2 confluences for the target of 1.40000 being the monthly high and falls in the line with the -27% Fibonacci.
Please feel free to share your thoughts. Thanks.
USDCAD Observation. USDCAD Observation today i am recording a descending wedge. I am expecting this pair to exhaust selling power at the 1.29885 region. FIB Confluence approved the zones. Awaiting for the pair to sell out and exhaust, to potentially buy it up. I set an alert for when the pair breaks previous structure to the down side. Then ill set my by stop as price action goes that direction.
Fundamentals can alter the direction of this pair. There is CAD news releasing. Check the link below for the news article that my effect this pair. And other CAD pairs. Thanks GoodLuck!
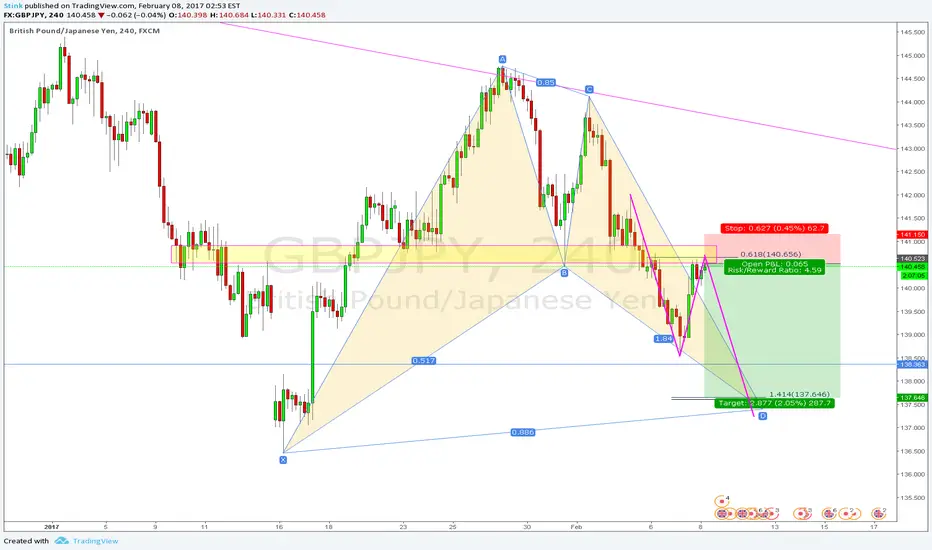
GBPJPY - 4 hr ShortA few things iv'e been watching.
Over all I feel we could see a Bullish Bat Complete soon.
We have had a 618 retracement from the recent impulse leg down. The Fib inversion and extension add some confluence around the D completion area.
We are in a previous area of structure resistance which we have seen a drop from in the past as well.

EURGBP double bottom long opportunityEURGBP may form a double bottom at a high probability confluence area. A recent support level, 0.382 and MA200 line up with RSI divergence. looking for a higher low and h4 reversal confirmation before entering.

NZDUSD short idea from confluence zoneSeveral fib levels and a long term key zone align in the 0.7230-ish area. Looking to short after a H4 confirmation candle. Thight stop-loss, high reward.

AUDNZD: Much Confluence at 1.05953 confluences at 1.0595 - a Shark pattern completion, an AB=CD move, and a 1.618 fib extension!

USDJPY Short AnalysisAfter taking in over 200 pips on our last USDJPY trade lets hope for some similar outcomes this week.
I am looking to short in this resistance zone where price looks like it could be forming a double top with some MACD divergence.
GBPUSD Long Analysis & Bullish Bat PatternMy viewpoint is long near long-term low structures
We have some fib confluence at an inner trend line
The purple horizontal line also represents the 886 fib level and a bat pattern completion
Looks like time to buy, entered in at the 1.618 level.
Will enter other half of position at bat completion
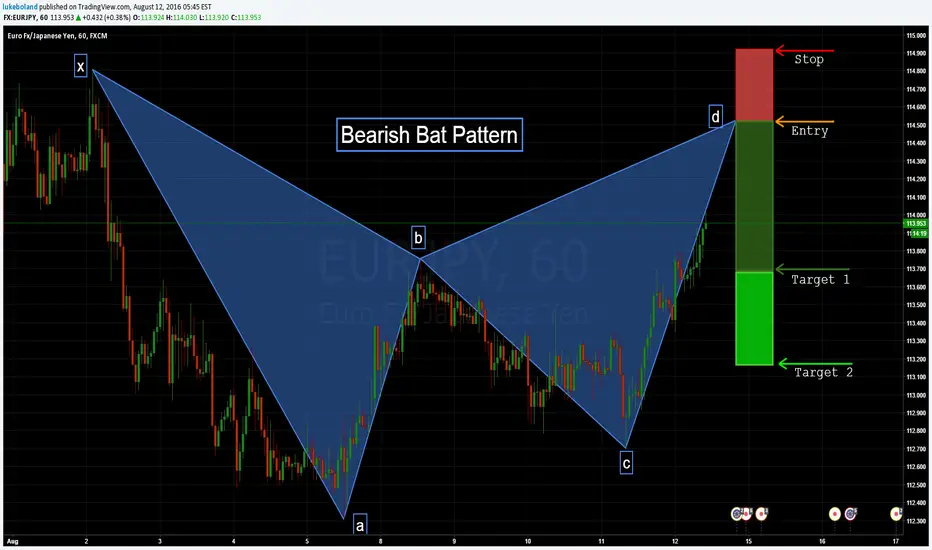
EURJPY: Bearish MolossusHi Traders,
Hope you have been having a better trading week than I have.
Here's a bearish bat pattern setup on EURJPY, with D point completion at 114.520.
Entry: 114.110
Stop: 114.920
Target 1: 113.700
Target 2: 113.180
Have a great weekend all! And remember to leave me a like if you find this idea useful.
Luke
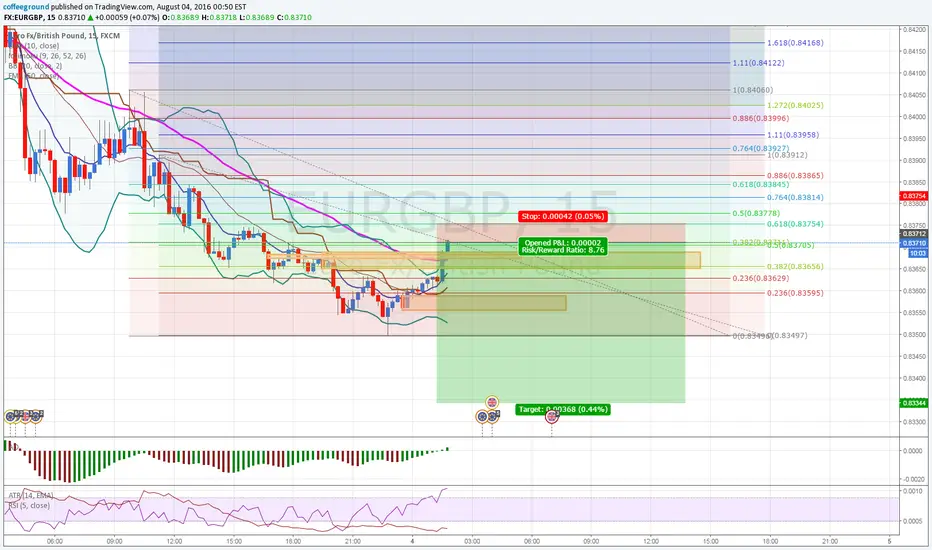
EURGBP: Selling at Supply LevelSelling at supply level in downtrend pullback at confluence fibonacci level.
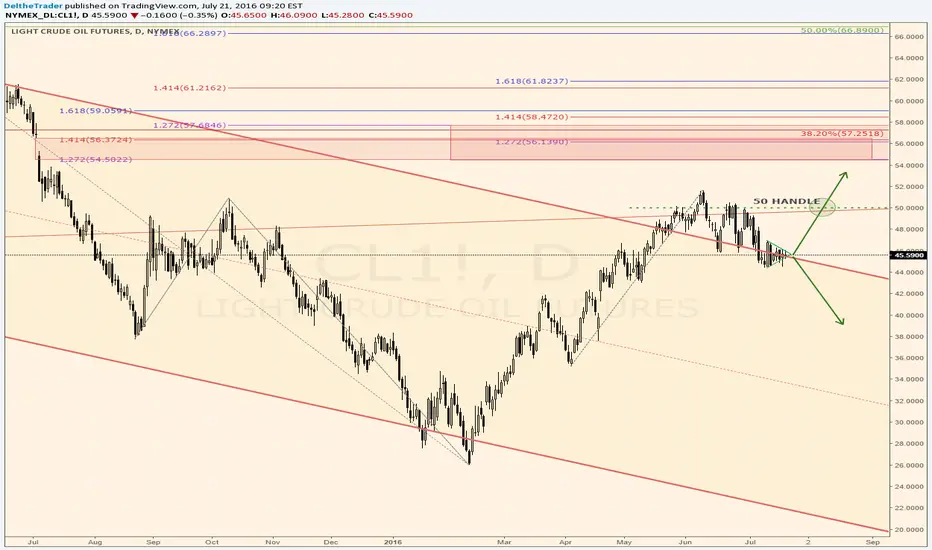
#CL_F Crude's Year Long Decision Point on the DailyOn the long side, crude has the opportunity to retest the $50 handle. If it can break, we are looking at a reversal at the 54.5 gap, or fibonacci confluence area -- to retest the $50 handle before moving even higher.
On the short side we are looking at price continuing on this year+ long bear channel, and making new lows.
Dare to Go Against Trend ?? Yeah, GBPUSD, if my conditions MetThere are many traders out there who are anxious about going against the Trend, bcos they are unsure whether that works.
Well, Today I got one scenario in GBPUSD where going against the trend can be profitable , only if market reverses in our marked Potential Reversal Zone.
See how markets moved in Harmonic move thrice and yes, there is an ABCD pattern which I didn't mark for clear view of chart.
Fib Confluence also happening in the zone and if Double Top forms there I will be going short in GBPUSD
Check your Rules and Trade... Happy Trading !
Hit Likes for Agree which is boost for Me :)

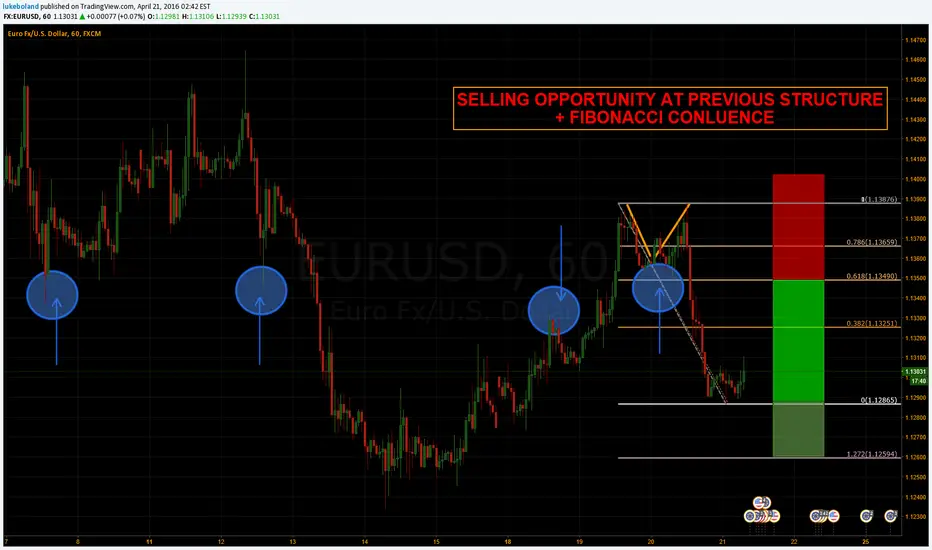
EURUSD: MORE DOWNSIDE?Hi Trader,
We have a 2618 setup forming here on EURUSD in the context of the longer term downtrend. I am particularly confident in this setup for a number of reasons. The early-week rally has been almost completely eliminated with yesterday's selloff. A valid 2618 setup has formed with the double top and close below neckline, confirming the potential for an upcoming move to the downside.
The reversal zone comes in at previous structure, as shown on the chart with the blue circles and arrows. It also happens to line up well with the Fibonacci retracement from the highs at 1.13870.
BE AWARE that the ECB Press Conference and Interest Rate decision is imminent in 4 hours. Price action is likely to be volatile around this event. Just something to be aware of if you are trading Euro tonight, don't get caught with your pants down!
Entry: 1.13480
Stop:1.14020
Target 1: 1.12880
Target 2: 1.12610
Best of luck for the rest of the week and beyond,
Luke