EUR.CAD - Bearish Bat Pattern 1.4845On the EUR.CAD 1h chart we have a potential short opportunity at the D leg completion of a Bat Pattern
The price reversal zone on this pair is between 1.4845 & 1.14873
The PRZ zone is only a guideline of where we will be paying attention for trade setups and opportunity's.
Fibonacci Confluence: 88.60% - 1.414% and 1.618%
Potential targets for the Bat Pattern placed at the .382% and .618% retracement of the A to D move.
There is also opportunity to look for extended targets at around 1.4626
Stop loss would be placed above X leg structure resistance.
Website: www.UKForexSignals.com
Instagram: www.Instagram.com
Instagram: www.Instagram.com
Fibonacci-confluence

EUR.AUD - Cypher Pattern + Extra Confluence On the EUR.AUD 15 min chart we have a potential short opportunity at the D leg completion of a Cypher Pattern
The price reversal zone on this pair is between 1.5378 & 1.5400
The PRZ zone is only a guideline of where we will be paying attention for trade setups and opportunity's.
AB-CD completion just above the Cypher pattern at 1.5384
161.80%, 88.60% & 141.40 Fibonacci confluence at the D leg completion.
Potential targets for the Cypher Pattern placed at the 38.20% and 61.80% retracement of the C to D move.
Stop loss would be placed above 1.5400 psychological number X leg structure resistance.
www.UKForexSignals.com
www.Instagram.com
www.Instagram.com

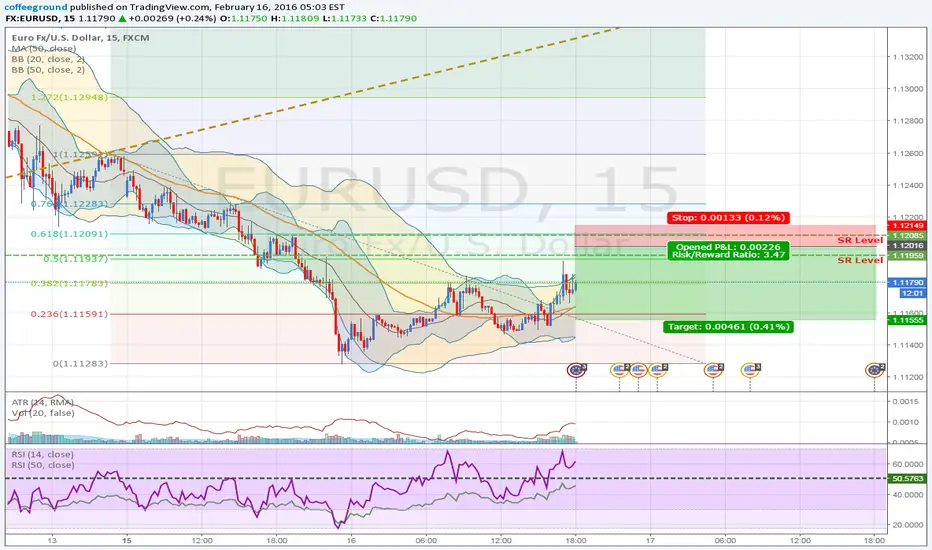
EURUSD: Selling at Supply levelSelling at Supply Level.Supply level also confluence near 61.8% Fibonacci level
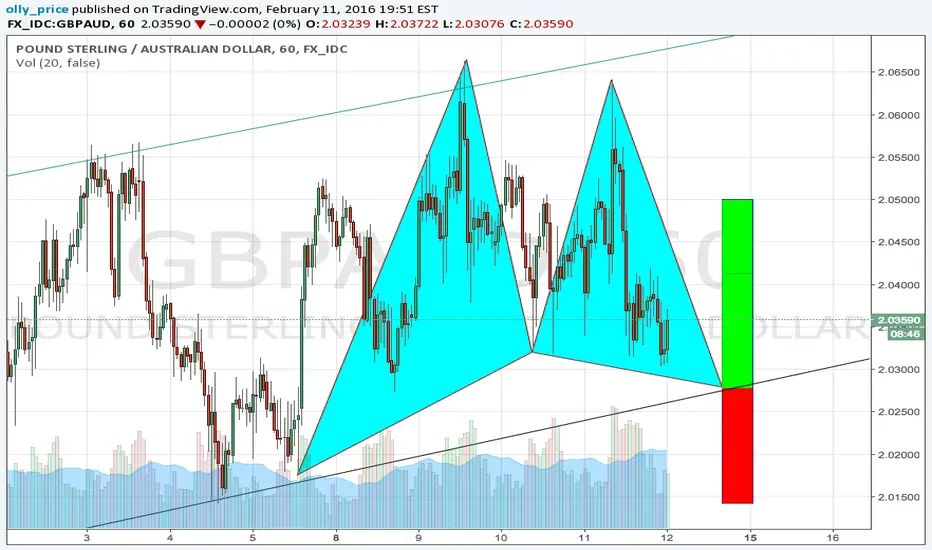
GBPAUD bullish Gartley pattern creating rebound off support.Very good XA:CD 1:1 ratio falling into 0.786 and 1.272 confluence.
Enter the trade at 2.02724. This lands at the support level of the tramline as indicated on the chart by the black lines.
Stop loss based on previous structure.
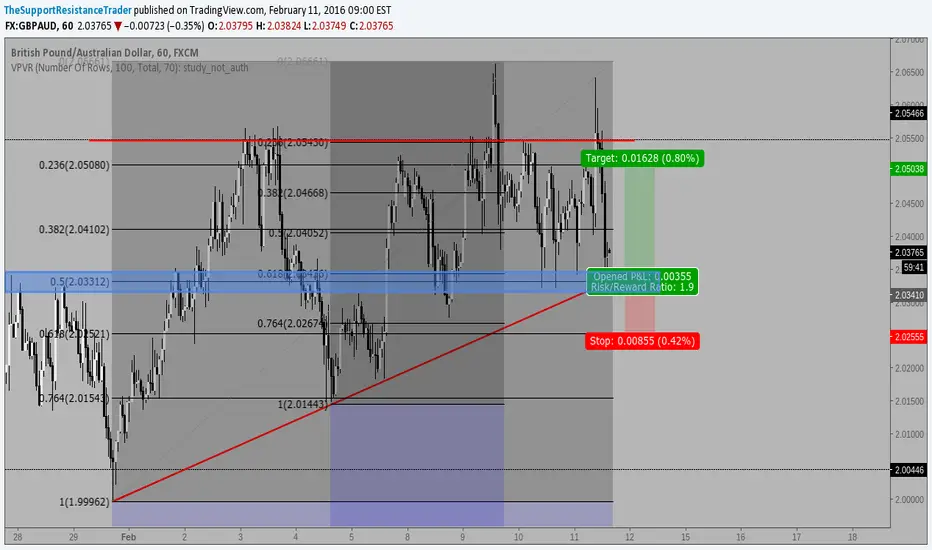
Long GBPAUDTrendline, fibonacci confluence, ascending triangle, structural support and pinbar,
I got in at a little better price as indicated on the chart.
Good luck!
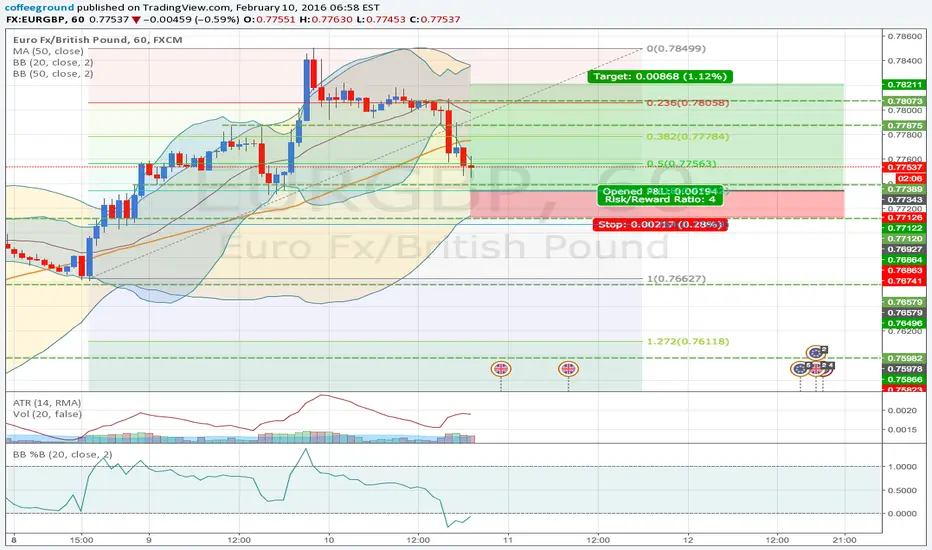
EURGBP: Uptrend continuation. Buying at retracementEURGBP: Uptrend continuation. Buying at retracement. Fibonacci 61.8% also confluence. SL is ATR.
EURGBP / 4HR / SHORT TAKEN ON EGHello and good morning traders!
The first trade today I'm looking at is the EUR/GBP
on the 4hour time frame.
We have a PRZ the markets come up into with FIB
confluence and previous structure.
Our stops are above the swing high above the 1.414%
and looking for targets at a FIB extension at the 127%
with previous resistance becomes new support.
RSI is weakening and we have a high score on our CTS.
Star Prosper
Philip Stewart

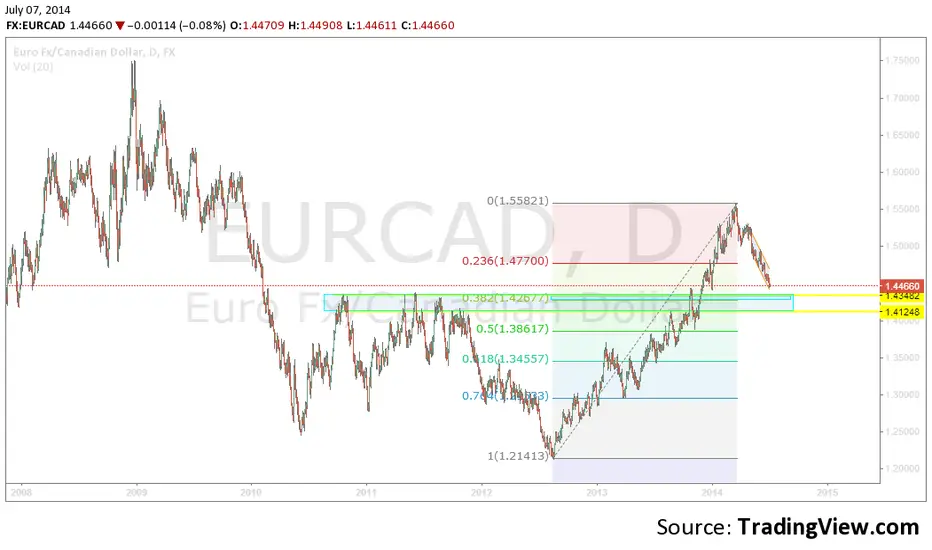
EURCAD Fibonacci and structure confluence pointing up.Technical Outlook
EUR/CAD had a long rally followed by this down channel which cloud end up as a retracement if EURCAD went up.
There is a lot of structure at 1.43482 and there is a fibonacci 3.82 level close right at 1.42677.
I can't say now what this pair will do because it depends on oil prices and fundamentals, but i expect a short term rally when price reaches 1.42677, but i will be looking for other signals like bullish divergence and/or double bottom. So there i will be looking for a counter trend opportunity.
IF ( price reaches 1.42677 and signals a loss of momentum or a bullish divergence or gives a double bottom.)
THEN (I will buy looking for some short-term profits)
Thank you for viewing and if you like my stuff please like and follow. As always good luck and till next idea!