Fibonacci Arcs in Stock TradingFibonacci Arcs in Stock Trading
Fibonacci arcs, derived from the renowned Fibonacci sequence, offer a compelling blend of technical analysis and market psychology for traders. By mapping potential support and resistance areas through arcs drawn on stock charts, these tools provide insights into future price movements. This article delves into the practical applications of Fibonacci arcs in trading, their interplay with market psychology, and best practices for effective use.
Understanding Fibonacci Arcs
The Fibonacci arc indicator is a unique tool in technical analysis derived from the famed Fibonacci sequence. It’s crafted by drawing arcs at the key Fibonacci retracement levels - 38.2%, 50%, and 61.8% - from a high to a low point on a stock chart. Each curve represents potential support or resistance areas, offering insights into the stock’s future movements.
The art of arc reading, meaning interpreting these curves, is crucial for traders. When a stock approaches or intersects with an arc, it reflects a significant reaction level. For instance, if a stock price touches or nears an arc, it could face arc resistance, indicating a potential halt or reversal in its trend.
Applying Fibonacci Arcs in Trading
In the stock market, these arcs serve as a guide for traders seeking to anticipate future price movements. When applied correctly, they can provide critical insights into potential support and resistance levels. Here's a step-by-step look at how you may use them effectively:
- Identifying High and Low Points: Begin by selecting a significant high and low point on the stock's chart. In an uptrend, it’s the most recent swing high to a previous swing low, and vice versa. These are the anchor points.
- Drawing the Arcs: Once the points are selected, draw the arcs at the Fibonacci retracement levels of 38.2%, 50%, and 61.8%. They radiate from the chosen low point to the high point (or vice versa), cutting across the chart.
- Interpretation: Watch how the stock interacts with these lines. When the price approaches an arc, it might encounter resistance or support, signalling a potential change in trend or continuation.
- Timing Entries and Exits: Traders can use the arcs in the stock market as a tool to time their trading decisions. For instance, a bounce could be a signal to enter a trade, whereas the price breaking through might suggest it's time to exit.
Fibonacci Arcs and Market Psychology
The effectiveness of Fibonacci arcs in trading is deeply intertwined with market psychology. They tap into the collective mindset of traders, who often react predictably to certain price levels. The Fibonacci sequence, underlying this tool, is not just a mathematical concept but also a representation of natural patterns and human behaviour.
When a stock nears a curve, traders anticipate a reaction, often leading to a self-fulfilling prophecy. If many traders make an arc stock forecast, they might sell as the price approaches a certain point, causing the anticipated resistance to materialise. Similarly, seeing support at an arc can trigger buying, reinforcing the tool’s power.
This psychological aspect makes Fibonacci arcs more than just technical tools. They are reflections of the collective expectations and actions of market participants, turning abstract mathematical concepts into practical indicators of market sentiment and potential movements.
Best Practices
Incorporating Fibonacci arcs into trading strategies involves nuanced techniques for better accuracy and efficacy. Here are some best practices typically followed:
- Complementary Tools: Traders often pair this tool with other indicators like moving averages or RSI for a more robust analysis.
- Accurate Highs and Lows: It's best to carefully select the significant high and low points, as the effectiveness of the curves largely depends on these choices.
- Context Consideration: Understanding the broader market context is crucial. Traders usually use Fibonacci arcs in conjunction with fundamental factors to validate their analysis.
- Watch for Confluence: Identifying areas where Fibonacci levels converge with other technical signals can provide stronger trade setups.
- Practice Patience: Traders typically avoid making hasty decisions based solely on Fibonacci levels. It's usually better to wait to see additional confirmation from the price action.
Advantages and Limitations of Fibonacci Arcs
Fibonacci arcs are a popular tool in technical analysis, offering distinct advantages and some limitations in analysing stock movements. Understanding these can help traders leverage the tool more effectively.
Advantages
- Intuitive Nature: The Fibonacci sequence is a natural pattern, making the tool intuitive for traders to understand and apply.
- Dynamic Support and Resistance Levels: They provide dynamic levels of support and resistance, unlike static lines, adapting to changing market conditions.
- Versatility: Effective in various market conditions, the arcs can be used in both trending and sideways markets.
Limitations
- Subjectivity in Selection: The effectiveness largely depends on correctly identifying the significant high and low points, which can be subjective.
- Potential False Signals: Like all technical tools, they can generate false signals, especially in highly volatile markets.
- Requires Complementary Analysis: To maximise effectiveness, these curves are usually used alongside other technical indicators, as they are not infallible on their own.
The Bottom Line
Fibonacci arcs are invaluable tools in stock analysis, providing insights into market trends and potential price movements.
This article represents the opinion of the Companies operating under the FXOpen brand only. It is not to be construed as an offer, solicitation, or recommendation with respect to products and services provided by the Companies operating under the FXOpen brand, nor is it to be considered financial advice.
Fibonacci-signals
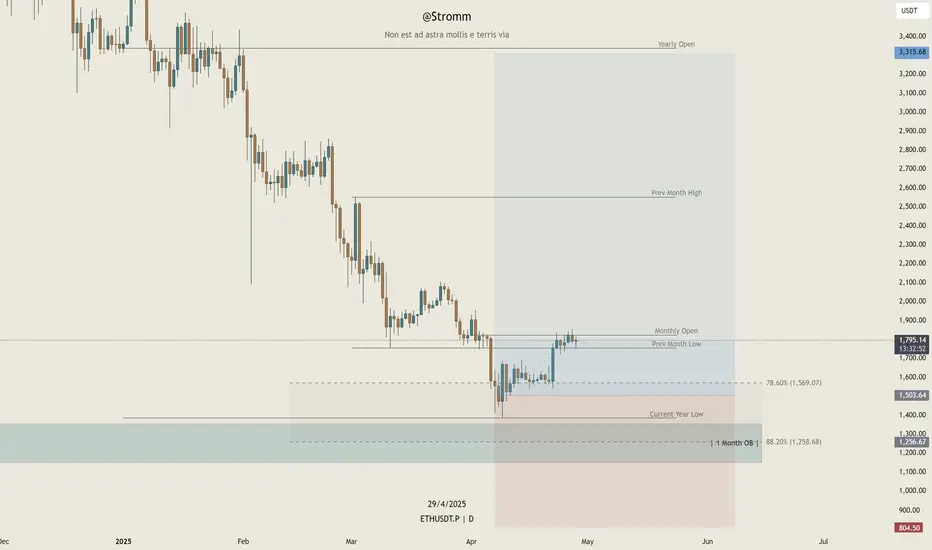
Stromm | ETHEREUM No Life Signal YETCompared to Bitcoin, Ethereum is honestly still moving at a snail’s pace — and the performance is almost embarrassing at this point.
There’s still barely any strength showing on the CRYPTOCAP:ETH chart.
Yes, ETH has finally reclaimed the Previous Monthly Low, and it’s holding it — which is a positive step.
But let’s be real:
We’re still 83% below the Yearly Open — a mind-blowing distance when you consider how BTC is behaving right now.
I'm currently risk-free on my trade here, which is a nice position to be in.
If we get another drop, I plan to add at the next Monthly Order Block.
But something serious needs to happen at the Ethereum Foundation level — real fundamental shifts — if ETH is going to deliver the kind of rally people keep hoping for.
Otherwise?
Everything else in the market is outperforming ETH by a mile — and that’s the worst-case scenario for Ethereum:
It doesn't die,
It just gets left behind.
For now, at least I’m sitting in profit, and that's a good start.
Everything beyond this will need careful watching — no blind assumptions, no blind faith.
ETH needs to prove itself — and fast.
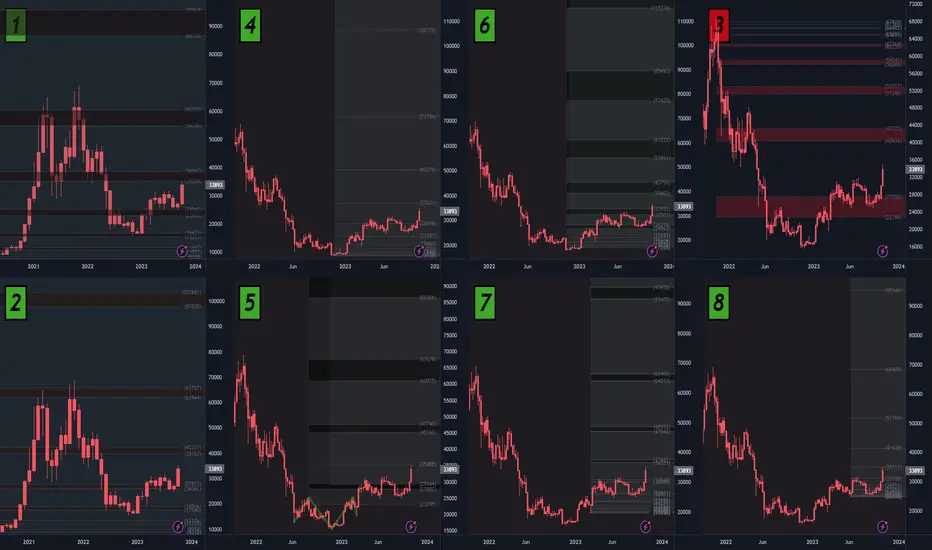
Bitcoin: Bull Run Targets through FibonacciLet me explain. These are all Fibonacci Extensions. The Market Maker is officially done imo so I am very comfortable posting these finished schematics. Many Extensions reach the exact ATH at 69k as you can clearly see...
The Schematics are numbered Chronologically.
#1-#8 are placed in the order they were created.
#3 are the SUPPORT Schematics that are highlighted in RED.
#1 and #2 are monthlies because they are considered longer term.
HOWEVER, every single schematic can affect any timeframe so there is zero bias.
--For anyone thinking, "well theres lines everywhere so whats the point?"
--All of these 'lines' are mathematically perfect so there is no arguing with them because they are all perfect and unique in placement.
The linked idea is my old one... so this new idea is the revamped one. (better)
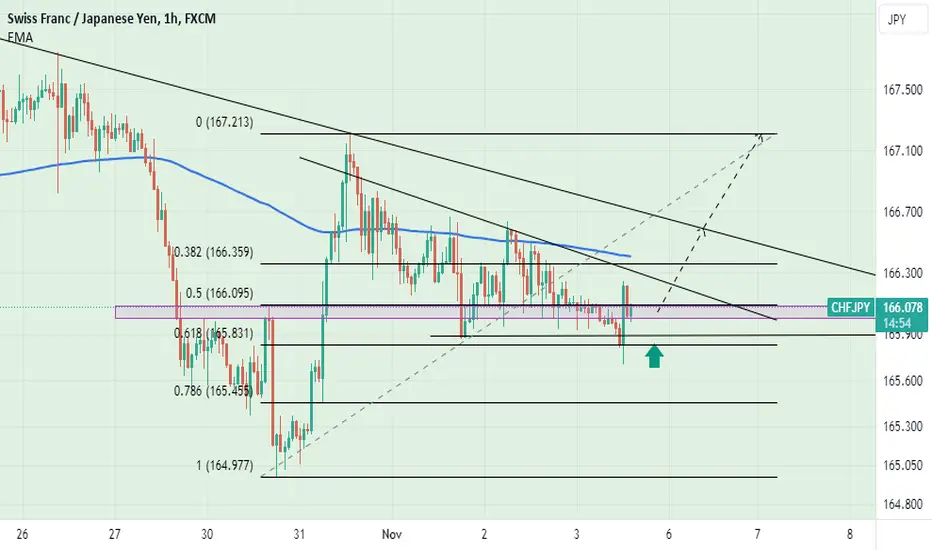
#CHFJPY Buying opportunityHello, everyone. I hope you are all doing well.
Let's dive into the CHFJPY chart and explore a potential buying opportunity in this pair.
As depicted in the chart, the price initially formed a bullish impulsive move, but it has since been undergoing a corrective descent for the past three days.
Today, it appears that the price has cleared out liquidity from the low created yesterday and established a bullish engulfing candle. Additionally, the price is currently situated at a static support area and is backed by support from the 61.8% Fibonacci level.
Given the price's current position at this significant level and considering the favorable risk-to-reward ratio, we are opting to open a position at this price. However, for a more conservative approach, you can choose to wait for the price to break above a short-term bearish trendline that has been constraining the price during this corrective descent.
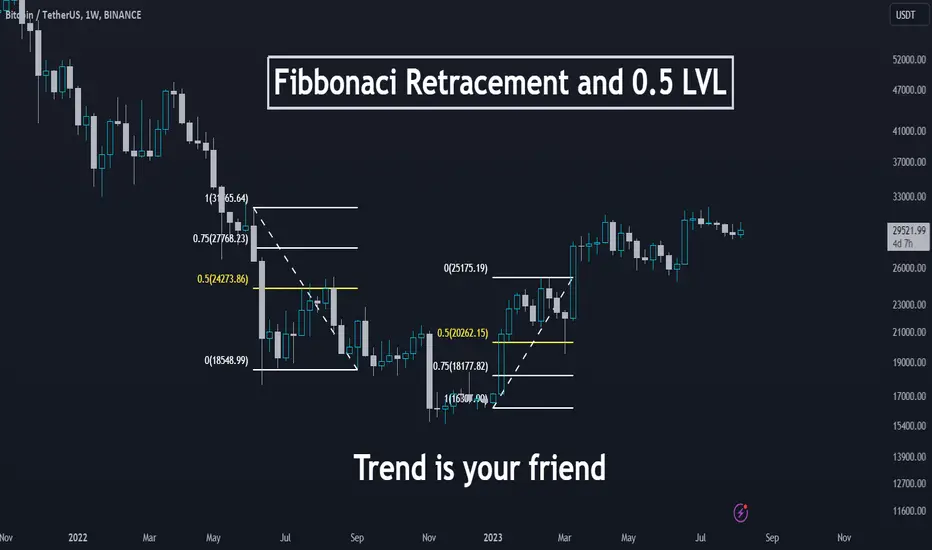
Magic of Fibonacci Levels ✨In the realm of technical analysis, few tools capture the imagination of traders as effectively as Fibonacci retracements and extensions. Derived from the famous Fibonacci sequence, these levels offer insights into potential price reversals, extensions, and trend continuation points. In this article, we'll delve into the world of Fibonacci levels and explore how to use them to enhance your trading decisions.
Understanding Fibonacci Retracements:
Fibonacci retracement levels are like hidden treasures ✨ along a price trend. These levels, calculated from a swing high to a swing low, create horizontal lines that indicate potential support and resistance levels. The most common retracement levels are 23.6%, 38.2%, 50%, 61.8%, and 78.6%.
How to Use Fibonacci Retracements:
Identify a Trend: 📈📉 Begin by spotting a clear trend, either upward or downward.
Select Swing Points: 🏞️ Locate the pivotal swing high and swing low within the trend.
Plot Fibonacci Levels: 📏 Put those retracement levels on your chart, and watch as they highlight potential support or resistance areas.
The Application:
Support Levels: 💪🛡️ During an uptrend, traders often see retracement levels as potential buying zones.
Resistance Levels: ☔ In a downtrend, these levels can be seen as possible areas to consider short trades.
Understanding Fibonacci Extensions:
Fibonacci extensions act like a crystal ball 🔮 projecting potential price targets or levels where the trend might extend. Extension levels include 161.8%, 261.8%, and 423.6%.
How to Use Fibonacci Extensions:
Identify a Trend: 📈📉 As with retracements, spot a well-defined trend.
Select Swing Points: 🏞️ Determine the significant swing low and swing high within the trend.
Plot Fibonacci Extension Levels: 📏 Add those extension levels to your chart, projecting potential price targets.
Few examples :
The Application:
Projection of Trend Continuation: 🚀 Fibonacci extensions hint at where a trend might continue in its existing direction.
Price Targets: 🎯 Traders often utilize extension levels to pinpoint potential price areas before a reversal might occur.
Conclusion:
Fibonacci retracements and extensions are like wizardry in the trader's toolkit. By grasping these levels and their applications, traders can create more informed strategies for entry, exit, and target levels. Remember, while Fibonacci levels are magical, they work best when combined with other technical indicators and chart patterns. As with any trading strategy, practice, experience, and risk management remain essential. With careful consideration and diligent analysis, Fibonacci levels can sprinkle a touch of enchantment to your trading endeavors. 📊✨
CRUDE #WTI#WTI 4h time frame 🔥
⭕ This is just an analysis. If you feel it helps you and this analysis is correct, you can enter the trade at your own discretion with the appropriate volume and SL.

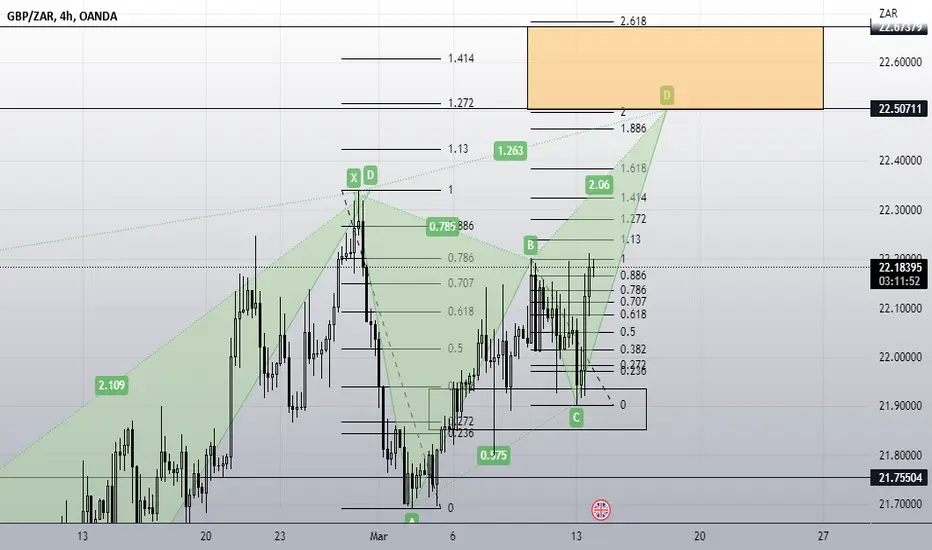
GBPZAR - Bearish Butterfly Pattern H4.The pair shows a beautiful Butterfly pattern forming. Its end point is the beginning of a historic weekly order block. This level hasn't been testes since August of 2020 and it is very likely that there's historically trapped volume at this level and institutional orders are likely to be sitting at this level. The last harmonic projection on this pair from my account was a super success. NB: well harmonic patterns do not always complete so entering into a but is not advised purely based on the projection of a harmonic. Failure of a pattern happens when the pattern fails to complete to D but rather gives a confirmed fail usually at Fib levels 70.7 and 113 respectively. Stay tuned for more updates
LINKUSDT is testing the support right nowLINKUSDT is testing a key level at the $9.1 area, where the market has previously encountered resistance.
This level is important because it has acted as a significant point of resistance in the past, and traders will be closely watching the price action to see if the level is broken. If the price of LINKUSDT is able to break through this key level and establish new support, this could signal a potential bullish trend.
To apply Plancton's Rules in this scenario, traders should wait for the new liquidity and a new breakout to be confirmed before taking a long position. This means waiting for the price to break through the key resistance level and establish new support, which can provide more reliable signals for traders.
So, According to Plancton's strategy , we can set a nice order
–––––
Keep in mind.
🟣 Purple structure -> Monthly structure.
🔴 Red structure -> Weekly structure.
🔵 Blue structure -> Daily structure.
🟡 Yellow structure -> 4h structure.
⚫️ black structure -> <= 1h structure.
–––––
Follow the Shrimp 🦐

BTC/USD analysistrend based on Fib. retracement and trying to check if it already worked in previous session. trying to analyse fibo. retracement on a bigger view thought it is not recommended for others, I try it on my own risk.

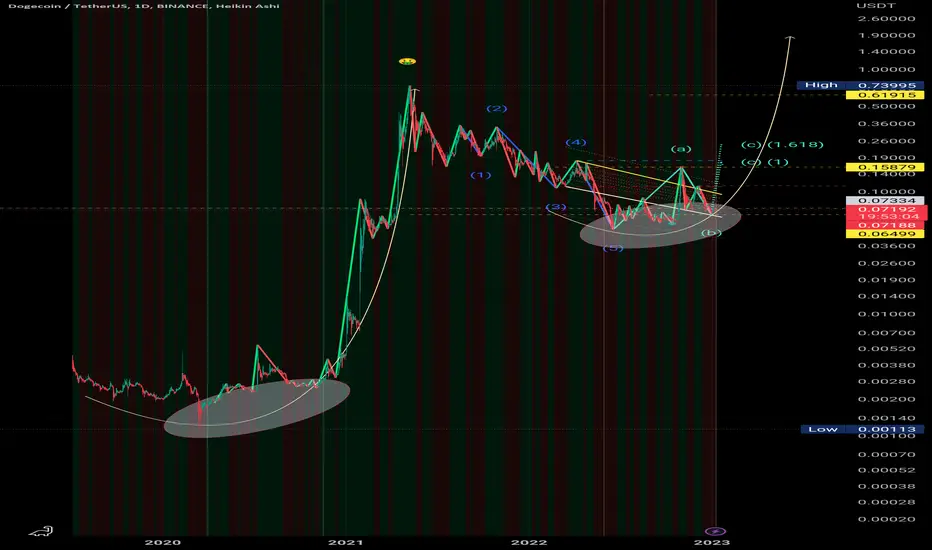
Dogeusdt ,,, Eliot waves, I imagine Dogecoin will go to the moon based on Elliott Waves and Harmonic and Fibonacci patterns.
Btcusdt ,,, New target Bitcoin crossed the cloud and I can expect short-term growth from it, I have drawn targets with lines.

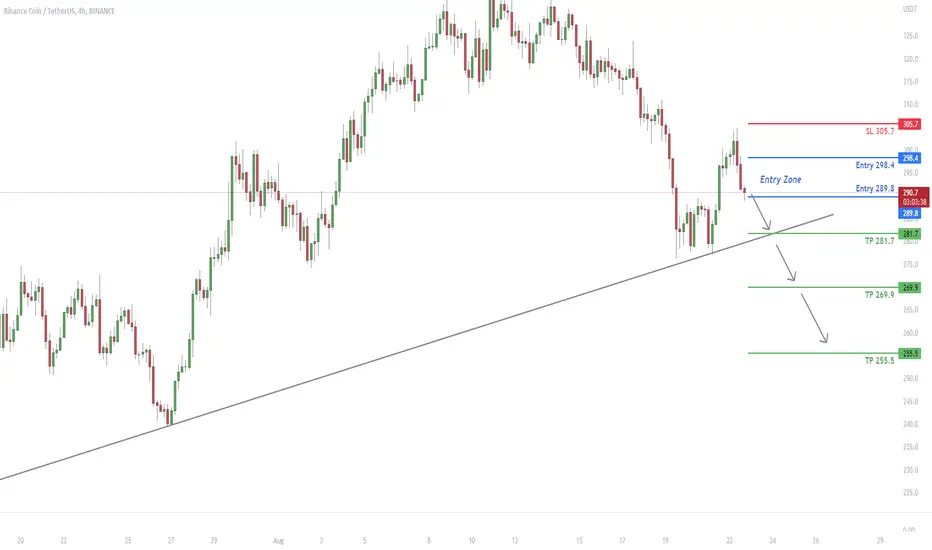
BNBUSDT is going to continue the down trend after the pullbackBNBUSDT is going to continue the down trend after the pullback. It was once rejected from the major support line but the price continues to go lower after the pullback.
💎 BNBUSDT
🔵 Entry zone 298.4- 289.8
🟢 TP1 281.7
🟢 TP2 269.9
🟢 TP3 255.5
🔴 SL 305.7
Good Luck 🎲
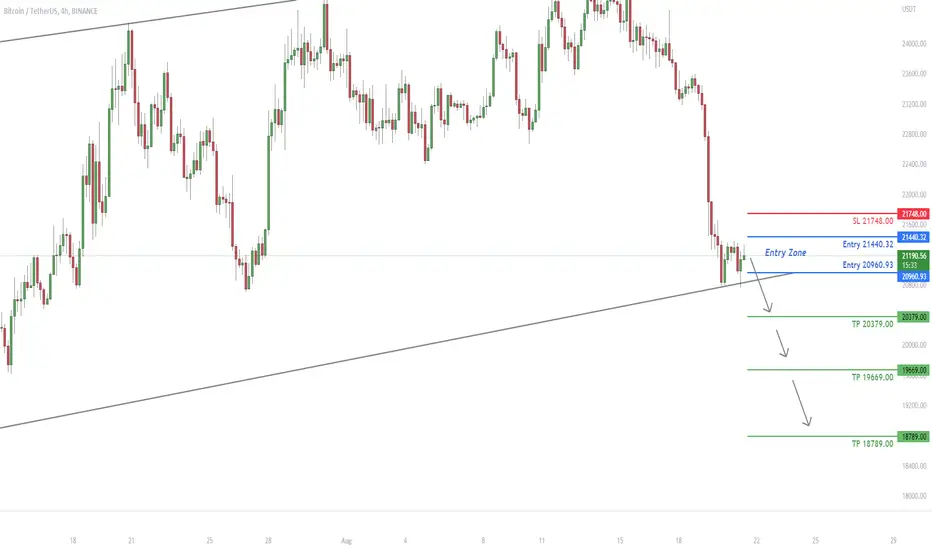
BTCUSDT can break the trendline at anytimeBTCUSDT has moved to the bottom of the flag pattern on H4 and after a sharp move we can clearly see a consolidation at the trendline which is a sign of trend continuation.
💎 BTCUSDT
🔵 Entry zone 21440.32- 20960.93
🟢 TP1 20379.00
🟢 TP2 19669.00
🟢 TP3 18789.00
🔴 SL 21748.00
Good Luck 🎲
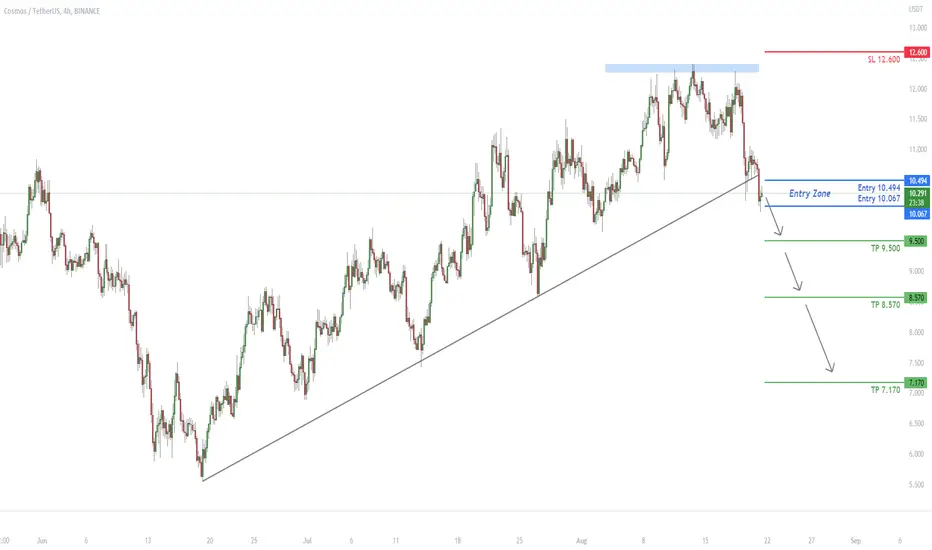
ATOMUSDT Has broken a major trendlineATOMUSDT Has broken a major trendline and we can expect hat the price continues to go lower after the large red candle.
💎 ATOMUSDT
🔵 Entry zone 10.494- 10.067
🟢 TP1 9.500
🟢 TP2 8.570
🟢 TP3 7.170
🔴 SL 12.600
Good Luck 🎲
ETHUSDT has broken below the Wedge patternETHUSDT has broken below the Wedge pattern, there is a potential that the price continues to go lower. The price can go lower down to 1510.79
💎 ETHUSDT
🔵 Entry zone 1861.79- 1806.73
🟢 TP1 1767.41
🟢 TP2 1669.27
🟢 TP3 1510.79
🔴 SL 1938.92
Good Luck 🎲

SHIBUSDT can continue the uptrend SHIBUSDT can continue the uptrend after breaking above the triangle. The price can continue it's uptrend after the pullback.
💎 SHIBUSDT
🔵 Entry zone 0.00001503- 0.00001611
🟢 TP1 0.00001769
🟢 TP2 0.00001971
🟢 TP3 0.00002188
🔴 SL 0.00001370
Good Luck 🎲

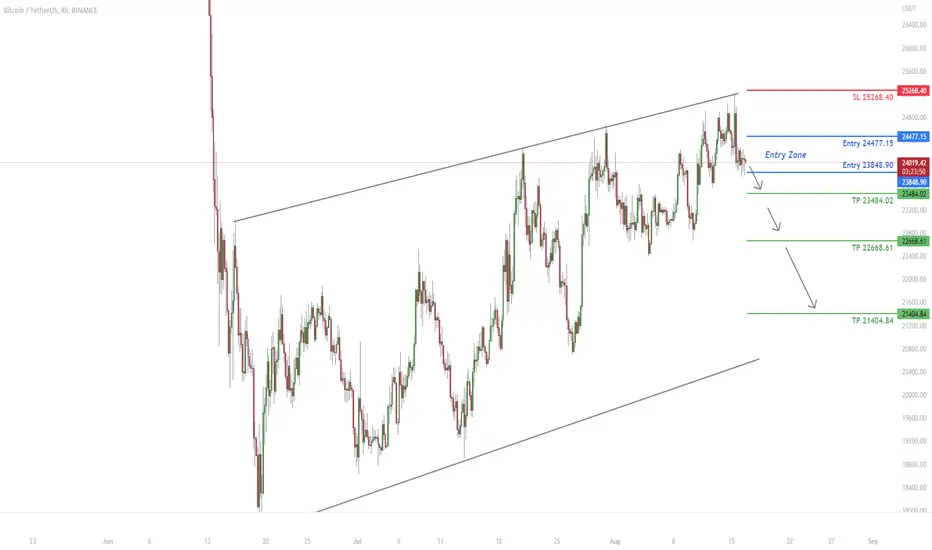
BTCUSDT can go all the way down to the bottom of the channel BTCUSDT after several rejections from the top of the channel can go all the way down to the bottom of the channel . here are the potential TPs and SL
💎 BTCUSDT
🔵 Entry zone 24477.15- 23848.90
🟢 TP1 23484.02
🟢 TP2 22668.61
🟢 TP3 21404.84
🔴 SL 25268.40
Good Luck 🎲
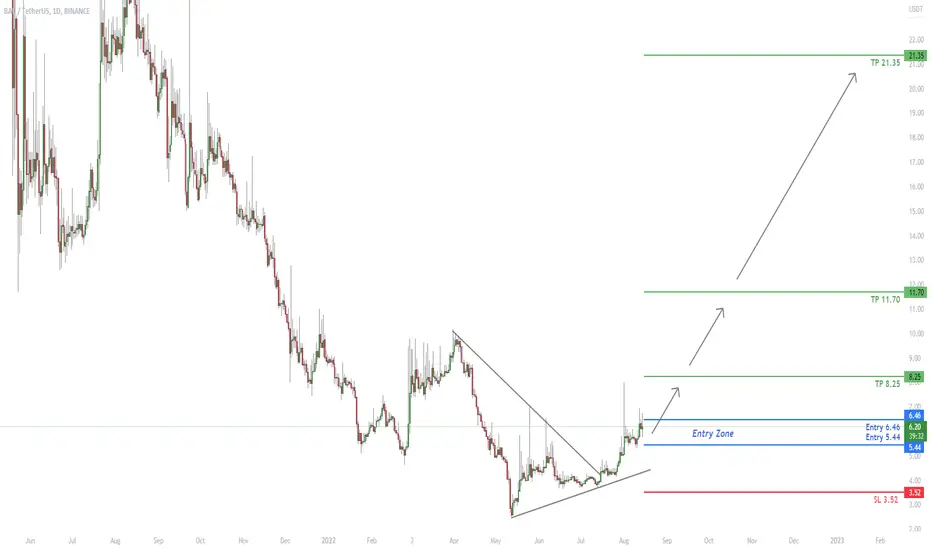
BARUSDT Has broken above the major resistanceBARUSDT Has broken above the major resistance. It has also has been making HHs and HLs. We can expect that the price continues to go higher.
💎 BARUSDT
🔵 Entry zone 5.44- 6.46
🟢 TP1 8.25
🟢 TP2 11.70
🟢 TP3 21.35
🔴 SL 3.52
Good Luck 🎲
SLPUSDT Has broken above the trendlineSLPUSDT Has broken above the trendline after several rejections at the major support zone. We can expect that the price continues to go higher.
💎 SLPUSDT
🔵 Entry zone 0.00497 - 0.00555
🟢 TP1 0.00600
🟢 TP2 0.00750
🟢 TP3 0.00970
🔴 SL 0.00450
Good Luck 🎲

TRADE OF THE WEEK | Great Breakout Trade 💰
Hey traders,
This week, we caught together a nice short trade on silver.
The market reached a key daily structure resistance and we were patiently waiting for a confirmation to sell.
Our confirmation was a breakout of a support line of a rising wedge pattern.
Short position was opened on a pullback.
The market dropped nicely then giving us 500 pips of a pure profit!
Did you catch this move?
❤️If you have any questions, please, ask me in the comment section.
Please, support my work with like, thank you!❤️

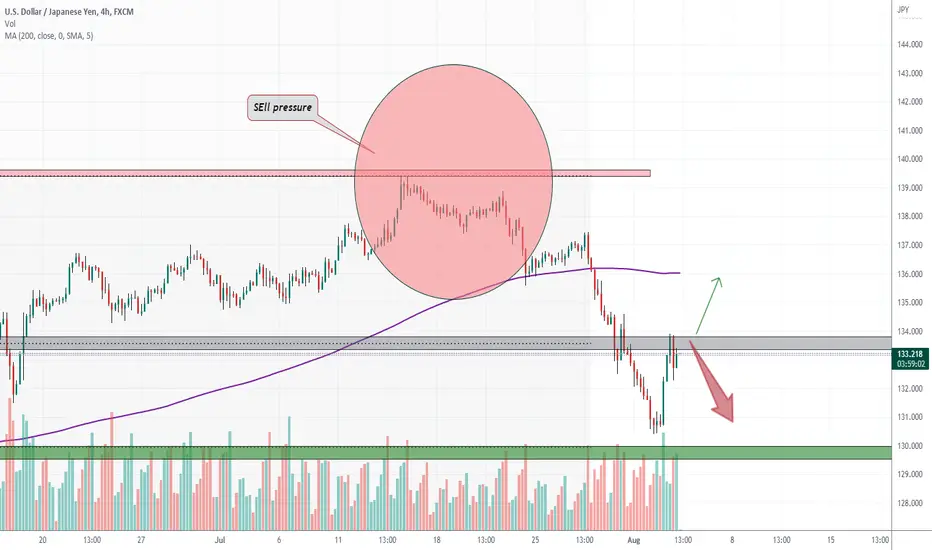
USDJPY possible paths our short hit the +700pips Target:
then we open long and earn more 200 pips profit:
Now price can fall again and touch 130.00 or if this black resistance zone here breaks more pump is expected to 135.90
((press like👍 if you enjoy + comment your opinion about the market or your thoughts, below this analysis))
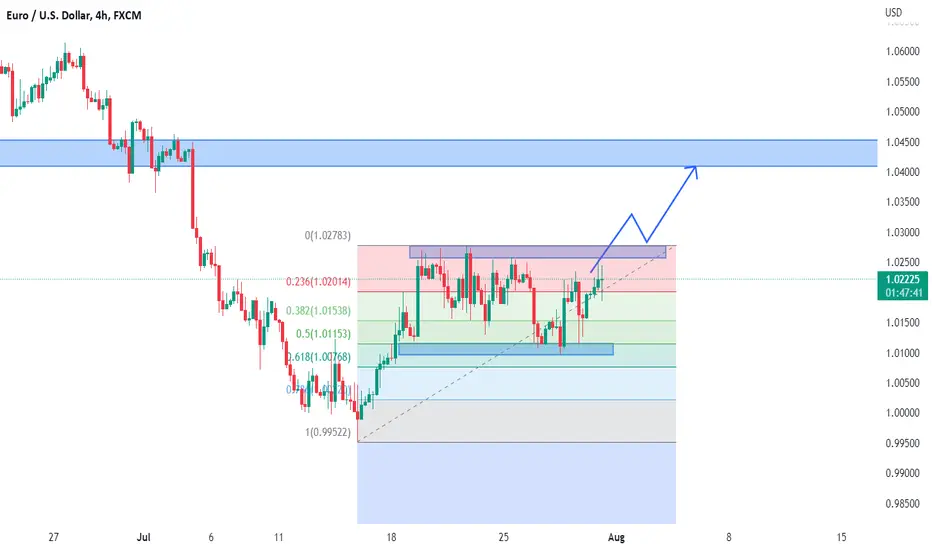
EURUSD going upside! BUY!Hi Traders!
EURUSD on the 4H chart after the low started to move to the upside. Waiting for the breakout and the retest. My goal is resistance 1.04100.
If you have your own opinion, write in the comments. It would be nice to compare our ideas📈.