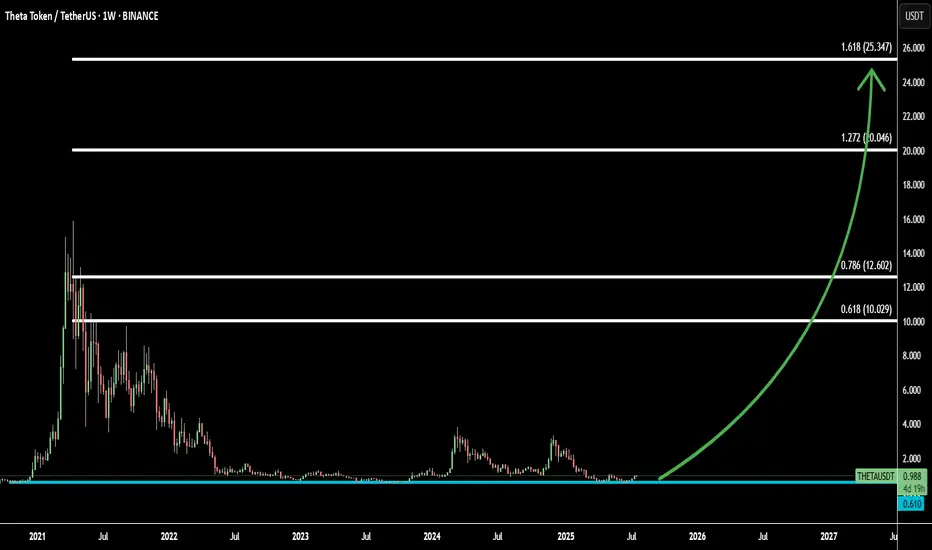
THETA in Markup Phase: 4 Fibonacci Targets from Cycle BottomEven without a full altseason, THETA (THETAUSD) appears to be transitioning into a markup phase from its deepest correction zone. Price action suggests that THETA has likely bottomed out, making this one of the most reliable buying opportunities among altcoins right now.
Technically, THETA is breaking out from long-term accumulation with strong support beneath, and the risk-reward is highly favorable at these levels.
Using Fibonacci extensions, we identify 4 major upside targets:
Target 1: 0.618 Fib — 10.029 - initial momentum and breakout confirmation
Target 2: 0.786 Fib — 12.609 - mid-cycle resistance zone
Target 3: 1.272 Fib — 20.046 - extended move aligned with historical levels
Target 4: 1.618 Fib — 25.347 - full markup potential and trend peak target
This structure suggests that THETA may not wait for altseason—it's building strength independently. The chart is aligned for a macro trend reversal.
Fibonacci
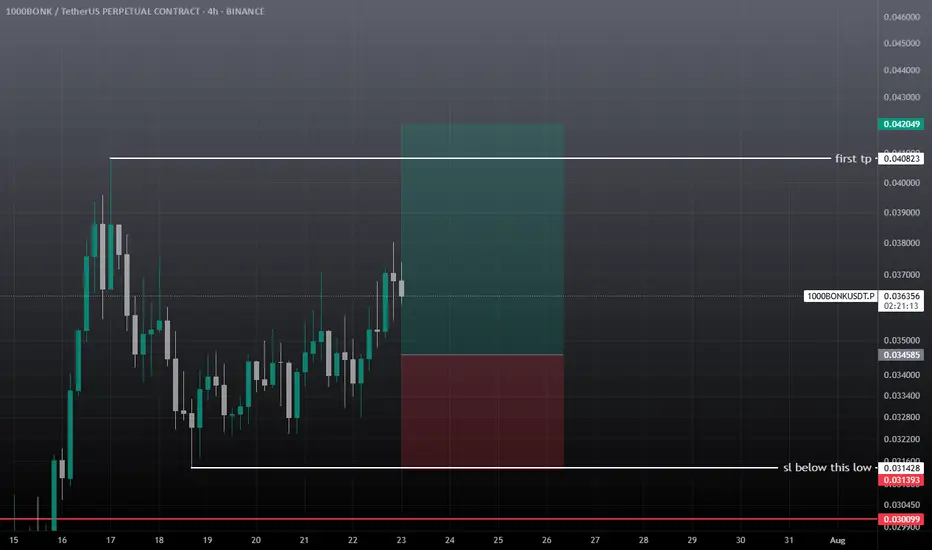
Bonk USDT Buy / Long SetupBonk performing well among all meme sectors, wait for the entry and take risk, if tp hits first then ignore. I already shared this setup on my group, we closed the trade at minor profit, but now this is showing strong momentum on 1hr tf also, that's why sharing.
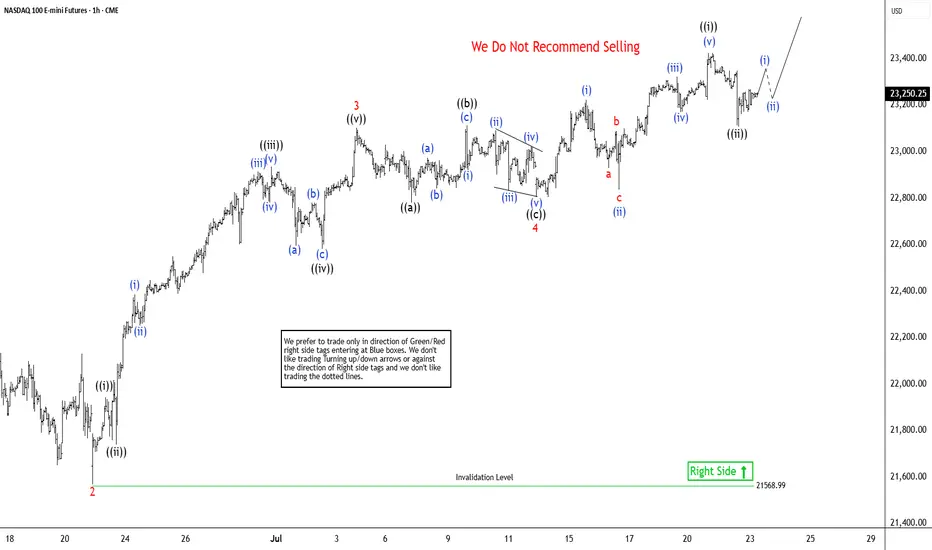
Elliott Wave View: Nasdaq Futures (NQ_F) Poised To Extend HigherThe Nasdaq Futures (NQ_F) favors higher in bullish impulse sequence from April-2025 low. It already broke above December-2024 high & expect short term pullback in 3, 7 or 11 swings to remain supported. Impulse sequence unfolds in 5, 9, 13, 17, 21….. swings count. It ended daily corrective pullback in double correction at 16460 low of 4.07.2025 low. On daily, it should extend into 28864 – 26152 area to finish April cycle before next pullback start. Above there, it favors rally in (3) of ((1)). It placed (1) of ((1)) at 21858.75 high, (2) at 21071.50 low as shallow connector & favoring upside in 5 of (3) against 7.13.2025 low. Every pullback after 4.21.2025 low was shallow & unfolded in 3, 7 or 11 swings calling for more upside as long as it stays above 5.30.2025 low. Within (3), it ended 1 at 22222 high, 2 at 21566.75 low, 3 at 23102.50 high, 4 at 22803 low & favors upsides in 5 of (3). Wave 4 as flat correction ended in 7.13.2025 low of 22803 low.
Below 3 of (3) high, it placed ((a)) at 22779.75 low, ((b)) at 23112 high & ((c)) at 22803 low as flat connector against 6.22.2025 low. Above there, it ended ((i)) at 23424.75 high as diagonal & ((ii)) at 23108 low in 3 swing pullbacks. Above there, it should continue rally in ((iii)) of 5, which will confirm above 23424.75 high to avoid double correction. Within ((i)), it placed (i) at 23222.75 high, (ii) at 22835.5 low, (iii) at 23320.75 high, (iv) at 23169.50 low & (v) at 23424.75 high. Currently, it favors upside in 5 of (3) into 23493.5 – 23934.5 area, above 7.13.2025 low before (4) pullback. Based on swing sequence, it already has enough number of swings in (3) to call the cycle completed. But as long as it stays above price trendline, passing through 2 & 4, it should continue upside into extreme area. We like to buy the next pullback in 3, 7 or 11 swings at extreme area for intraday rally. It favors upside in April-2025 cycle & expected to remain supported in (4) & later in ((2)) pullback as next buying opportunity.
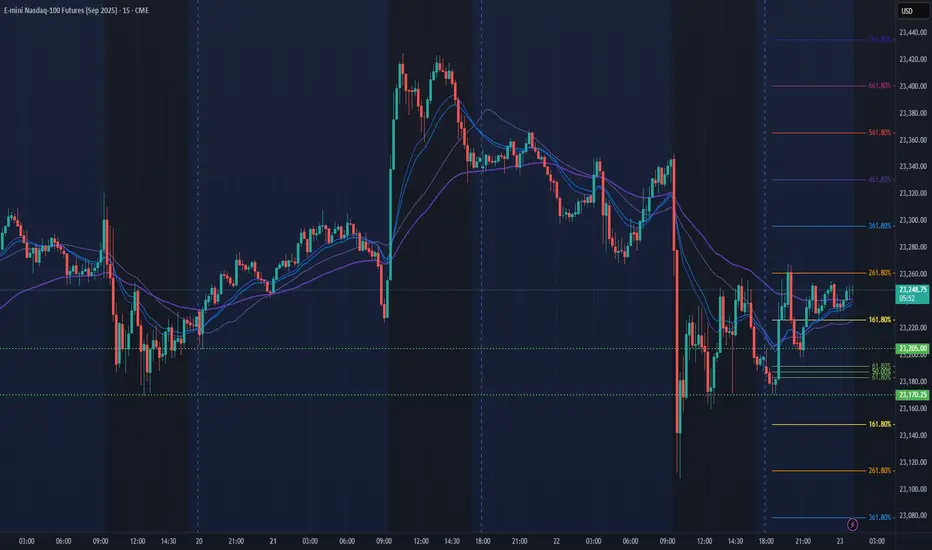
NQ Power Range Report with FIB Ext - 7/23/2025 SessionCME_MINI:NQU2025
- PR High: 23205.00
- PR Low: 23170.25
- NZ Spread: 77.75
Key scheduled economic events:
10:00 | Existing Home Sales
10:30 | Crude Oil Inventories
Session Open Stats (As of 12:25 AM 7/23)
- Session Open ATR: 261.82
- Volume: 34K
- Open Int: 270K
- Trend Grade: Neutral
- From BA ATH: -0.7% (Rounded)
Key Levels (Rounded - Think of these as ranges)
- Long: 23811
- Mid: 22096
- Short: 20383
Keep in mind this is not speculation or a prediction. Only a report of the Power Range with Fib extensions for target hunting. Do your DD! You determine your risk tolerance. You are fully capable of making your own decisions.
BA: Back Adjusted
BuZ/BeZ: Bull Zone / Bear Zone
NZ: Neutral Zone
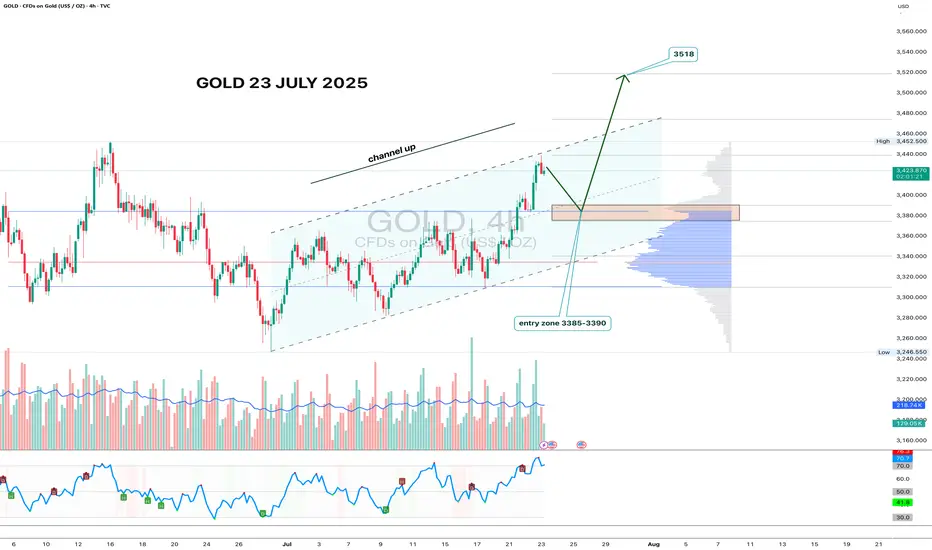
Gold 4H - channel breakout, looking for 3518 nextGold has formed a clean ascending channel on the 4H chart, broke out above resistance, and is now pulling back into the 3385–3390 zone. This area aligns with volume clusters - a perfect entry zone for bulls waiting on the sidelines.
If price holds this zone and prints a reversal candle with volume, the upside target remains at 3518 - the 1.618 Fibonacci extension and historical resistance. Volume increased during the breakout move, confirming interest. RSI still has room to go higher, supporting the bullish continuation.
Fundamentally, gold remains a safe-haven asset amid geopolitical tension, USD weakness, and potential Fed easing. Central bank accumulation further supports the bullish case.
Tactical setup:
— Entry zone: 3385–3390
— Trigger: candle confirmation + volume
— Target: 3518
— Invalidation: break below 3360 without buyer volume
If the plan plays out — gold might shine bright while bears squint in disbelief.
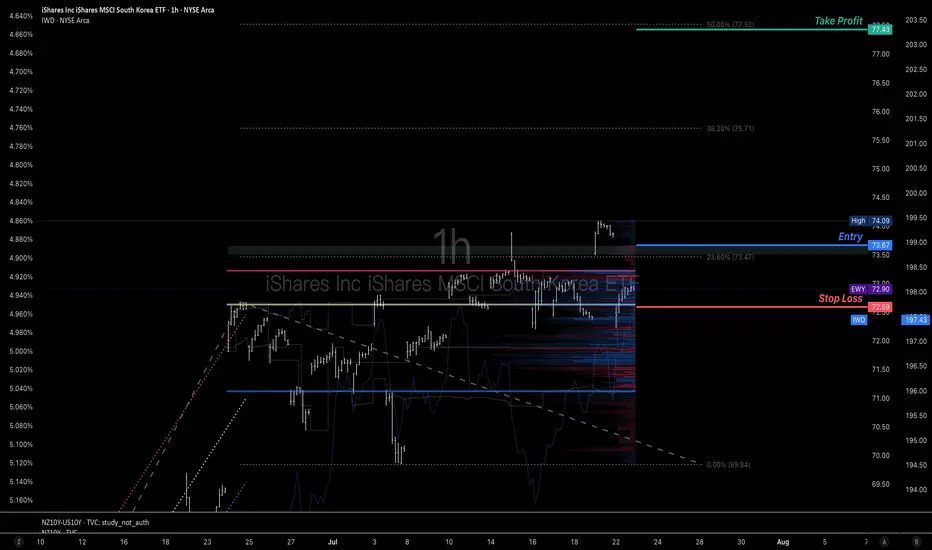
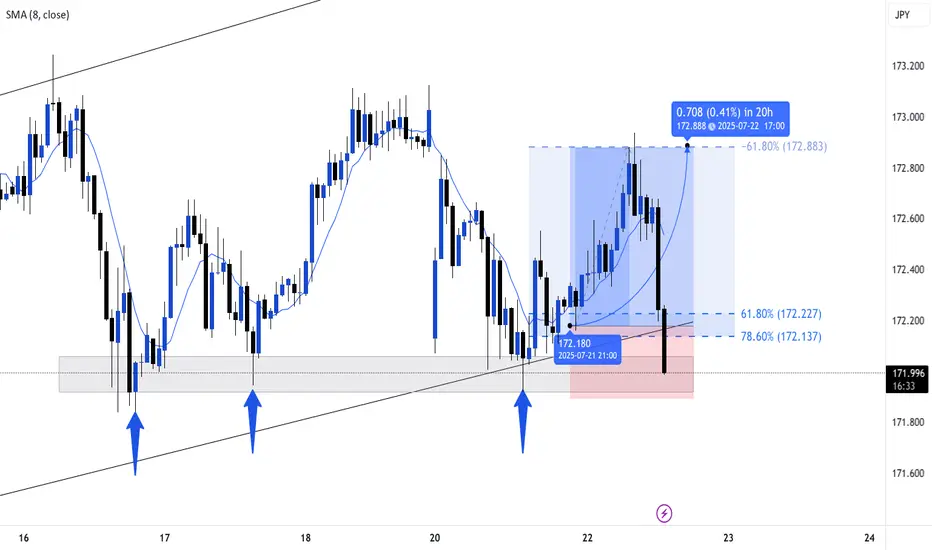
A potential chance to get long position of Korean equity marketsKorean economy and stock market emotion are well boosted by their regulation reform and new president elect. Many global traders miss the previous uptrend and the price is about to test the current resistance again.
Imma use a buy stop order @73.67 to try to get in the train to diverse my long position on equity market.
If you only do swing trades, there's a long swing trade plan on my chart. I may use the latest to take half of profit once the price hit the first or second resistance @77.43 above the current trading area to control the position size that can fit for long term trade.
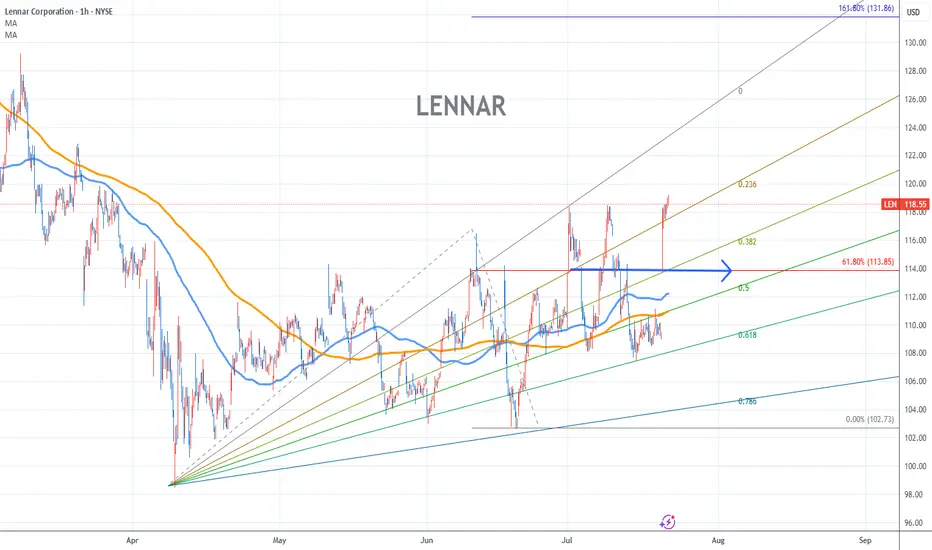
LENNAR Stock Chart Fibonacci Analysis 072225Trading Idea
1) Find a FIBO slingshot
2) Check FIBO 61.80% level
3) Entry Point > 114/61.80%
Chart time frame:B
A) 15 min(1W-3M)
B) 1 hr(3M-6M)
C) 4 hr(6M-1year)
D) 1 day(1-3years)
Stock progress:A
A) Keep rising over 61.80% resistance
B) 61.80% resistance
C) 61.80% support
D) Hit the bottom
E) Hit the top
Stocks rise as they rise from support and fall from resistance. Our goal is to find a low support point and enter. It can be referred to as buying at the pullback point. The pullback point can be found with a Fibonacci extension of 61.80%. This is a step to find entry level. 1) Find a triangle (Fibonacci Speed Fan Line) that connects the high (resistance) and low (support) points of the stock in progress, where it is continuously expressed as a Slingshot, 2) and create a Fibonacci extension level for the first rising wave from the start point of slingshot pattern.
When the current price goes over 61.80% level , that can be a good entry point, especially if the SMA 100 and 200 curves are gathered together at 61.80%, it is a very good entry point.
As a great help, tradingview provides these Fibonacci speed fan lines and extension levels with ease. So if you use the Fibonacci fan line, the extension level, and the SMA 100/200 curve well, you can find an entry point for the stock market. At least you have to enter at this low point to avoid trading failure, and if you are skilled at entering this low point, with fibonacci6180 technique, your reading skill to chart will be greatly improved.
If you want to do day trading, please set the time frame to 5 minutes or 15 minutes, and you will see many of the low point of rising stocks.
If want to prefer long term range trading, you can set the time frame to 1 hr or 1 day.
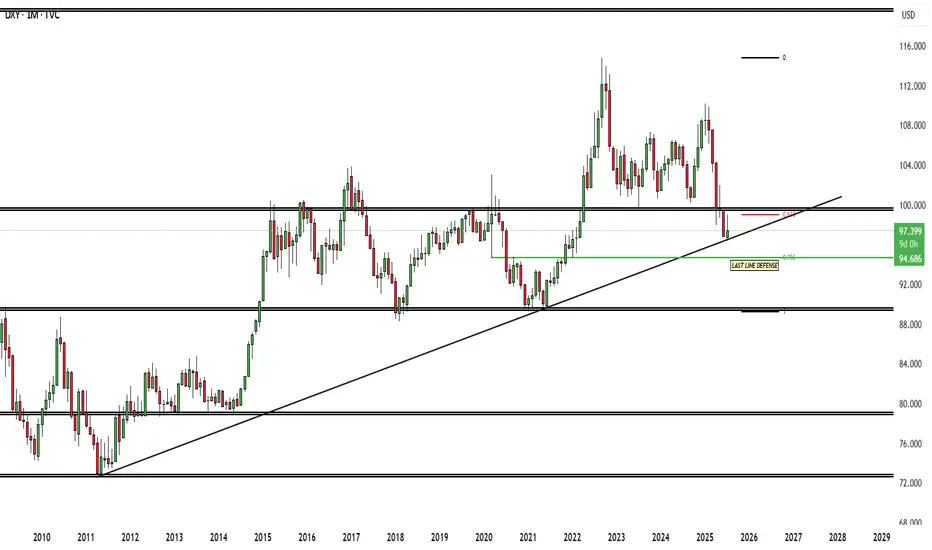
DXY BULLISHWe sitting on a trendline third touch and also in confluence with a 61.8% level once we hold we should see a takeoff or highest we dump into $94 then we takeoff
SOLUSDT 1H Short-Term🔍 Technical Structure:
Short-Term Trend:
SOL is currently in an uptrend, with local higher lows. This is evident from the orange uptrend line, which has been tested multiple times.
Local Resistance:
205.14 USDT – yellow line – a resistance level that the price has touched several times but failed to break (this could be a double-top formation).
Local Support:
198.48 USDT – the price is currently testing this level as support.
194.36 USDT – lower, more crucial support (stronger upon a trend breakout).
187.74 USDT – important support that would be tested in the event of a larger breakout.
📉 Oscillator – Stoch RSI:
The Stoch RSI is currently in oversold territory (below 20), suggesting the possibility of a local rebound.
However, there has been no upward crossover yet, so there is no strong buy signal.
🔊 Volume:
We are observing a decrease in volume during the current correction, suggesting that the declines are relatively weak – there is no strong supply impulse.
🧠 Short-term scenarios:
✅ Bullish scenario:
Price is rebounding from the trend line (orange) and the 198.48 USDT level.
A break of the 205.14 USDT resistance could open the way to:
209.37 USDT
216.02 USDT (next target)
❌ Bearish scenario:
A break of the trend line and the 198.48 USDT level with the 1-hour candle closing below.
Possible decline to:
194.36 USDT (first support)
and further to 187.74 USDT if selling pressure increases.

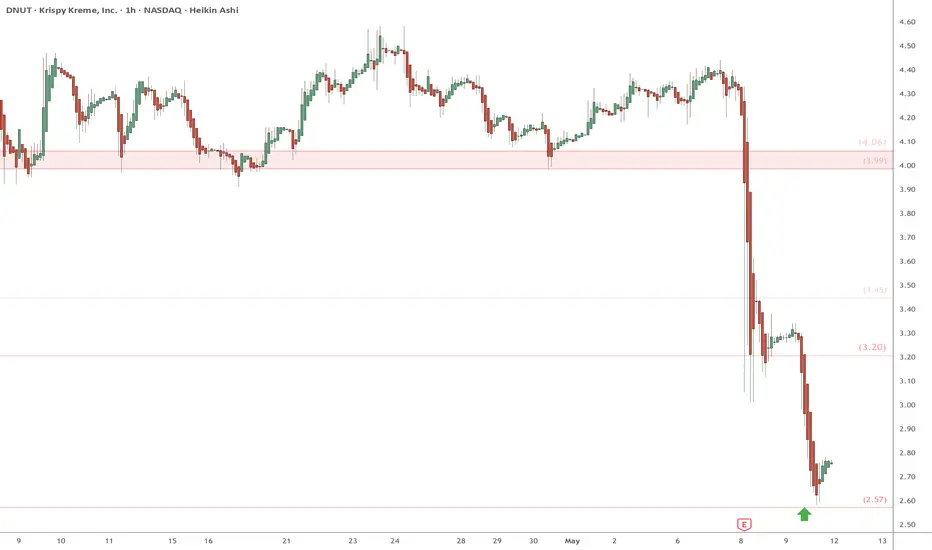
DNUT eyes on $2.57: if this HAS a bottom, THIS may be the oneDNUT has been in free fall since IPO.
Last Earnings were apparently horrible.
But there is a glimmer of hope of bottom.
$2.57 is a minor but significant fib.
The PING bounce on it is of interest.
"Ping" from "give me a ping Vasilly".
=====================================
.
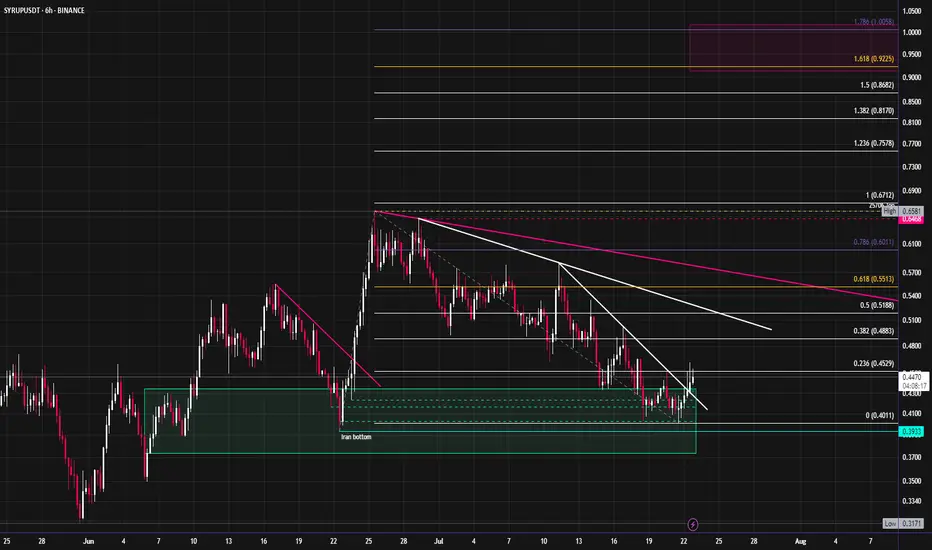
Syrup looks ready to start moving towards new ATH'sCRYPTOCAP:SYRUP has started to break out of its downtrend after revisiting the June lows. It has outperformed most of the market since April, with this month's pullback being an exception. I expect an aggressive move up into new highs. The fibs around $1 look like a good target for the short term, this would also be ~1b mc.
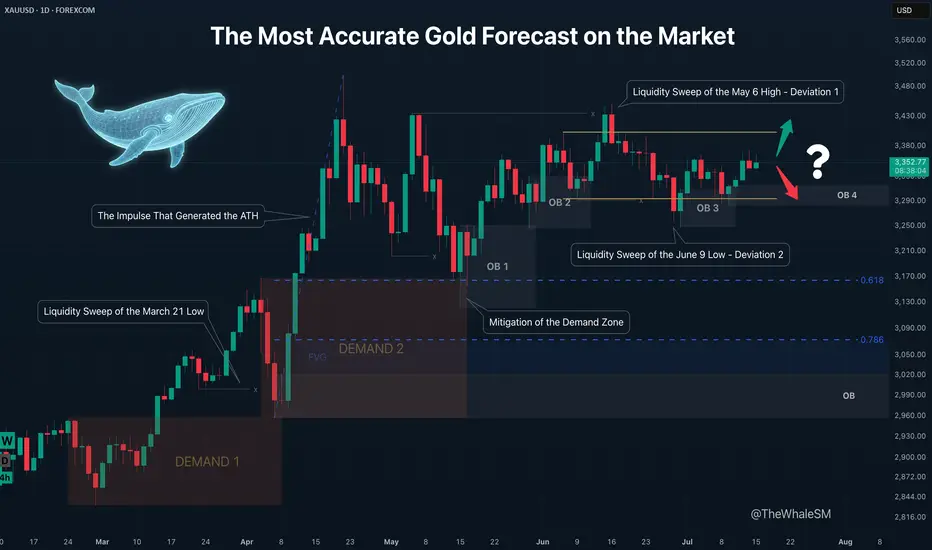
The Most Accurate Gold Forecast on the MarketThis is a continuation of sorts of my educational article that received an "Editor's Pick" from TradingView and a large number of positive reactions from this amazing trading community. However, unlike that post, this is a trade idea that outlines clear entry conditions for when the price reaches a relevant manipulation zone and shows a reversal reaction. If you don't want to get into the details and trace the entire chain of events through which large capital brought the price to its current levels, feel free to skip the intro and go straight to the 4H chart with the long setup conditions.
To better understand the logic of "smart money," let's revisit the Gold daily timeframe from my educational article:
We will approach this analysis like detectives, following the facts and footprints in the style of Sherlock Holmes and Hercule Poirot.
So, let's begin our investigation. On the daily structure, we see a clear order flow confirming the intention of large capital to lead the price in continuation of the uptrend. After the latest impulse that began on February 28th and ended on April 3rd, the price corrected and mitigated the DEMAND1 manipulation zone. The "Whale" refueled with liquidity, eliminated some competitors, closed its losing short positions used for the manipulation, and gained energy for the next impulse that set a new ATH. The correction that mitigated the DEMAND1 zone was nothing other than the next manipulation, also in the form of a DEMAND zone, within which there is a still-valid daily order block. How can we assert that DEMAND 2 is a manipulation and not just a correction?
Firstly, the sharp nature of the move swept liquidity from the March 21st low. Secondly, the sharp upward impulse accompanied by a series of FVGs showed the Whale's true intention. And thirdly, the reversal from this DEMAND 2 zone, combined with the 61.8% Fib retracement level, resulted in the formation of the next manipulation in the form of the OB 1 order block. Further, we see the continuation of the order flow on this daily structure; the price reacts to OB1, forming another order block, OB2 . The impulse from OB2 sweeps liquidity from the May 6th high. Many might have expected a continuation of the impulse and a new ATH instead of a sweep of this high, but as often happens when too many participants pile into one direction, the price sharply reverses and liquidates their positions. This intense decline after sweeping the high looked something like a local trend change from bullish to bearish, but the sharp recovery after sweeping the liquidity from the June 9th low and forming a new order block, OB 3 , finally revealed what was really happening: it turned out to be a range . It's impossible to identify a range until it is fully formed. A range is another type of manipulation where internal and external liquidity is swept from both sides. In our case, there was first a deviation above (Deviation 1 on the chart), then a deviation below (Deviation 2), after which the price swept some internal liquidity and got stuck exactly in the middle of the range.
And finally, after all our investigations and deductions, we can say with absolute certainty, practically with 100% confidence divided by two, that ABSOLUTELY NO ONE KNOWS where the price will go from the current levels. Because the center of a range is a state of complete uncertainty. Moreover, I dare to suggest that even the Whales don't know where the price will go right now. They certainly have enormous funds to sharply move prices at the right moments to capture liquidity and conduct manipulations. At other times, they can nudge the market to create a trend and direct it like a chain reaction of falling dominoes. But the entire market is much larger, and if its sentiment changes drastically due to external factors, smart money won't waste its resources fighting it. Their goal is to make more money, nothing personal. Why else is the price stuck in the middle right now? Inflation data is coming out soon, which could push the price in an unpredictable direction. The Whales will wait to use this news-driven impulse to their advantage.
So, what have we concluded from this investigation? Was it all in vain since we can't even say with 51% probability where the price will go next? Of course not. We simply need to wait for the price to reach an area where the probability of it moving in a certain direction is significantly higher than 50% — that's all you need to be profitable in the long run. This probability will never be close to 100% because we don't know what's really happening in the depths of the market. Are the Whales accumulating positions in this range now, or are they selling off at high prices after the ATH? Unless you are one of the few direct participants in large capital, you can't know this. Moreover, you don't need to know it to make a consistent profit in the market. It is enough for us to predict the next move of smart money with high probability at certain moments, join their movement, and take our profit. It's like a weather forecast: the further from the current date, the lower the probability of it being accurate. It's the same with the market; a completely unpredictable combination of factors, news, and hidden internal processes can lead the price on a unique path, but always accompanied by smart money. It doesn't matter where the gold market goes next, whether to a new ATH or down to the next correction level. When the Whale reveals itself again by leaving a trail in the form of a manipulation, we can lie in wait near it and join its next move. Why is it generally a good idea to enter from manipulation zones? You are essentially stepping onto a field where the Whale has already cleared the liquidity, and it has returned to that place for other business — to close its losing positions. That is, a mitigated manipulation zone is a safer place to enter the market; there's a much lower chance the Whale will absorb your position. Right now, we have such a manipulation in the form of the OB 4 order block, and we can switch to the 4H timeframe to look at a potential entry zone in more detail.
4H CHART - SETUP CONDITIONS
So, we already know the general context: the price is inside a range. After the second deviation, it has already reacted to the order block formed after it, and we are waiting for the mitigation of the next one, OB 4 , which will serve as a pivot point for a potential setup. A reversal from this order block will confirm the order flow for the price to move at least to the upper boundary of the range. The presence of a manipulation zone alone is not enough to open a position; additional confirming conditions are always needed. As one such condition here, we can take the combination of mitigation with one of the Fibonacci retracement levels — 61.8% or 78.6%. Upon reaching each level, the price must hold (not be broken by the bodies of 1-4H candles) and show a reversal reaction. The final confirmation for entry will be an LTF confirm in the form of a break of structure (BOS) or the beginning of order flow on a lower timeframe. An important part of the context is that important US inflation news is coming out soon, and positions should not be opened right before it or for some time after (at least an hour).
Invalidation of the long scenario would be a break below the 78.6% level and OB 4.
~~~~~~~~~~~~~~~~~~~~~~~~~~~~~~~~~~~~~~~~~~~~~~~~~~~~~~~~~~~~~~~~~
If you found this analysis helpful, support it with a Boost! 🚀
Have a question or your own view on this idea? Share it in the comments! I read every single one. 💬
► Follow me on TradingView for more educational content like this and to not miss my next detailed trade idea .
~~~~~~~~~~~~~~~~~~~~~~~~~~~~~~~~~~~~~~~~~~~~~~~~~~~~~~~~~~~~~~~~~
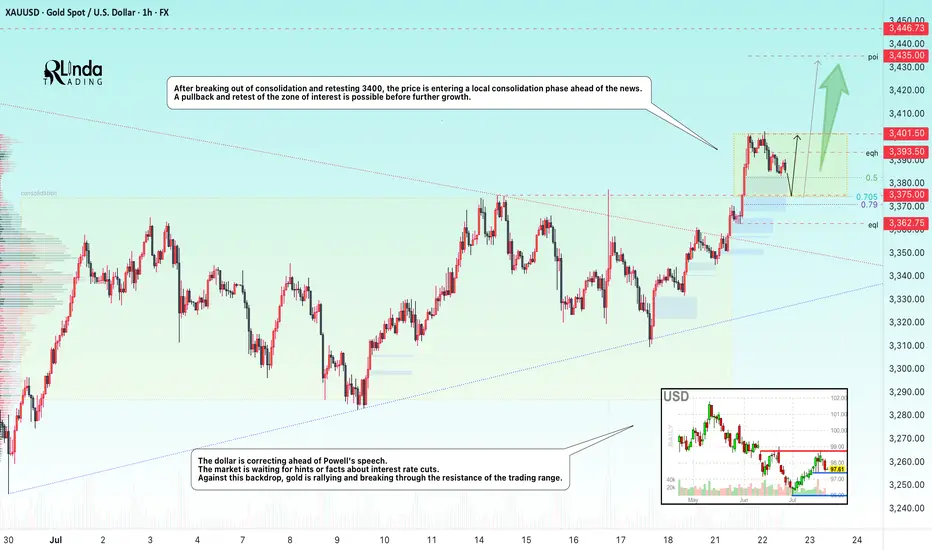
GOLD → Correction before continuing the rally to 3450FX:XAUUSD updates its local maximum to 3401.5 and enters a consolidation phase ahead of news. The dollar correction gives speculators a chance...
The price of gold is correcting from 3400. The reason is profit-taking ahead of Powell's speech at 12:30 GMT and waiting for clarity on US trade negotiations with the EU and Japan before August 1.
Gold remains sensitive to the progress of negotiations and the dynamics of the dollar, which is weakening amid political uncertainty, declining yields, and pressure on the Fed from Trump.
Technically, after exiting consolidation and retesting 3400, the price is entering a local consolidation phase.
Focus on key levels: 3401, 3382, 3375. A false breakdown of support could trigger a recovery phase.
Resistance levels: 3402, 3393
Support levels: 3382, 3375, 3362.75
The distribution phase has been halted by resistance, and the price has moved into a countertrend correction due to uncertainty. Markets are waiting for positive signals from the Fed. Local and global trends are bullish, which may support the price overall...
Best regards, R. Linda!
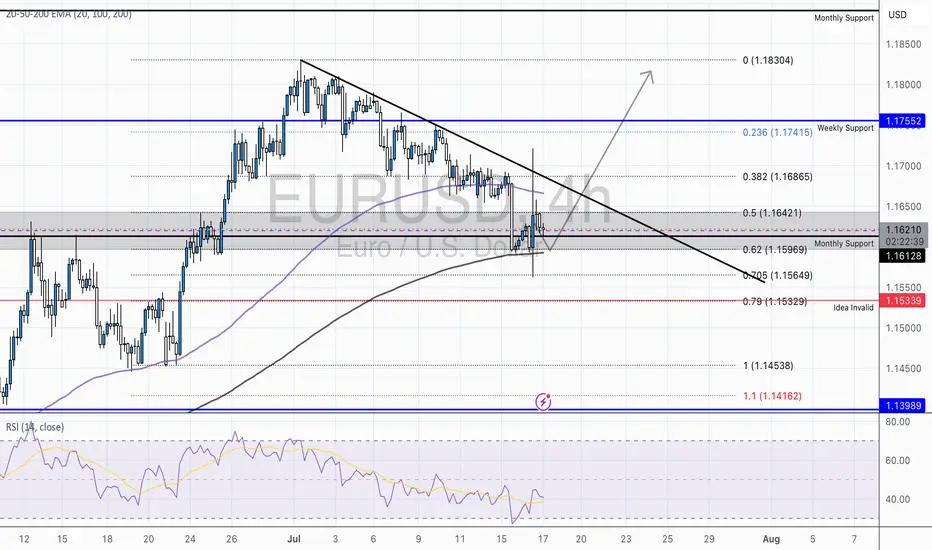
EUR/USD – Falling Wedge at Major Fibonacci Zone | Bullish ReversAfter a strong mid-June rally, EUR/USD has pulled back into a key fib cluster, showing early signs of reversal from a classic falling wedge pattern — often a precursor to bullish breakouts.
Technical Breakdown:
📉 Descending Trendline
🔍 Fibonacci Confluence:
Price is reacting from the 0.5-0.618 – 0.705 zone (1.16421-1.15969), aligning perfectly with historical demand and the golden zone of the fib retracement.
Just below sits the 0.79 fib (1.15339), which also marks our invalidity level for this idea — a deep but powerful retracement if tested.
💡 RSI:
While still below 50, it has created a hidden bullish divergence between July 12–17, hinting that momentum is flipping back to bulls.
🧠 Educational Insight:
This setup combines Trendlines, Fibonacci retracement theory, and EMA dynamics to build a multi-layered trade thesis — the type of confluence we look for at Wright Way Investments.
Price doesn’t just reverse because it hits a fib level. But when structure, EMAs, and RSI align — the odds increase significantly.
📈 Trade Setup (Idea-Based, Not Financial Advice):
Long Entry Zone: Current area (1.159–1.161), with confirmation above 1.1626
Invalidation: Clean break & close below 1.15339
Target Zones:
🎯 TP1 – 1.1642 (50 fib & retest zone)
🎯 TP2 – 1.1686 (38.2 fib)
🎯 TP3 – 1.1755 (Weekly Resistance)
📌 Summary:
EUR/USD is forming a textbook reversal setup, supported by fib precision and EMA alignment. Patience is key — but the ingredients are here for a strong bullish continuation.
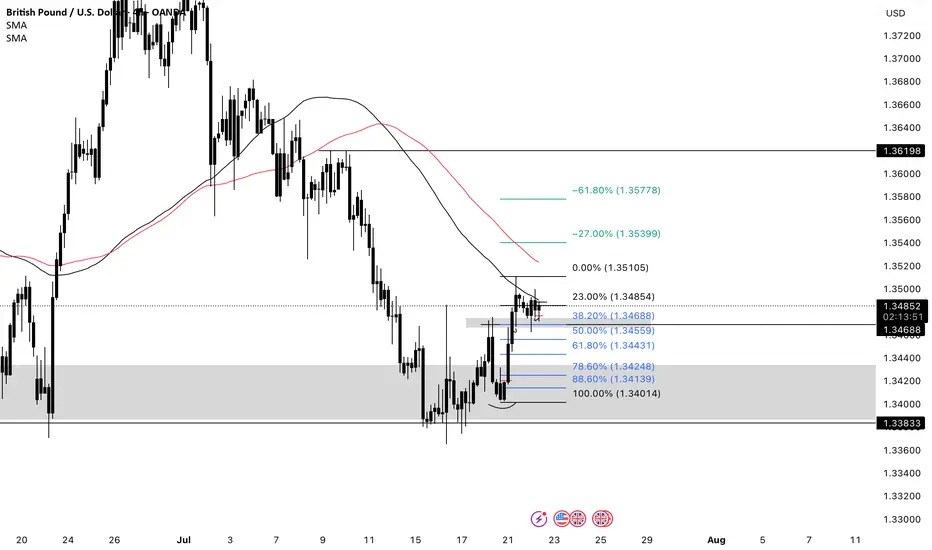
GBPUSD BUYS GU broke the previous LH and formed support. I’m waiting for price to break out of consolidation on the M15 and form more bullish pressure before entering longs towards 1.36200 area.
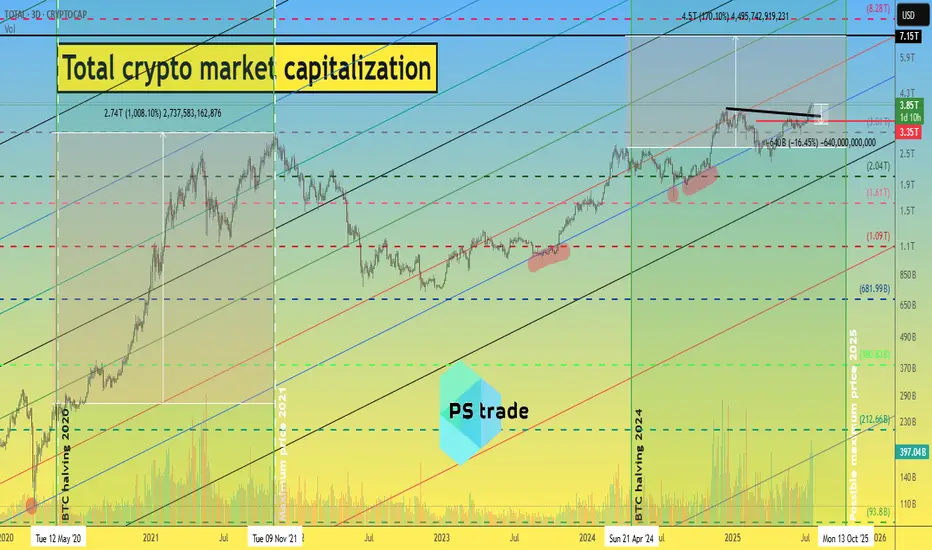
What to expect in the crypto market until 2026 ?!📈 Today, we will look at the graph of the total capitalization of the cryptocurrency market, as well as the implementation of our ideas from 2022 to 2025.
At that time, the cryptocurrency market was in a total depression, there was no talk of BlackRock or MicroStrategy buying cryptocurrencies, and we stubbornly wrote that this was the bottom... and then a miracle happened)
During this time, the total capitalization of the crypto market grew 5 times from $800 million to $4 billion.
ℹ️ You can find all posts in the channel by searching by date:
1️⃣ 18.11.22 - “How much can the crypto market capitalization grow by the end of 2025?”
The growth momentum is slowing down, but the following ideas give hope.
2️⃣ December 30, 2022 - “Plans for 2023-25”
If we are to believe this fractal, which has been working for over 2.5 years, then all the most interesting things are still ahead.
3️⃣ 29.02.2024 - “What to expect from the crypto market in 2024-26”
At the beginning of 2024, the previously published fractal was slightly adjusted to the market situation.
4️⃣ 04.03.2025 - “The total capitalization of the crypto market is on the verge of a foul.”
Then, despite the market depression and a lot of negative news, the total capitalization still managed to stay above the blue trend line.
📊 Cryptocurrency market capitalization as of 22.07.25:
◆ Bitcoin - $2.36 trillion
◆ Ethereum - $442 million
◆ Ripple - $206 billion
◆ SOL and BNB - $110 billion each
◆ USDT and USDC - $162 billion and $65 billion, respectively.
In total, this is $3.45 trillion out of $3.89 trillion of the total crypto market capitalization.
♎️ Too much capital is concentrated in the top 7 projects; we need a process of capital flow and the launch of exponential growth. Especially since all of the above fractals “suggest” that the time has come and anything is possible.
🔃 The total capitalization of the crypto market must continue to remain above the blue trend line, i.e., it cannot be adjusted by more than -13-16% to $3.25-3.35 trillion.
Roughly speaking, the price of CRYPTOCAP:BTC cannot be adjusted by more than -10% due to its high dominance at the moment. (Such an adjustment of the #BTCUSDT price fits into the scenario we published a few days ago.)
_____________________
Did you like our analysis? Leave a comment, like, and follow to get more
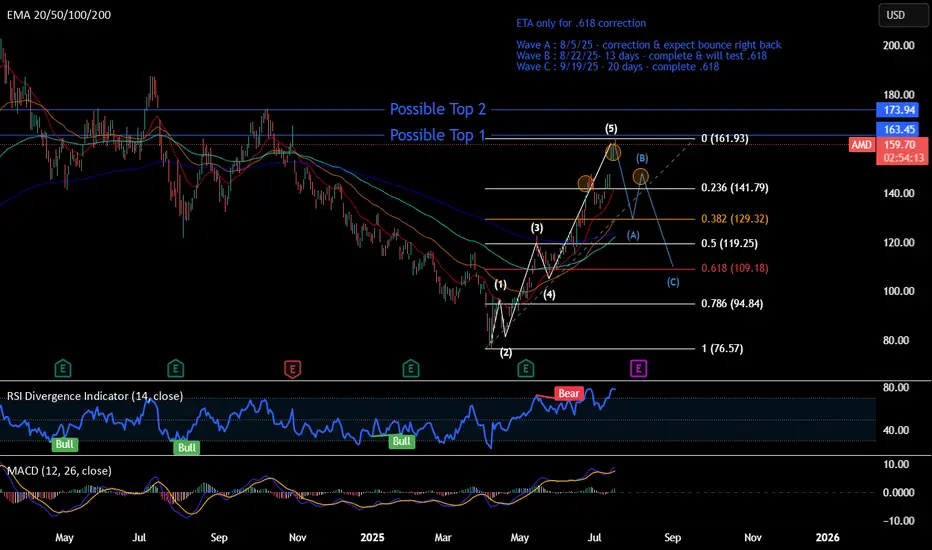
Short - AMDTime period for this play : week to months
Analysis : Elliot wave 12345 ABC. Expect hitting .618 and bounce back up to go higher.
Pattern if wave B completed : Head & Shoulder
Price Target: Wave ABC
ETA Timeline for correction. Please refer to the chart.
Upcoming events:
Tariff active on 8/1/25 - Friday
Earning on 8/5/25 - Tuesday
Top is not in yet, so 2 Possible top-in levels:
Top 1 - $163.45 : Retesting to hit 163.45, rejected, and break $158
Top 2 - $173.94 : Breaking 163.45 and reject at 173.94
=> Overall, It begins trading side way and show some weakness now.
The correction may not pull back to .618, which is the best level. Other scenarios:
- 0.5 fib, where it test wave 3
- 0.328 fib, strong bullish level if it doesn't break & go to the upside faster
Weekly Stock Pick: ORCL (Update)Hello Traders!
I'm providing an update to the ORCL trade idea from Monday July 21st. Here's what I'm watching:
- Price to open lower from Monday's close
- Rebalancing in the highest daily Bullish Order Block near $239
- A hammer or dojji candle on higher volume
- Potential confluence with the daily 9 ema, trendline support and higher low on the options chart
Cheers,
DTD
__________________________
Financial Risk Disclaimer |
DISCLAIMER: I am not a financial adviser. The videos on my channel are for educational and entertainment purposes only. I'm just showing you guys how I invest and day trade, but remember, investing of any kind involves risk. Your investments are solely your responsibility and not mine. While day trading can bring substantial gains, it can also bring serious losses! So make sure you do your research to fully understand the market before diving in. The possibility exists that you could sustain a loss of some or all of your initial investment, and therefore should not invest money that you can't afford to lose. The fluctuation of the market can work for you or against you. You should carefully consider your investment objectives and experience before deciding to trade in the market. Again, what you invest in is solely your responsibility.

Before GER40 Roars, It WhispersHey guys👋
Here’s the latest GER40 analysis I’ve prepared for you:
🔻 If the **24,179** support level breaks, the next target is **23,972**.
🔺 If the **24,373** resistance level breaks, the next target is **24,511**.
🎯 I’ve shared two key levels with you — please monitor them carefully.
Every like from you gives me a big boost of motivation 🙏
Thanks to everyone who supports my work — truly appreciate it 💙


GBPUSD - Looking To Sell Pullbacks In The Short TermH4 - Strong bearish move.
No opposite signs.
Currently it looks like a pullback is happening.
Expecting bearish continuation until the two Fibonacci resistance zones hold.
If you enjoy this idea, don’t forget to LIKE 👍, FOLLOW ✅, SHARE 🙌, and COMMENT ✍! Drop your thoughts and charts below to keep the discussion going. Your support helps keep this content free and reach more people! 🚀
--------------------------------------------------------------------------------------------------------------------

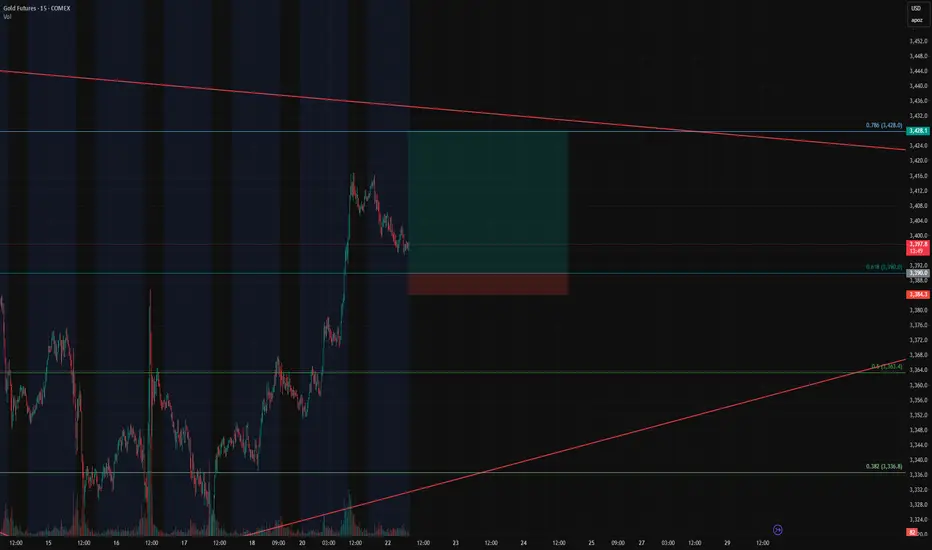
Gold Futures Long Setup – Breakout Continuation off the 0.618 FiGold Futures Long Setup – Breakout Continuation off the 0.618 Fib
Instrument: Gold Futures – COMEX ( COMEX:GC1! )
Timeframe: 15-Minute
Trade Type: Long – Breakout Continuation
Entry Zone: 3390 (0.618 Fibonacci retracement)
Take Profit: 3428 (0.786 Fib)
Stop Loss: 3384
Risk/Reward Ratio: 6.68
Setup: Bullish Flag on Retest
🔍 Trade Thesis
This trade is part of an ongoing breakout continuation strategy we've been trading, and now we're eyeing a pullback entry as price returns to a key retracement level.
Price nearly exploded through the 0.618 Fibonacci level (3390) during the prior breakout.
Now it's pulling back in a textbook bullish flag formation, suggesting healthy consolidation before the next leg.
The 0.618 retracement is aligning with previous intraday structure and trendline support — making this an ideal level to scale in.
This is a high R:R continuation play, with targets set at the 0.786 Fib level (3428) — right before macro resistance kicks in.
🎯 Entry & Exit Strategy
Entry: As price touches 3390 or forms bullish confirmation at the level.
Stop Loss: 3384 – tight and below key fib/flag structure.
Target: 3428 – based on 0.786 Fib extension and breakout continuation projection.
📊 Why This Works
Breakout behavior: Price respected the breakout impulse and retraced cleanly into a bull flag.
Fib confluence: 0.618 pullbacks are a classic entry in trending markets.
R/R of 6.68: Excellent reward profile vs. limited risk.