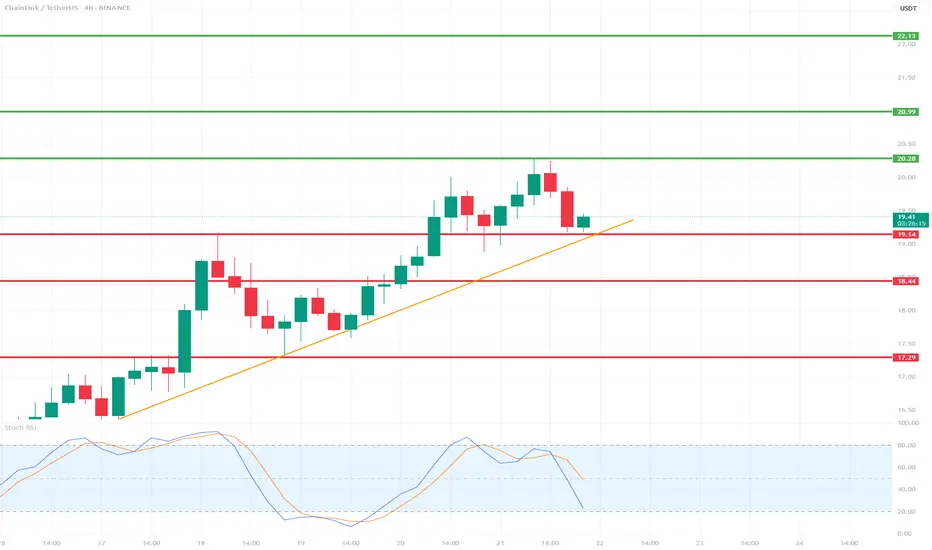
LINK/USDT 4H Chart📉 Indicators and Market Structure:
🔶 Trend:
Current trend: up, as long as it remains above the trend line and the 19.14 USDT level.
Local resistance: 20.28 USDT (recent high).
Next resistances: 20.99 USDT and 22.13 USDT (green lines).
Supports: 19.14 USDT, 18.44 USDT, 17.29 USDT (red lines).
🔷 Stochastic RSI (lower indicator):
Located in the oversold zone (below 20) and starting to reverse upward.
Potential signal of buying pressure if the %K and %D lines cross bullishly.
🧠 Scenarios:
✅ Bullish scenario (trend continuation):
Bounce from the trend line and the 19.14 level → breakout of 20.28 → test of 20.99–22.13.
Confirmation will be a clear bullish candle with high volume and a Stochastic RSI cross up.
❌ Bearish scenario (trend break):
Closing below the trend line and the 19.14 level → correction towards 18.44, and then even to 17.29.
An oversold RSI could support continued declines if a rebound does not occur.
📌 Summary:
Currently, the key level is the trend line and support at 19.14 USDT.
The market is waiting for a reaction – a rebound or a downward breakout.
Stochastic RSI suggests a possible rebound, but candlestick confirmation is needed.
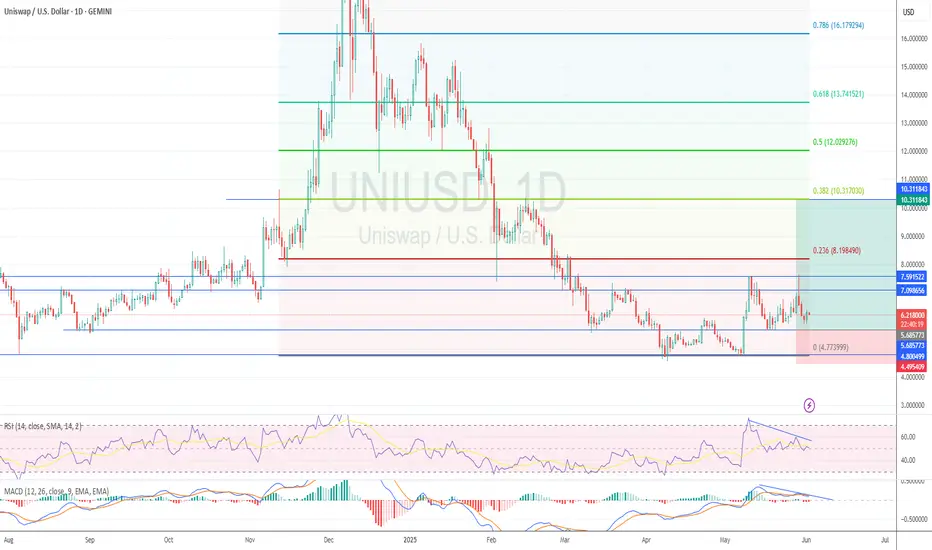
Fibonacci
$UNI - $10 from here?Hi guys! 👋🏻
🔔I'll be trying this setup for Uniswap
🔔 We have bounced from the strong support at $4.80, which we retested in April 25 and May 7 forming a pattern impersonating a double bottom
🔔 With the current chart pattern and levels, I'll be expecting a jump with a target on $10.
🔔 Might drop to $5.70 before another move upwards.
✊🏻 Good luck with your trades! ✊🏻
If you like the idea hit the 👍🏻 button, follow me for more ideas.
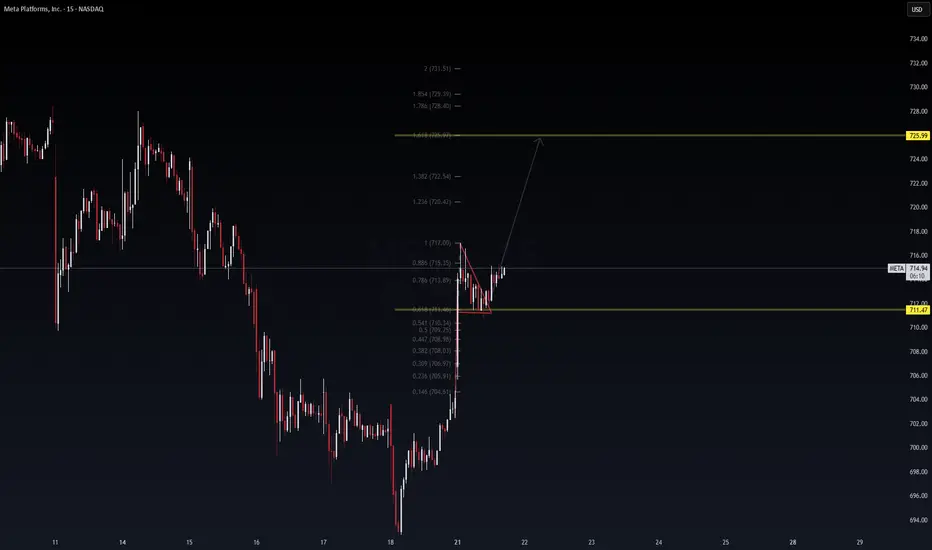
$META Day Trade Update | 15m TF📈 NASDAQ:META Day Trade Update | 15m TF
VolanX DSS framework still intact. Price broke out cleanly from a descending triangle, retested the breakout zone near 713.8, and is now stabilizing above 714.6. We’re printing a bullish structure with momentum building toward:
🎯 Primary Target: 725.99
🧠 Fib Levels in Play:
0.618 = 711.47 (support held)
0.786 = 713.89 (pivot zone)
1.618 = 725.99 (target in sight)
📌 Key Observations:
Retest successful, no wick violation below triangle
Volume holding steady post-breakout
RSI/MACD divergence resolved on lower TFs
If momentum sustains, META may front-run 725 with a sweep into 728–731.5 extension. We’ll adapt based on order flow and price action near 722.5 resistance.
📡 Protocol: VolanX DSS | SMC + Fib + Triangular Structure
🔁 Still stalking. Exit at 725 or scale-out from 722 based on intraday momentum.
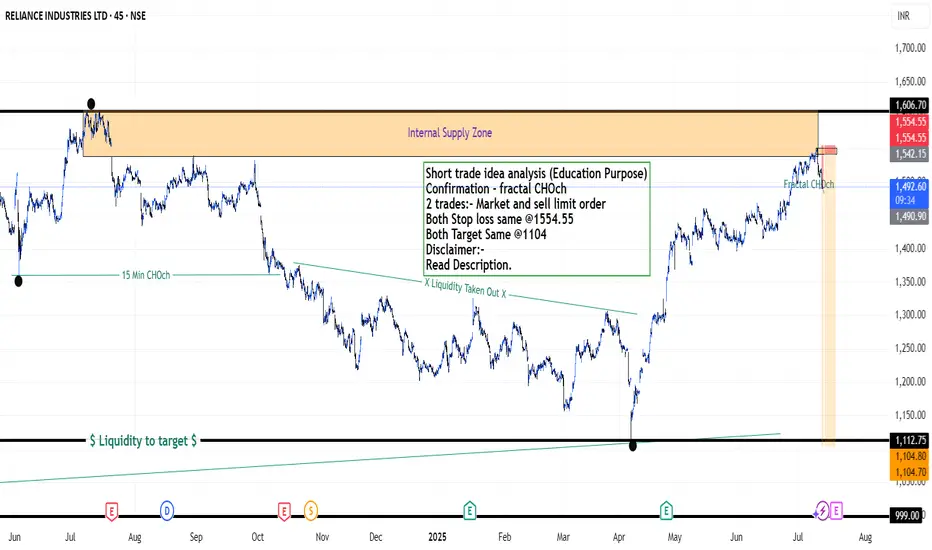
Reliance Industries Stock(India) - {11/07/2025}Educational Analysis says that Reliance Industries (Indian Stock) may give trend Trading opportunities from this range, according to my technical analysis.
Broker - NA
So, my analysis is based on a top-down approach from weekly to trend range to internal trend range.
So my analysis comprises of two structures: 1) Break of structure on weekly range and 2) Trading Range to fill the remaining fair value gap
Let's see what this Stock brings to the table for us in the future.
DISCLAIMER:-
This is not an entry signal. THIS IS FOR EDUCATIONAL PURPOSES ONLY.
I HAVE NO CONCERNS WITH YOUR PROFITS OR LOSS,
Happy Trading,
Stocks & Commodities TradeAnalysis.
My Analysis is:-
Short term trend may be go to the external demand zone.
Long term trend breaks the new high after going from discount zone.
Short trade idea analysis (Education Purpose)
Confirmation - fractal CHOch
2 trades:- Market and sell limit order
Both Stop loss same @1554.55
Both Target Same @1104
Please check the comment section to see how this turned out.
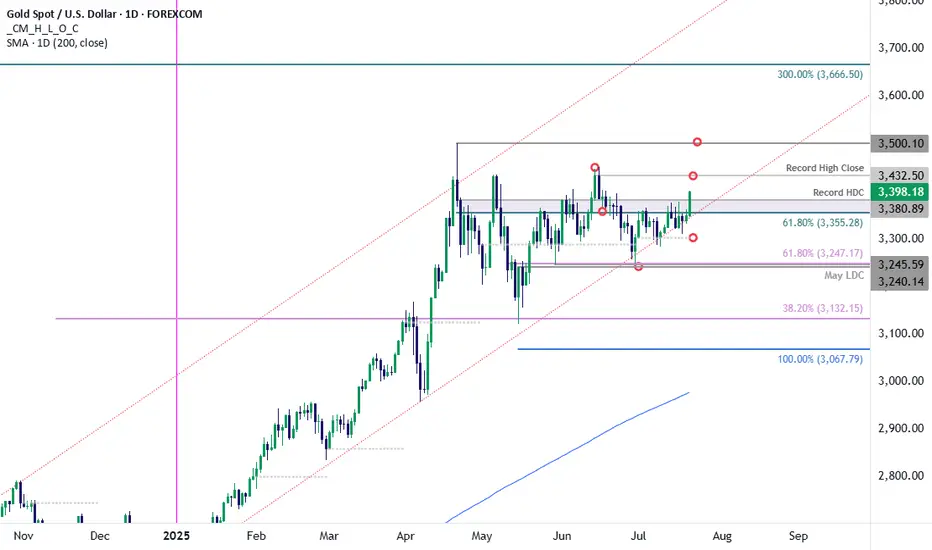
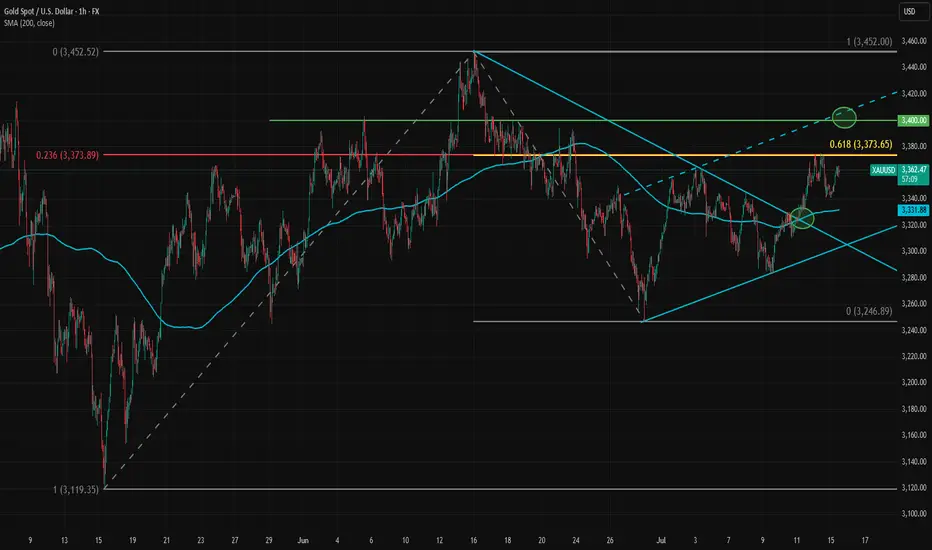
Gold Bull Charge- XAU/USD Clears July Opening-RangeGold is attempting to breach resistance today at the 61.8% retracement of the April decline / record high-day close (HDC) at 3355/80- watch the close.
The advance marks a breakout of the July opening-range and a topside breach here exposes the record high-close at 3432 and the record highs at 3500.
Initial support now back at 3355 with bullish invalidation steady at the objective monthly open at 3303.
-MB
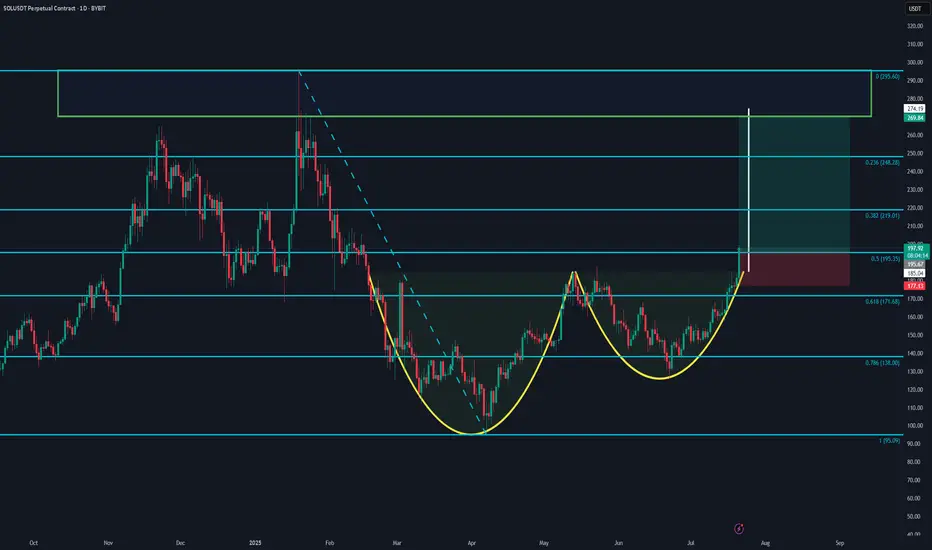
SOLUSDT - Cup and Handle Formation Targeting $295A classic Cup and Handle pattern is forming on the daily chart of SOLUSDT. The breakout above the $195 neckline signals potential continuation toward the $295 target, based on the depth of the cup.
🔹 Key levels:
Entry: $196
Stop Loss: $177
TP1: $219 (Fib 0.382)
TP2: $248 (Fib 0.236)
TP3: $274 - $295 (full target zone)
📊 The Fibonacci retracement levels align well with potential resistance zones. A clean breakout and daily close above $200 could further validate this setup.
Not financial advice. DYOR.
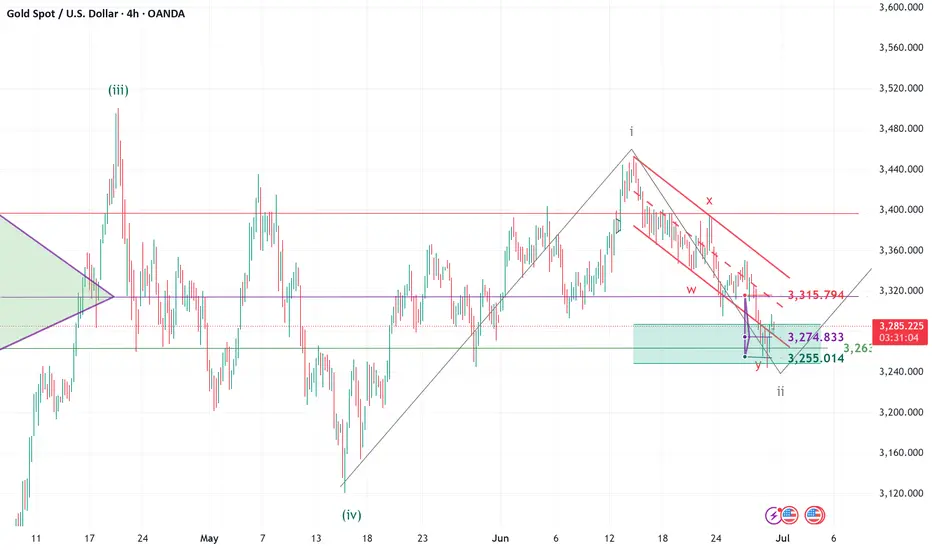
ELLIOTT WAVE XAUUSD H4 update
EW Trade Set Up H4
monitoring the end of subminuette wave ii
subminuette wave ii is going to end in a double zigzag.
Waiting for an accumulation in the price range 3250/3315 before subminuette iii starts.
daily key levels (area)
3315
3275 POC
3250
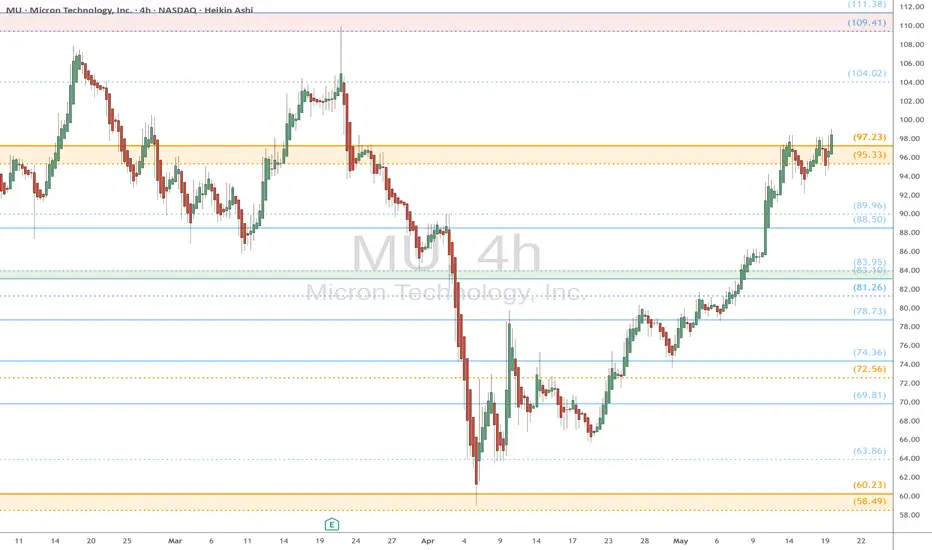
MU eyes on $95/97: Double Golden fib zone Ultra-High GravityMU looking to exit a Double Golden zone $95.33-97.23
Break could pop to next resistance zone $109.41-111.38
Expecting some orbits around this ultra high gravity zone.
.
Previous Plot that caught the bottom EXACTLY:
==================================================
.
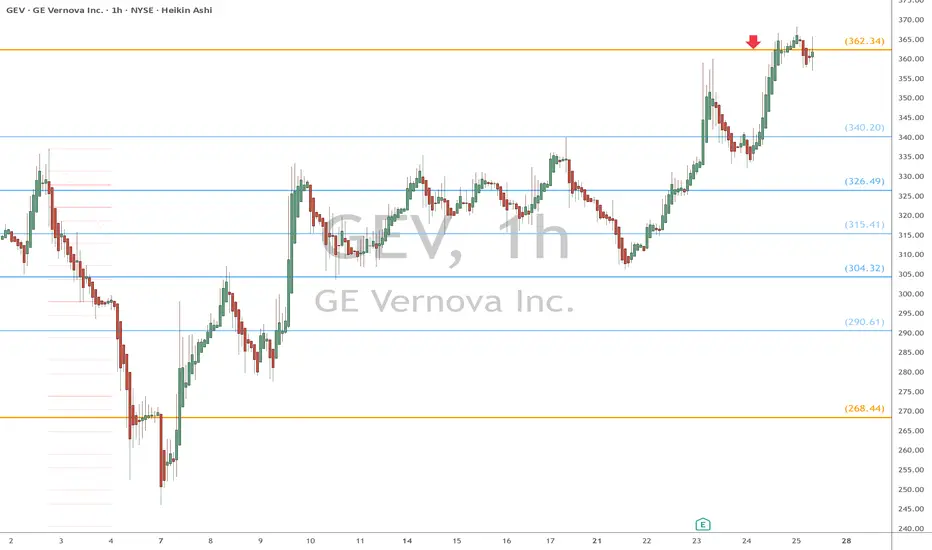
GEV eyes on $362.34: Golden Genesis Fib that may End BounceGEV trying to recover with the general market.
Currently testing a Golden Genesis Fib at $362.34
Looking for a Dip here, or Break-and-Retest entry.
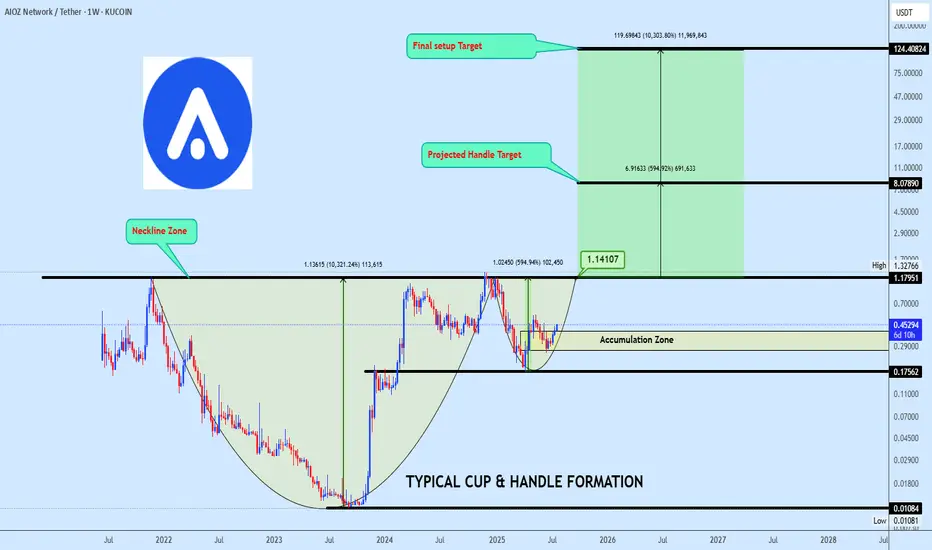
Aiozusdt trade opportunityAIOZUSDT is shaping a potential cup and handle pattern, with price nearing the neckline. A confirmed breakout above this level will validate the bullish setup and trigger momentum towards the projected targets.
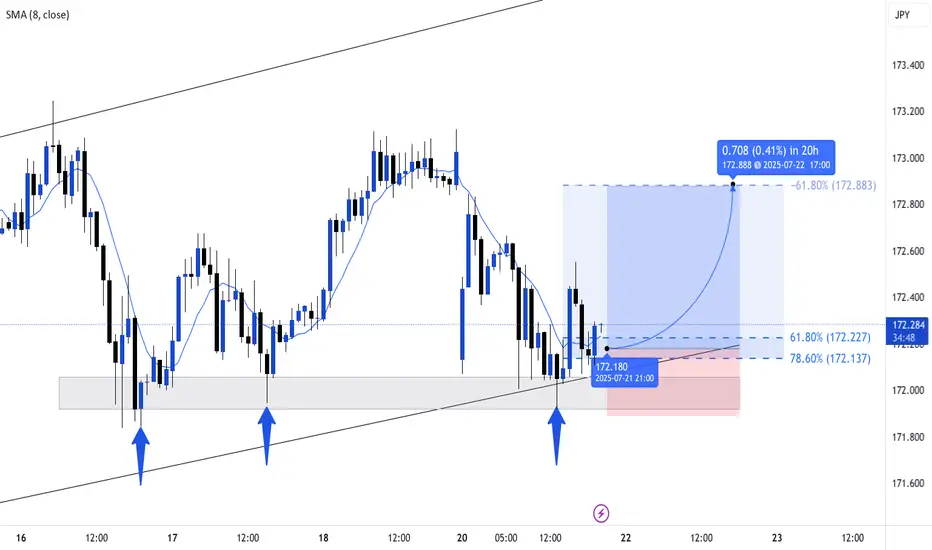
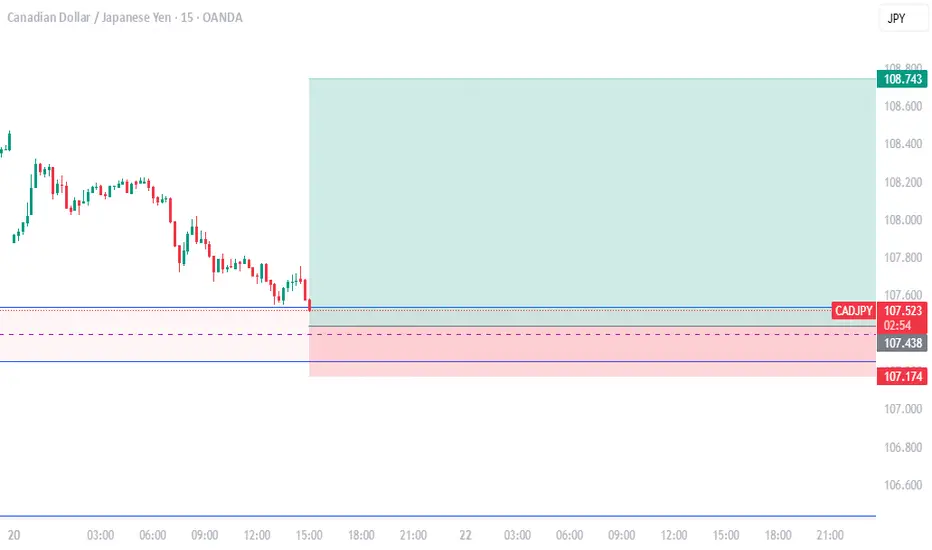
cadjpy for long *The content on this analysis is subject to change at any time without notice, and is provided for the sole purpose of assisting traders to make independent investment decisions.
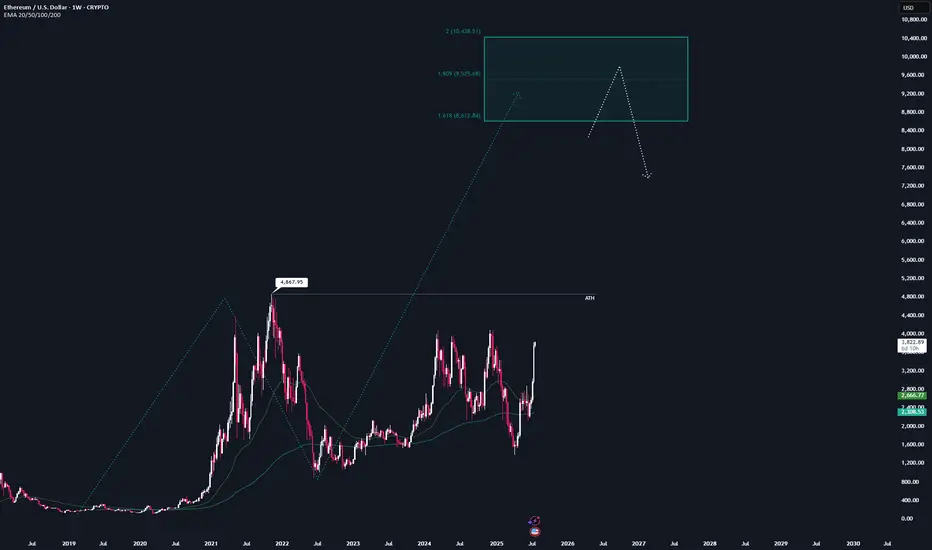
ETH - FULL top-to-bottem AnalysisHere is the full analysis for CRYPTOCAP:ETH as requested 🫡
Weekly Time-frame:
We currently have one potential bullish structure for this cycle, which could take ETH into the $8,600–$10,400 price range.
This sequence gets activated once we break the all-time high at $4,867.
That area also marks my maximum target for this cycle — anything beyond that is pure maga FOMO, and I’m not going to gamble on some “super cycle” narrative.
At the weekly level, I wouldn’t recommend making additional buys in the current price range.
If you're still sidelined at this point, you should honestly reflect on your positioning this cycle — we’ve been given plenty opportunities to enter at good prices.
Daily Chart:
Around 1.5 weeks ago, we finally broke through the major resistance at $2.8k, which has been the key level to watch for the past two years.
That breakout also activated a bullish structure, targeting the $4,500–$5,100 range — which aligns with new all-time highs.
However, a retracement before reaching the target zone is always possible, and any pullback should be viewed as a gift for long entries.
I’ll be placing 4 long orders at each Fib level within the orange B–C retracement zone, each with a stop-loss just before the next level.
The key resistance to watch now is around $4k — once we break above that, hitting the target zone becomes highly likely.
Local price action:
Currently, no valid structures can be identified on the lower timeframes.
However, if valid bearish structures appear on the 1H or 4H charts, I’ll consider them for hedge short opportunities.
Summary:
All in all, waiting is the best strategy right now.
I wouldn’t recommend buying in this region anymore — and it's still too early for valid short setups.
Hope this analysis was helpful for at least one person ❤️
Thanks for reading,
Cheers!
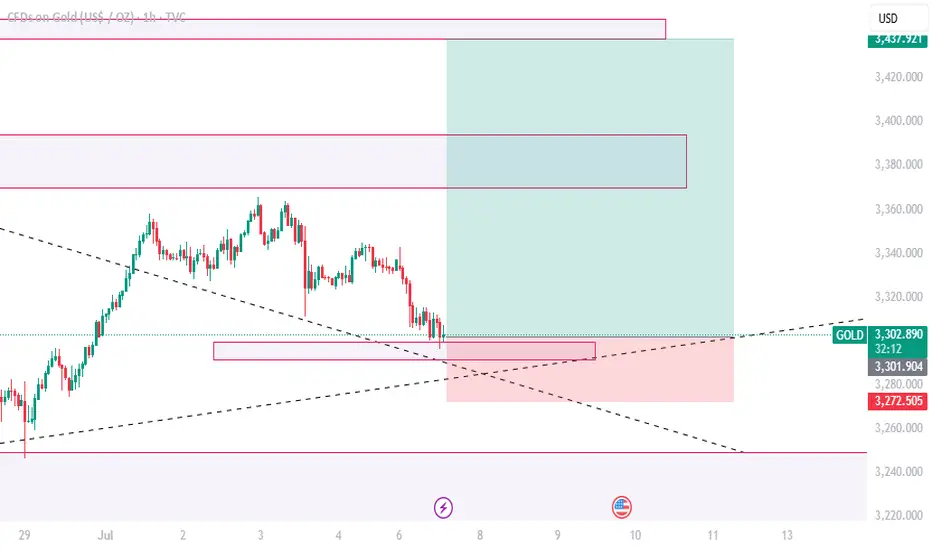
gold for long *The content on this analysis is subject to change at any time without notice, and is provided for the sole purpose of assisting traders to make independent investment decisions.
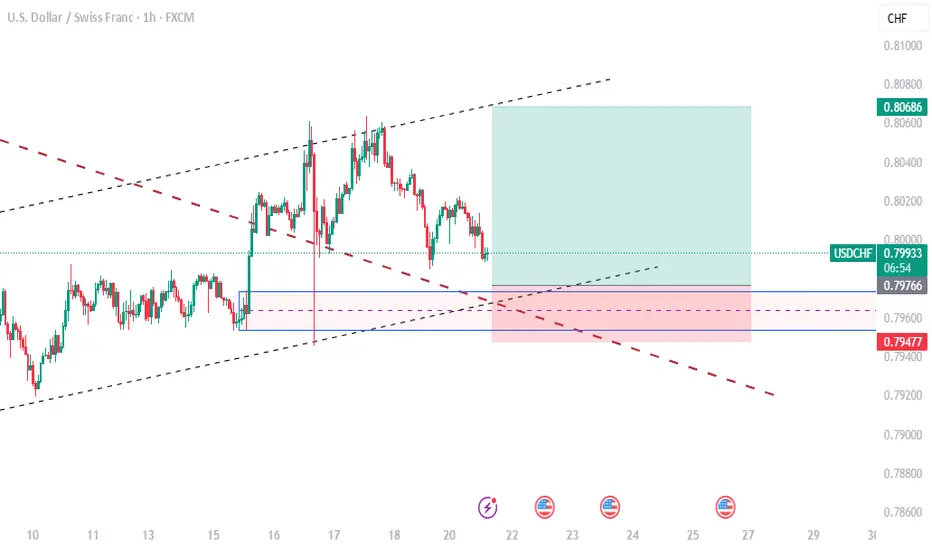
USDCHF*The content on this analysis is subject to change at any time without notice, and is provided for the sole purpose of assisting traders to make independent investment decisions.
Two Retracement Levels Converge, Creating Strong ResistanceGold is hovering near 3370 amid a wave of tariff-related headlines over the past few days. After Trump’s threats toward Mexico, Canada, and the European Union, gold has been pushing toward higher levels. The latest warning came over the weekend, targeting both the EU and Mexico with a 30% tariff unless an agreement is reached by August 1. The EU trade commissioner described the proposed tariff as “absolutely unacceptable.”
So far, markets remain calm due to ongoing delays in the actual implementation of these tariffs. However, that could change as the August deadline approaches. Trump may view it as politically damaging to issue repeated threats without following through.
Meanwhile, the EU is preparing countermeasures in case the deadline passes without an agreement and the U.S. enforces the 30% tariffs. The EU’s plan targets $84 billion worth of goods, including automobiles, aircraft, wine, bourbon, agricultural and chemical products, plastics, and electrical equipment. The outcome of U.S.-EU negotiations could be a major driver for gold in July.
Another factor to watch is the recent surge in bond yields in Japan. The rising probability that Japan’s ruling coalition may lose its majority is creating uncertainty, especially since opposition parties favor tax cuts and increased government spending. Higher Japanese yields could trigger a reversal in carry trade flows, which might also push up yields in Europe and the U.S.
Gold pushed higher, breaking out of the bearish trendline drawn from the July 13 top, and reached the 3370–3375 area. So far, this zone has provided strong short-term resistance. The 3374 is significant, as it marks both the 23.6% Fibonacci retracement level of the May–June rally and the 61.8% retracement of the June 16–30 pullback. This confluence could make it a key pivot point for gold this week.
If this level is broken, gold could gain further momentum and move above 3400. On the downside, 3342 has been acting as a support level for now.
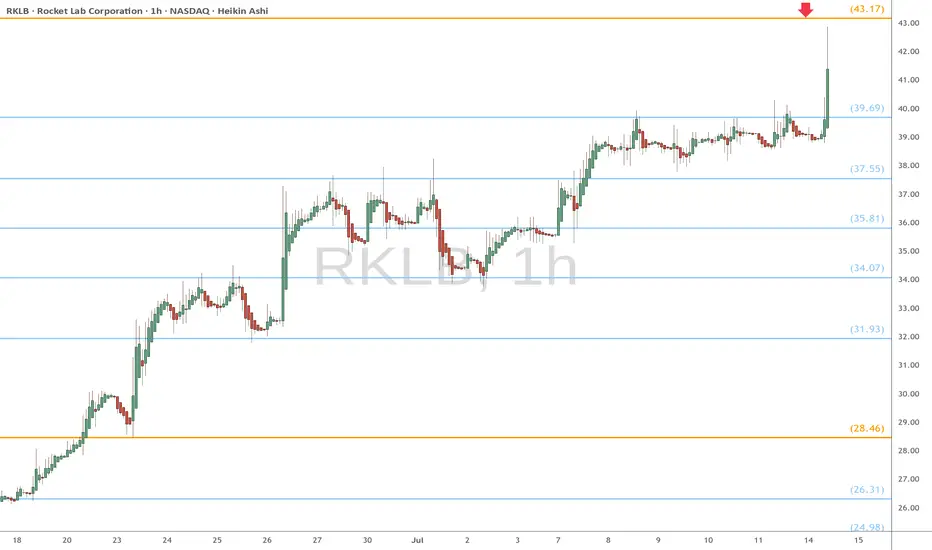
RKLB heads up at $43.17: Golden Genesis fib may knock it downRKLB has been rocketing upward from $4 to $43.
It is about to hit a Golden Genesis fib at $43.17
Expectng a dip from it, or a few orbits at least.
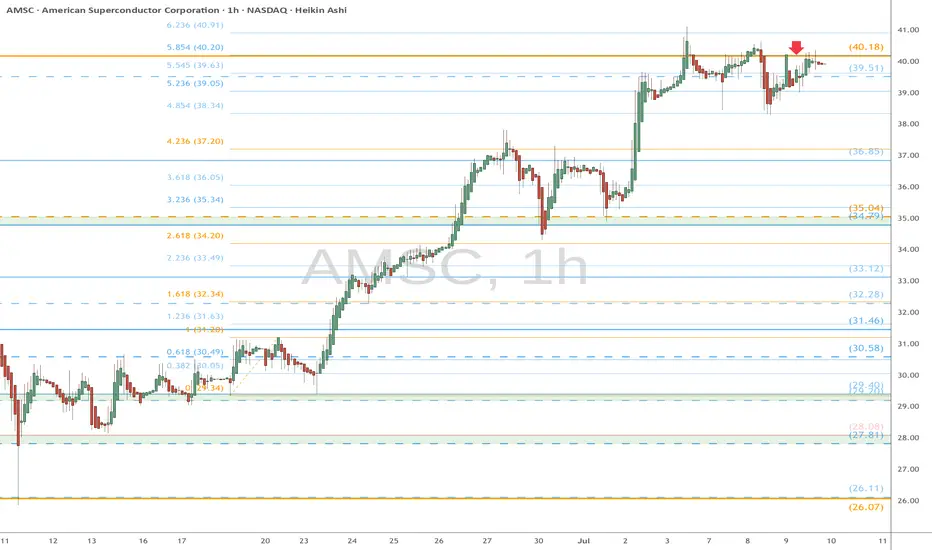
AMSC eyes on $40.18: Golden Genesis fib holding up new ATHAMSC has been bobbing into a Golden Genesis fib at $40.18
Look for a Break-n-Retest to start next leg of uptrend.
Beware of a possible rejection for a high velocity dip.
.
Previous Analysis that gave a PERFECT SWING trade:
Hit the BOOST and FOLLOW for more such a PRECISE and TIMELY charts.
==============================================================
.
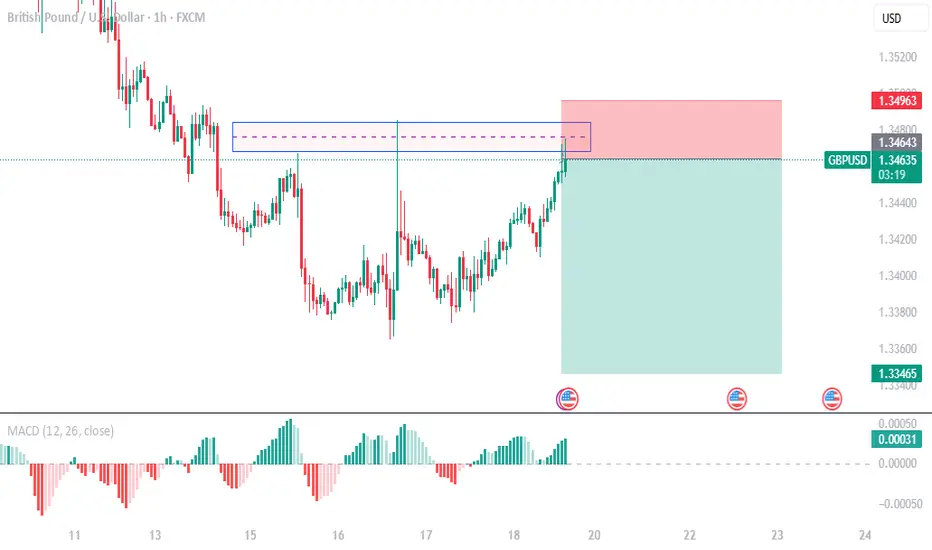
GBPUSD for short*The content on this analysis is subject to change at any time without notice, and is provided for the sole purpose of assisting traders to make independent investment decisions.
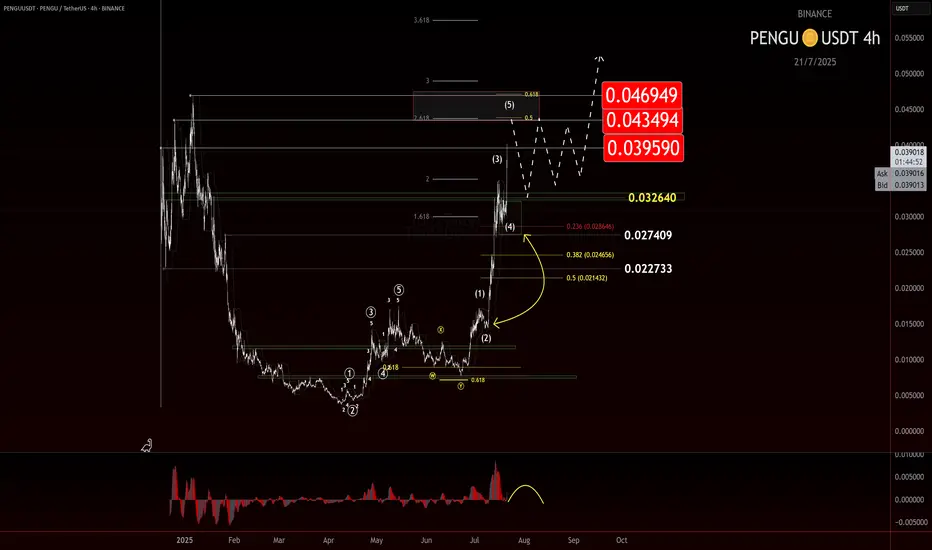
$PENGU: Taking Profit and Watching for a TurnIf you find this information inspiring/helpful, please consider a boost and follow! Any questions or comments, please leave a comment!
PENGU has made a strong move off the 0.007 level, now it just popped cleanly out of consolidation beneath the key LOI at 0.032. That break gave us the signal we needed for continuation, and so far, the price has followed through nicely.
But now, we’re approaching a zone where things could get a bit trickier.
This advance is starting to look like a classic wave 3 impulse, and while there’s no clear confirmation of a top yet, signs are beginning to flash caution. That means it’s time to start watching for potential topping behavior—especially if we move into a broader consolidation phase.
Here’s what’s on my radar:
• Wave 3 Exhaustion?
Still unconfirmed, but this could be the final leg of the wave 3 structure.
• AOI or Key Level Rejection
A stall or strong reaction near resistance could be a red flag. Channel parallel being reached.
• Bearish Divergence on the EWO
Momentum isn’t keeping pace with price. That’s often a precursor to a deeper pullback.
No need to force the next move here. This thing could just keep ripping up, but I am being extra cautious here. Not only to look for a potential top, but if a retrace is given, a potential long add to my current trade. Taking profit at these levels makes sense, especially given the early entry from 0.012 and my trade plan.
As always, trade what’s printed, not what’s hoped for. Stay nimble.
Trade Safe!
Trade Clarity!
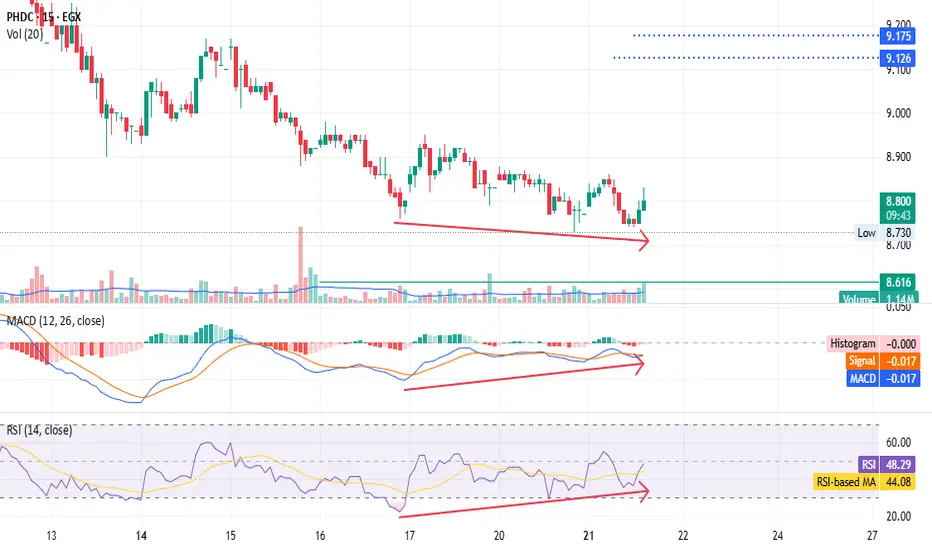
PHDC - don't give them away for free - only for shareholders EGX:PHDC - 15m timeframe
Hold your shares; don't give them away for free.
MACD and RSI show positive divergences.
Set a stop loss at 8.74.
Targets: 9.14 and 9.50.
*Not investment advice—just my chart analysis. Consult your account manager before investing. Good luck.*
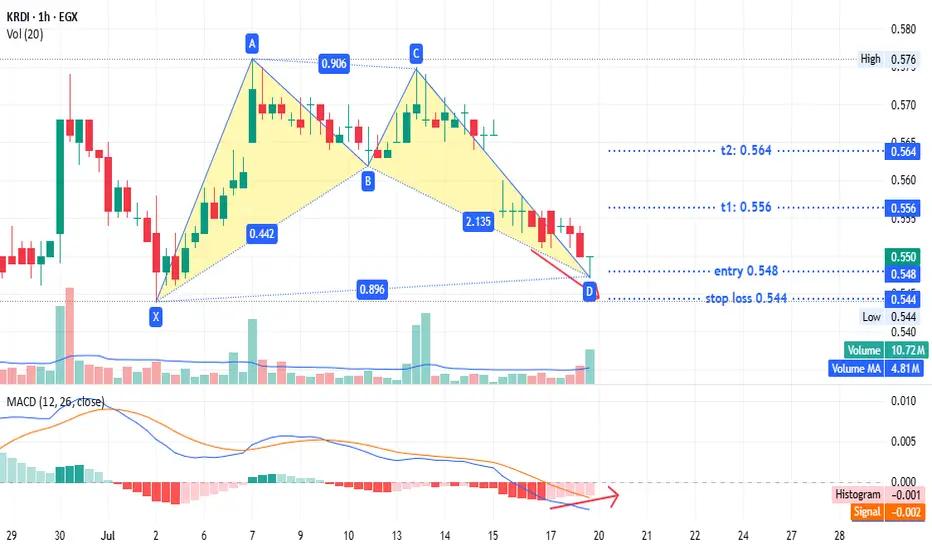
KRDI - just for fun but secured TASE:KRDI timeframe 1 hour
created bullish pattern
entry 0.548
stop loss : 0.544
T1: 0.556
T2: 0.564
MACD show positive diversion may that support our idea
Its not an advice for investing only my vision according to the data on chart
Please consult your account manager before investing
Thanks and good luck
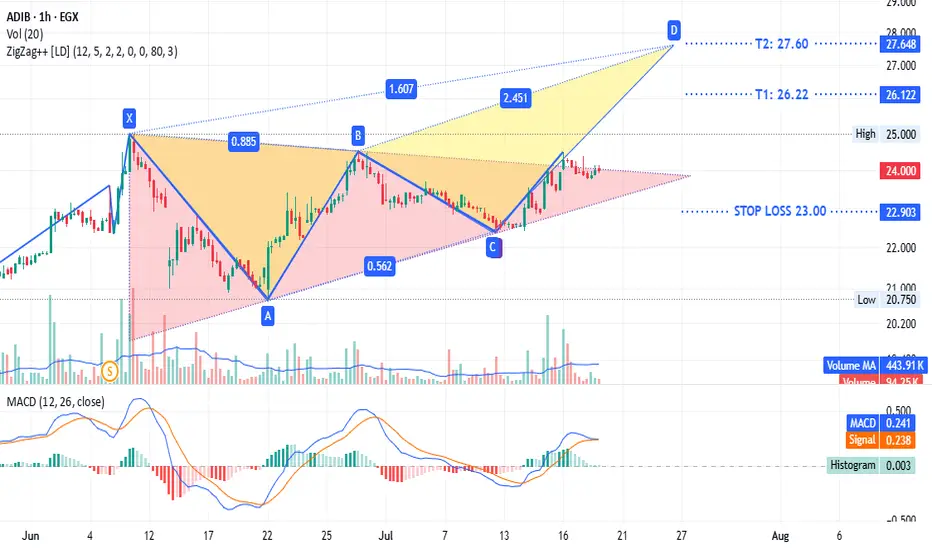
ADIB - same $comi patternADX:ADIB timeframe 1 hour
Is showing a triangle pattern with a potential bearish trend. It is currently testing the upper line of the triangle. The stop loss is at 23.00, and the target sell point ranges from 26.22 to 27.60.
This is not investment advice, only my analysis based on the chart data. Consult your account manager before making any investment decisions. Good luck.