BNB LongI see a buy zone around 735 just after a significant FVG, and moreover, given the overall bullish strength of BNB, the pullback to happen next won't be a deep pullback but rather a light one. Confirming with the Fib retracement tool that zone sits well at the 38% pull back level, which is a good sign of a light bull back to continue the bullish move
Fibonacci

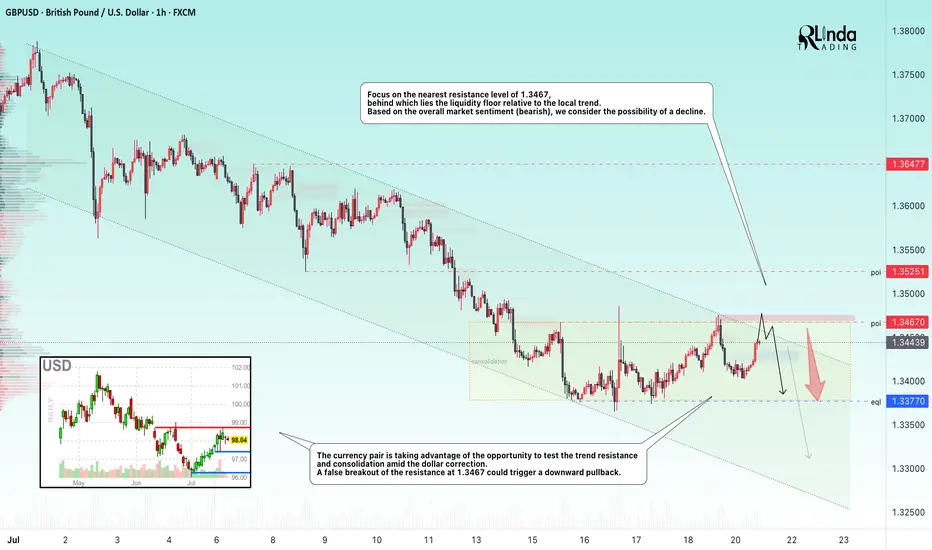
GBPUSD → Hunting for liquidity before the fallFX:GBPUSD is forming a countertrend correction towards the liquidity zone amid a correction in the dollar. Are there any chances for a trend break?
The currency pair is taking advantage of the opportunity to test the trend resistance and consolidation amid the dollar correction. Focus on the nearest resistance level of 1.3467, behind which lies a pool of liquidity relative to the local trend.
Based on the overall market sentiment (bearish), a breakout of the 1.3467 resistance could trigger a downward pullback.
Resistance levels: 1.3467
Support levels: 1.3370
If, during the retest of the specified liquidity zone, the market is unable to continue its upward movement and the price returns below the level, we will have a chance to catch a decline within the current trend.
Best regards, R. Linda!
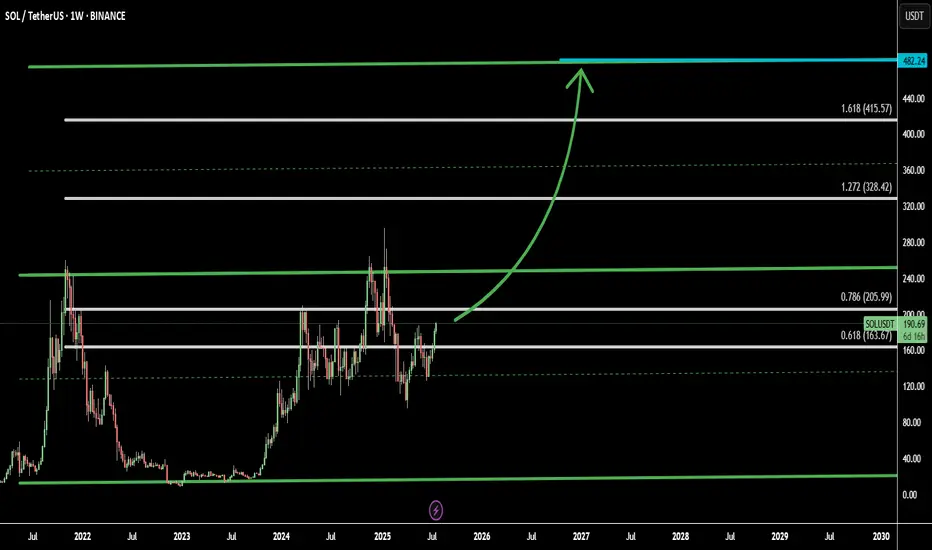
SOL Aiming to Double: Channel & Fibonacci Targets Signal $380Solana (SOLUSD) is currently trading around $190, and technical analysis suggests it may be on the path to doubling in price toward $380. This projection is supported by both a bullish ascending channel and Fibonacci extension levels, providing confluence for an extended rally.
Using this combined strategy, I’ve identified 4 key targets:
Target 1: 0.786 Fib – 205.99 - mid-range target within the upper half of the channel
Target 2: 1.272 Fib – 328.42 - aligns with historical breakout levels
Target 3: 1.618 Fib – 415.57 - Last Fibonacci Targets
Target 4: projected top of the current channel near 482.24
Beyond the technicals, Solana’s ecosystem continues to outperform many other Layer 1 chains, offering faster transaction speeds, lower fees, and robust DeFi and NFT activity. This fundamental strength supports the technical bullish thesis.
As always, breakout confirmation and volume are key. Manage risk accordingly.
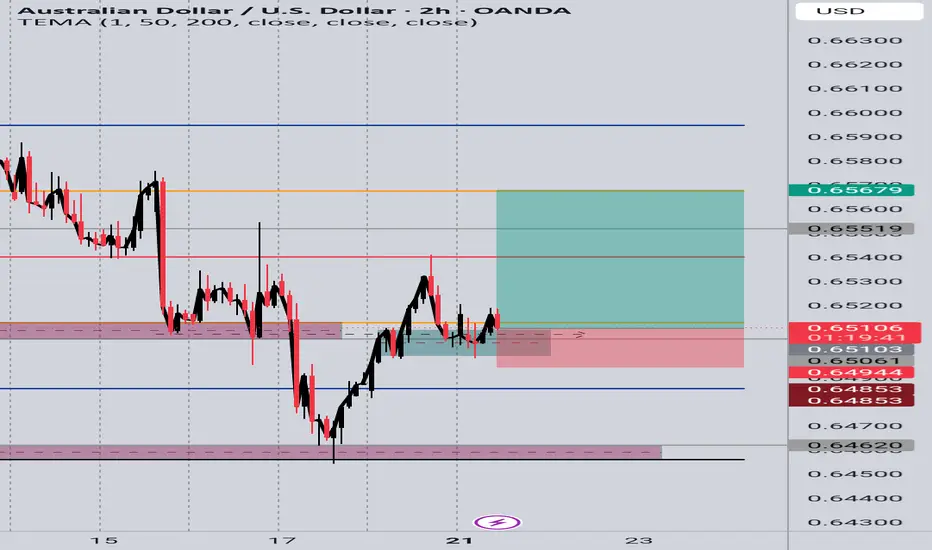
AUD/USD 2H – Price Action Buy SetupAfter a strong bullish push, price pulled back into a previous demand zone near 0.65000, where buyers had clearly stepped in before.
The previous resistance around 0.6510 was broken and now appears to be acting as support — a classic sign of a break and retest.
The current bullish rejection candle near the zone confirms buying interest.
✅ Entry: Around 0.6500
❌ Stop Loss: Below the recent low / demand zone (~0.6485)
🎯 Take Profit: 0.6550 and 0.6567 (previous swing high
Price is now forming higher lows and pushing upward — watching for continuation toward the next resistance.
#AUDUSD #PriceAction #BreakAndRetest #ForexSetup #SupportResistance #TrendContinuation #ForexAnalysis
EURUSD – Preparing For Potential Volatility AheadThe week ahead has all the elements to be a volatile one for EURUSD traders to navigate. First, the unwind of long positions that has been on-going throughout July, since prices hit a 4 year high at 1.1830 on July 1st may have potentially found a short-term base after rebounding last week from printing a low of 1.1556 on Thursday. More on this in the technical section below.
Secondly, Bloomberg reported over the weekend that negotiations to agree a trade deal between the US and EU are proving to be more challenging than initially hoped. This leaves room for market moving headlines on this topic, or social media posts from President Trump that could influence the direction of FX markets, especially if it shifts trader expectations towards preparing for the prospect of a trade war between these two global economic heavyweights.
Then on Thursday, consideration needs to be given to the ECB interest rate decision (1315 BST) and then the press conference led by ECB President Lagarde, which starts at 1345 BST. After eight consecutive rate cuts at their previous meetings, the European Central Bank are expected to take a pause to assess incoming inflation and growth data, so this outcome would probably not be a surprise. However, the comments of Madame Lagarde in the press conference could increase EURUSD volatility given that there is some uncertainty surrounding whether a further rate cut is possible either in September, or later in the year.
Technical Update: Limited Price Correction or Reversal?
We all know well, even if an asset is trading within a positive uptrend, periods of price weakness can materialise, before fresh buying support develops. This can lead to renewed price strength that manages to break and close above a previous high, leading to an extension of a pattern of higher price highs and higher price lows.
Having been capped by the July 1st high at 1.1830, EURUSD has seen a price correction develop. Traders may be trying to decide if this is a limited move lower before fresh price strength is seen, or if it could be a price reversal, which may result in risks of a more extended phase of price weakness.
Much will depend on the outcome of the risk events outlined above, as well as future market sentiment and price trends, however it is possible to assess what may be the important support and resistance levels that traders could focus on to help gauge the next direction of price activity
Potential Support Levels:
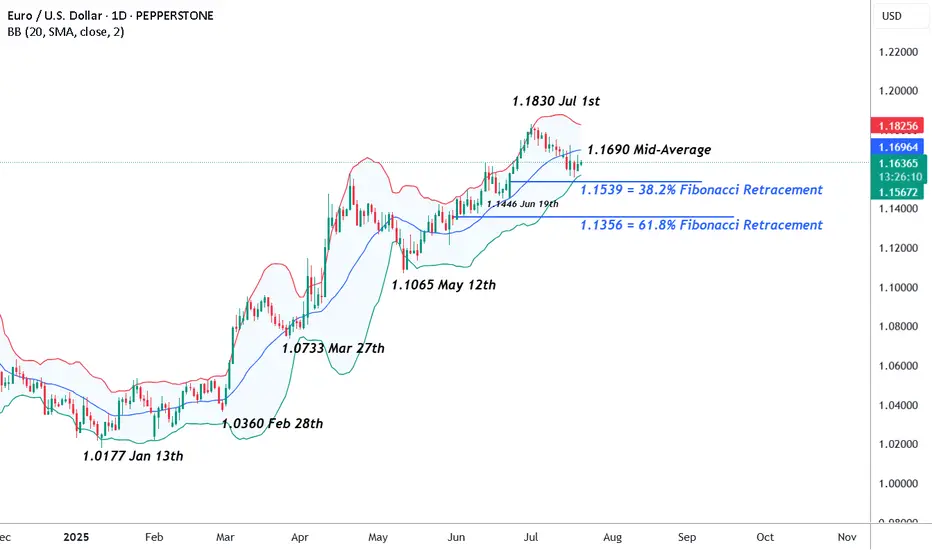
After a period of price strength, it can be useful to calculate Fibonacci retracements on the latest up move to identify areas of potential support. As the chart below shows, for EURUSD, the latest phase of price strength seen from 1.1065 the May 12th low up to 1.1830, the July 1st high can be used for this purpose.
The 38% retracement of this advance stands at 1.1539 and after having remained intact during last week’s sell off, traders may now be watching how this support level performs on a closing basis.
Breaks below 1.1539, while not a guarantee of further price declines, may then lead to a deeper phase of weakness towards 1.1446, the June 19th low, even 1.1356, which is equal to the lower 61.8% retracement level.
Potential Resistance Levels:
If the 38% retracement support at 1.1539 holds any future price weakness in the week ahead, a positive trending condition may still be in place, opening the possibility of EURUSD moving back to higher levels again.
Any potential upside move could bring 1.1690 into play as an important resistance. This is the current level of the Bollinger mid-average, with closing breaks above this needed to open retests of 1.1830 July 1st highs, maybe further if this is in turn broken.
The material provided here has not been prepared accordance with legal requirements designed to promote the independence of investment research and as such is considered to be a marketing communication. Whilst it is not subject to any prohibition on dealing ahead of the dissemination of investment research, we will not seek to take any advantage before providing it to our clients.
Pepperstone doesn’t represent that the material provided here is accurate, current or complete, and therefore shouldn’t be relied upon as such. The information, whether from a third party or not, isn’t to be considered as a recommendation; or an offer to buy or sell; or the solicitation of an offer to buy or sell any security, financial product or instrument; or to participate in any particular trading strategy. It does not take into account readers’ financial situation or investment objectives. We advise any readers of this content to seek their own advice. Without the approval of Pepperstone, reproduction or redistribution of this information isn’t permitted.
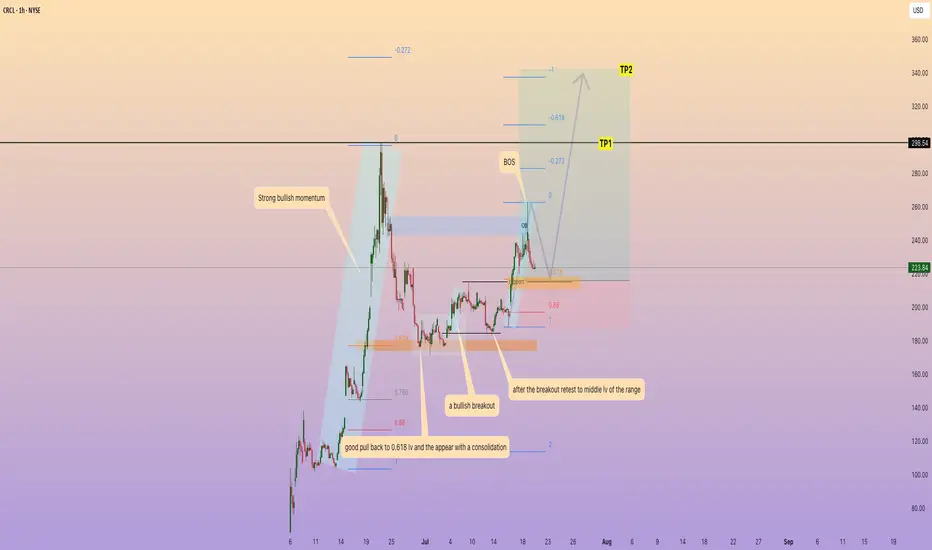
CRCL good pull back and prepare for a new Higher high1. Strong bullish momentum from $104 to $298
2. good pull back to 0.618 lv and the appear with a consolidation
3. a bullish breakout
4. after the breakout retest to middle lv of the range
5. another strong bullish momentum appear from $189 to $262
good setup at $216 is the lv of resistance-support + 0.618 pull back
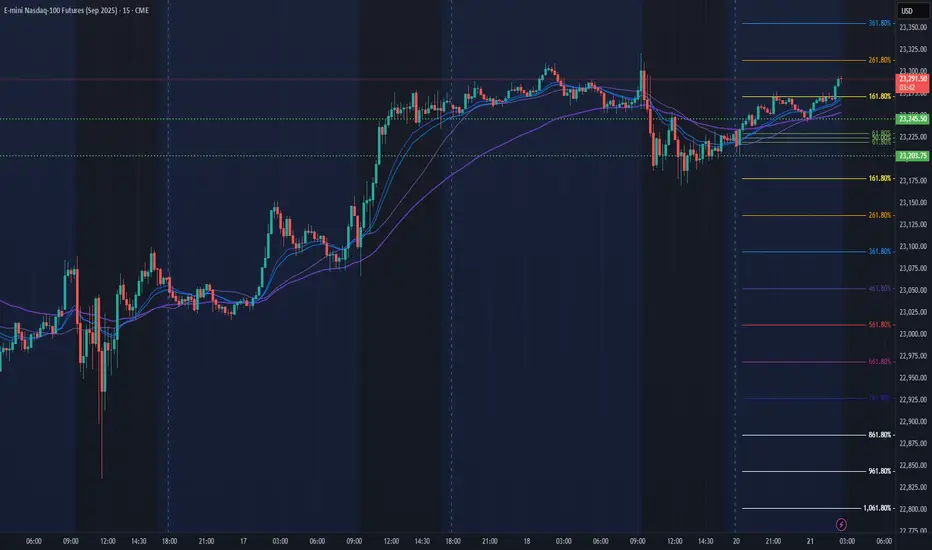
NQ Power Range Report with FIB Ext - 7/21/2025 SessionCME_MINI:NQU2025
- PR High: 23203.75
- PR Low: 23245.50
- NZ Spread: 93.25
No key scheduled economic events
In range to continue pushing ATH
Session Open Stats (As of 1:45 AM 7/21)
- Session Open ATR: 266.36
- Volume: 21K
- Open Int: 274K
- Trend Grade: Neutral
- From BA ATH: -0.1% (Rounded)
Key Levels (Rounded - Think of these as ranges)
- Long: 23811
- Mid: 22096
- Short: 20383
Keep in mind this is not speculation or a prediction. Only a report of the Power Range with Fib extensions for target hunting. Do your DD! You determine your risk tolerance. You are fully capable of making your own decisions.
BA: Back Adjusted
BuZ/BeZ: Bull Zone / Bear Zone
NZ: Neutral Zone
3-Year Euro Uptrend — An Absurdity Amid a Weak EconomyCMCMARKETS:EURUSD
The euro is climbing, hitting its highest levels since late 2021 near $1.18. This surge is driven by diverging central bank policies—with the ECB holding rates steady while the Fed leans dovish—amid global tensions that push gold higher and rattle markets, weakening the dollar even though the eurozone economy remains fragile.
📉 1️⃣ Dollar Weakness Takes Center Stage
Since its January 2025 peak, the U.S. Dollar Index (DXY) has fallen by over 11% 📉—one of its worst starts in decades, comparable to the slumps of 1986 and 1989. As inflation cools, markets are betting on Fed rate cuts, pulling U.S. Treasury yields lower. Coupled with monetary policy divergence and tariff drama, the dollar’s usual safe-haven appeal is fading, even amid ongoing geopolitical tensions.
📊 2️⃣ Fed–ECB Policy Divergence
While the ECB has signaled the possibility of one or two cuts this year, markets are pricing in a milder path. By contrast, the Fed is tilting dovish, with swaps markets expecting a rate cut in September and another by December 🗓️. This widening yield differential supports EUR/USD, even though eurozone growth remains soft.
⚖️ 3️⃣ Trump Tariff Risks and Sentiment Shift
Uncertainty around U.S. trade policy—especially the threat of renewed tariffs—has weighed more heavily on USD sentiment than on eurozone currencies. Markets view these tariffs as inflationary and damaging to U.S. growth prospects. Speculative positioning data confirms record bearish sentiment on the dollar, with funds underweight USD for the first time in 20 years 💼.
💶 4️⃣ Eurozone’s Fiscal Shift
Germany has begun spending and borrowing, marking a dramatic pivot from years of fiscal restraint. This has raised hopes for an investment-driven recovery across the eurozone. Meanwhile, ECB President Christine Lagarde is avoiding signaling aggressive cuts, stabilizing market expectations and maintaining a sense of monetary calm—for now 🛡️.
🛡️ 5️⃣ Safe-Haven Flows Shifting
Traditionally, geopolitical stress boosts the USD as a safe haven. This cycle is different: investors are increasingly turning to gold, the Swiss franc, and the yen as defensive assets, indirectly supporting the euro. In April, when Trump delayed tariff plans, safe-haven USD flows unwound further, fueling euro gains 💰.
⚠️ Risks Ahead for EUR/USD:
💔 Weak Eurozone Fundamentals:
The eurozone economy is not booming. The IMF projects just 0.9% growth for 2025, with Germany, France, and Italy struggling to regain momentum. The ECB’s Financial Stability Review flags worsening credit conditions, weak private investment, and deteriorating balance sheets, none of which support sustained euro appreciation 📉.
🚢 A Strong Euro Hurts Exports:
Eurozone exporters in machinery, chemicals, and autos are already facing squeezed margins from rising input costs and global protectionism. A stronger euro makes exports less competitive, shrinking the eurozone’s current account surplus, which dropped sharply from €50.9 billion in March to €19.8 billion in April, according to the ECB 📊.
⚡ Political Risks Looming:
Fragile coalitions in Germany, budget battles in France, and rising anti-EU sentiment in Italy and the Netherlands could swiftly unwind euro gains if tensions escalate. Should the ECB turn dovish to support a weakening labor market, the euro’s rally could reverse quickly 🗳️.
📈 7️⃣ Technical Picture: Overextension Warning
In addition to the macro drivers, EUR/USD is now technically overextended. The pair has already retraced exactly 78.6% of its major bearish trend that started in January 2021 and ended in September of that year. Ahead lies a strong resistance zone at 1.18000–1.20000, which will be difficult to break without a significant catalyst.
Notably, the daily chart shows bearish RSI divergence, indicating fading momentum beneath the surface of this rally. A pullback toward the 1.13000 level would not be surprising, even as near-term momentum remains strong. This technical setup calls for caution while the pair tests these critical levels.
📈 Technical Outlook: EUR/USD Showing Signs of Overextension
Beyond macroeconomic factors, EUR/USD is currently technically overextended. The pair has retraced exactly 78.6% of its major bearish trend that began in January 2021 and concluded in September the same year. It is now approaching the upper boundary of a 3-year ascending channel, facing a significant resistance zone between 1.18000 and 1.20000—a hurdle unlikely to be crossed without a strong catalyst.
Additionally, the weekly chart reveals a bearish RSI divergence, signaling that underlying momentum is weakening despite the recent rally. Given this, a pullback toward the 1.13000 level is plausible, even as short-term momentum remains robust. This technical setup advises caution as the pair navigates these critical resistance levels.

TSEM watch $35.42/85: Key Fib zone may End Bounce or mark BottomTSEM looking "strong" amongst weak chip makers.
Testing resistance a third time, perhaps the charm.
Break-n-Retest would = BOTTOM IN, reject = DOOM.

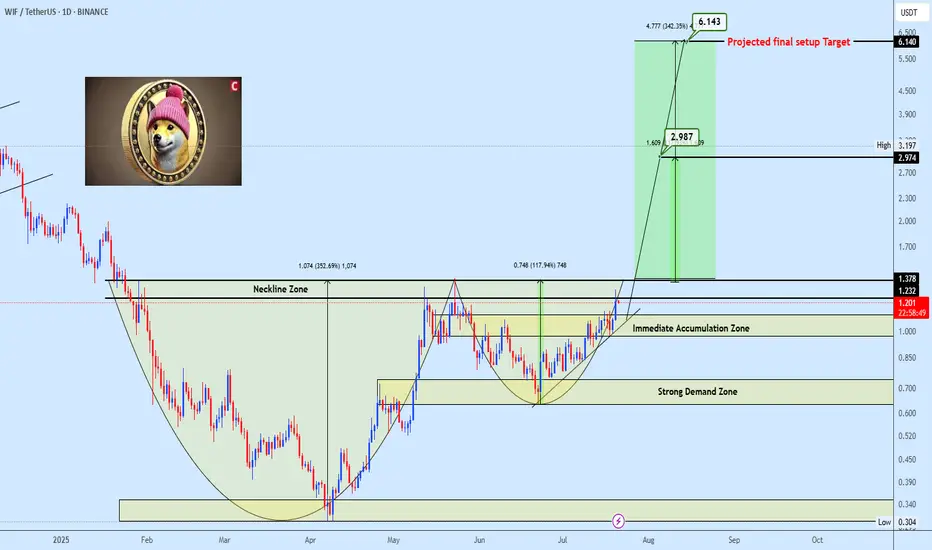
WIFUSDT strong Bullish formationWIFUSDT is currently developing a classic Cup and Handle pattern, with the handle approaching the key neckline resistance zone. The neckline is acting as a strong barrier, and a confirmed breakout above this level is expected to trigger significant bullish momentum.
Target levels are clearly outlined on the chart. Keep a close watch on this setup, it has the potential to accelerate quickly once the breakout is validated.
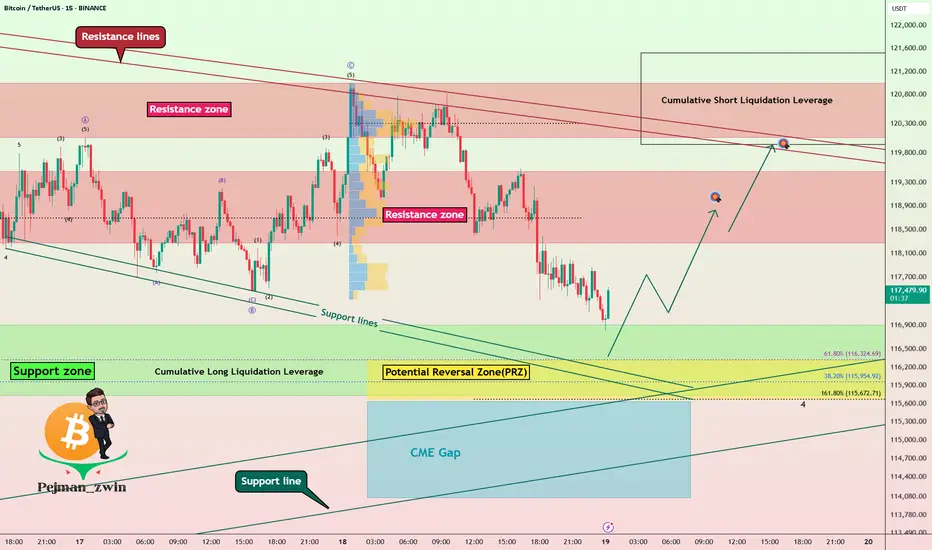
Bitcoin Technical Setup: Support Holds, Eyes on $118,600Bitcoin ( BINANCE:BTCUSDT ) moved as I expected in the previous ideas and finally completed the CME Gap($117,255-$116,675) in the last hours of the week. ( First Idea _ Second Idea )
Before starting today's analysis, it is important to note that trading volume is generally low on Saturday and Sunday , and we may not see a big move and Bitcoin will move in the range of $121,000 to $115,000 ( in the best case scenario and if no special news comes ).
Bitcoin is currently trading near the Support zone($116,900-$115,730) , Cumulative Long Liquidation Leverage($116,881-$115,468) , Potential Reversal Zone(PRZ) , and Support lines .
According to Elliott Wave theory , Bitcoin had a temporary pump after the " GENIUS stablecoin bill clears House and heads to Trump's desk " news, but then started to fall again, confirming the end of the Zigzag Correction(ABC/5-3-5) . Now we have to wait for the next 5 down waves or the corrective waves will be complicated .
I expect Bitcoin to rebound from the existing supports and rise to at least $118,600 . The second target could be the Resistance lines .
Do you think Bitcoin will fill the CME Gap($115,060-$114,947) in this price drop?
Cumulative Short Liquidation Leverage: $121,519-$119,941
Do you think Bitcoin can create a new ATH again?
Note: Stop Loss(SL)= $114,700
Please respect each other's ideas and express them politely if you agree or disagree.
Bitcoin Analyze (BTCUSDT), 15-minute time frame.
Be sure to follow the updated ideas.
Do not forget to put a Stop loss for your positions (For every position you want to open).
Please follow your strategy and updates; this is just my Idea, and I will gladly see your ideas in this post.
Please do not forget the ✅' like '✅ button 🙏😊 & Share it with your friends; thanks, and Trade safe.
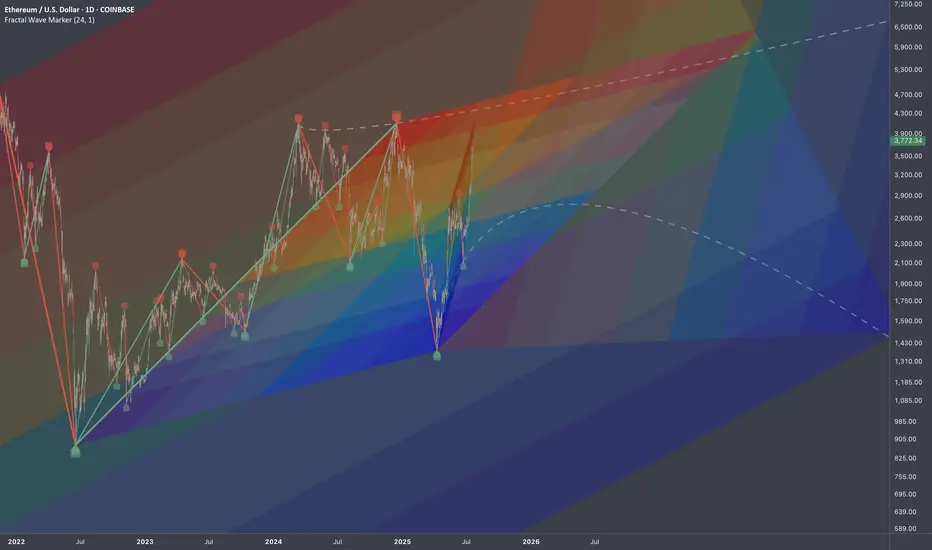
ETHUSD: Multi-Scale LevelsResearch Notes
Price is getting close to connected tops (after which rejections happened).
If we scale out, there is larger narrative Giving vital points of reference.
The dynamics look like part of various progressions at the same time. For example, to answer why price grew from sub-2k levels in the first place, I would pay attention to how it had been falling. Even if price breaks above white line, the ongoings cycle still inherits the prolonged timing.
Interconnection of levels with structural significance:
⬩At smaller scale, fibonacci channel adjusted to the angle of the first small cycle
⬩Scaling out the structure from previous cycle to relate to the levels of local scope.
⬩The final frame of reference covers the case where price expands breaking domestic range.
BTC/USD Short-Term🔷 Pattern: Symmetrical Triangle (Consolidation)
The price is inside the triangle formation (orange lines) and is approaching its completion.
An impending breakout (up or down) is highly probable within the next few hours.
📉 Support Levels (red lines):
117.210 – local horizontal support.
116.324 – 115.050 – strong demand zone (potential target in the event of a downward breakout).
📈 Resistance Levels (green lines):
118.900 – 119.700 – local resistance zone.
121.011 – 121.813 – higher target in the event of an upward breakout from the triangle.
📊 Technical indicators:
✅ RSI (Relative Strength Index):
Currently: 69.05 – close to overbought levels, but not yet at an extreme.
Potential for a short-term pullback unless a strong breakout occurs.
✅ MACD:
Signal lines are tightly intertwined, histogram flat → no dominant momentum.
Waiting for a breakout signal (bullish or bearish crossover).
✅ SMA:
Price currently below the 50 and 200 SMA for 1 hour → slight downward momentum.
The 50-SMA (red) is turning down, which may signal a continuation of the sideways or downward trend.
📌 Short-term conclusions (1–6 hours):
Scenario 1: Bullish breakout:
Confirmation: H1 candle close above 118,900.
Targets: 119,700 and potentially 121,000–121,800.
Scenario 2: Bearish breakout:
Confirmation: H1 candle close below 117,200.
Targets: 116,300, then 115,000–115,300.
📍 Watch for:
Breakout of the triangle boundaries with volume.
RSI behavior relative to the 70 level.
MACD crossover and histogram.

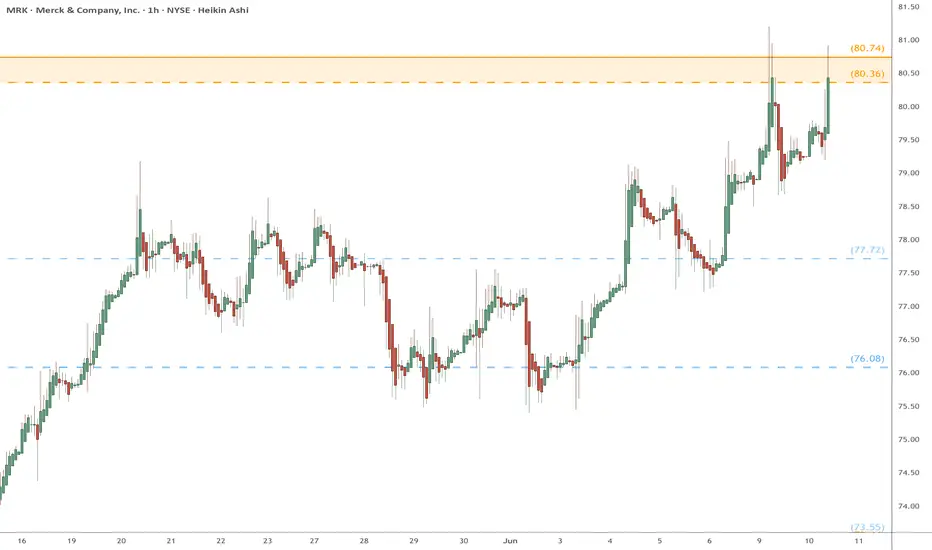
MRK eyes on $80.36/74: Double Golden zone break to end DownTrendMRK and all pharma has been dropping forever.
Just pierced the Double Golden zone yet again.
Break and Hold of this zone will say "bottom".
.
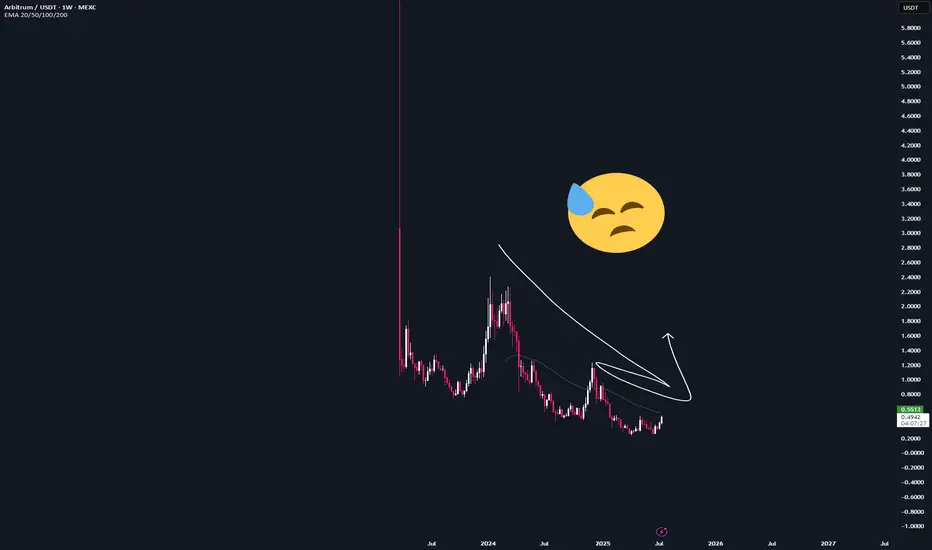
ARB | Full-analysisHere is the top-down analysis for ARB as requested 🫡
Weekly Timeframe:
There are currently no valid bullish structures on the weekly chart, as AMEX:ARB has put in lower lows.
So we have no clear targets from a weekly perspective at this point.
Daily Chart:
A new bullish sequence was just activated with the break of the recent high at $0.505, targeting the $0.67–0.77 region.
This strongly suggests that the cycle low for AMEX:ARB is likely in.
Every pullback into the B–C correction zone (Fib 0.5–0.667) is a potential long opportunity, and I plan to take it if we revisit that area.
I will place 4 long orders, each with a stop-loss just below the next level.
There is currently nothing interesting happening on the lower timeframes.
--------
Thats the my full Analysis for AMEX:ARB , hope it was helpful if yall have anymore questions feel free to ask, and if you want me to do another analysis for any other pair just comment down below.
Thanks for reading❤️
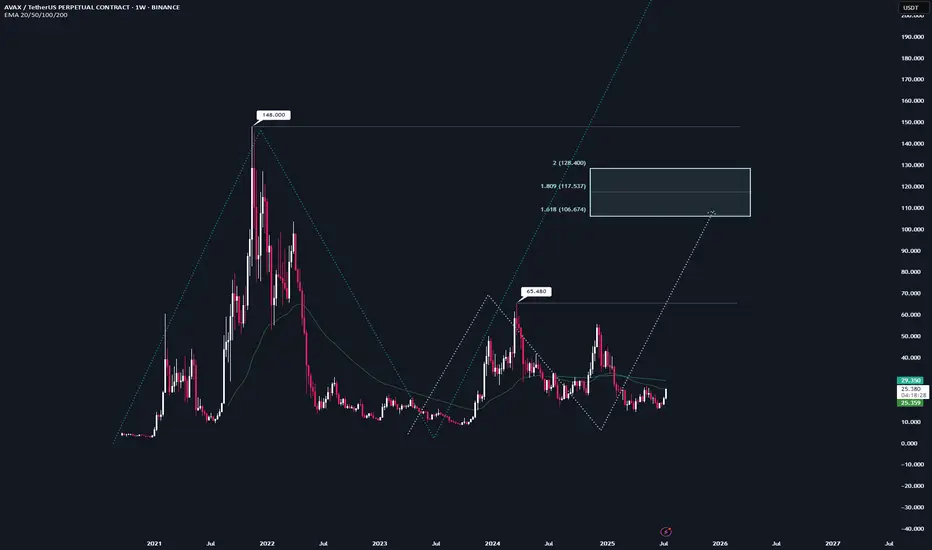
AVAX | Full Analysis Here is the top-down analysis for AVAX as requested 🫡
Weekly Timeframe:
We currently have two potential bullish structures on the weekly chart, but neither has been activated yet.
The first one (light turquoise) will be activated once we break the local high at $65. Until then, there's no valid trade setup. This sequence has it target range at $106–128.
The second structure (turquoise) gets activated once we break the all-time high at $148. It then targets the $242–298 range, which also represents my conservative bull run targets for $AVAX.
On the weekly chart, the strategy is to HODL. I wouldn't buy at this point, and I definitely wouldn't sell—because if we see another altcoin season (which in my view is nearly guaranteed), there's no reason AVAX shouldn't reach its targets around $242.
I would personally start taking profits at $106, then again at $148, and be fully out at $242.
Daily chart:
Here we have a potential structure that will be activated once we break the recent high at $26.
From that point on, according to the rulebook, every pullback into the B–C correction level (Fib 0.5–0.667) becomes a tradable opportunity.
Local Priceaction:
Three days ago, we successfully broke through the bearish reversal zone (red) and reached the bullish target zone (turquoise).
Now, every pullback into the B–C correction area becomes a valid long entry. If the price turns around and reaches that area again, I’ll trade each level with a stop-loss just below the next key level.
--------
Thats the my full Analysis for CRYPTOCAP:AVAX , hope it was helpful if yall have anymore questions feel free to ask, and if you want me to do another analysis for any other pair just comment down below.
Thanks for reading❤️
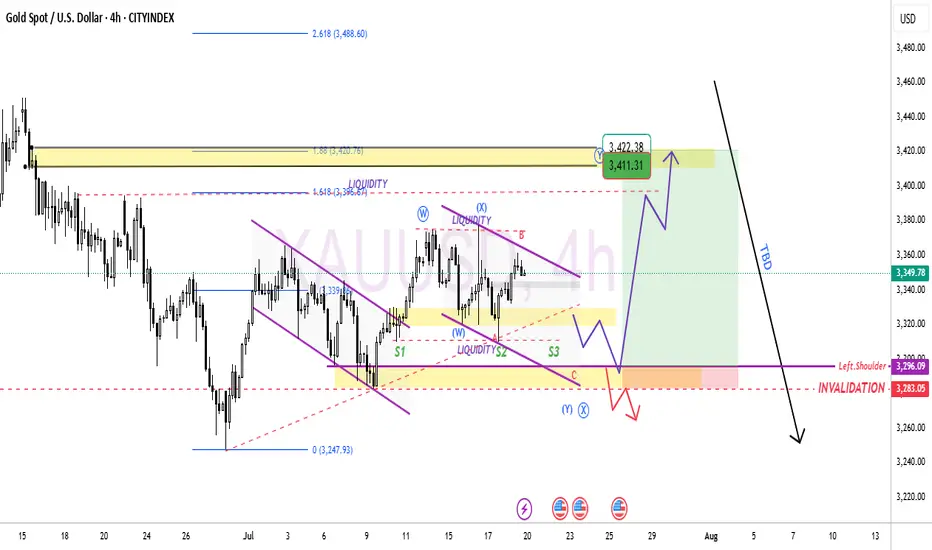
gold idea for bullish
Here my previous ideas for gold..
For this week,I would like to wait price trigger price 3296 for continue entry long.
Target price around 3411 - 3422 =)
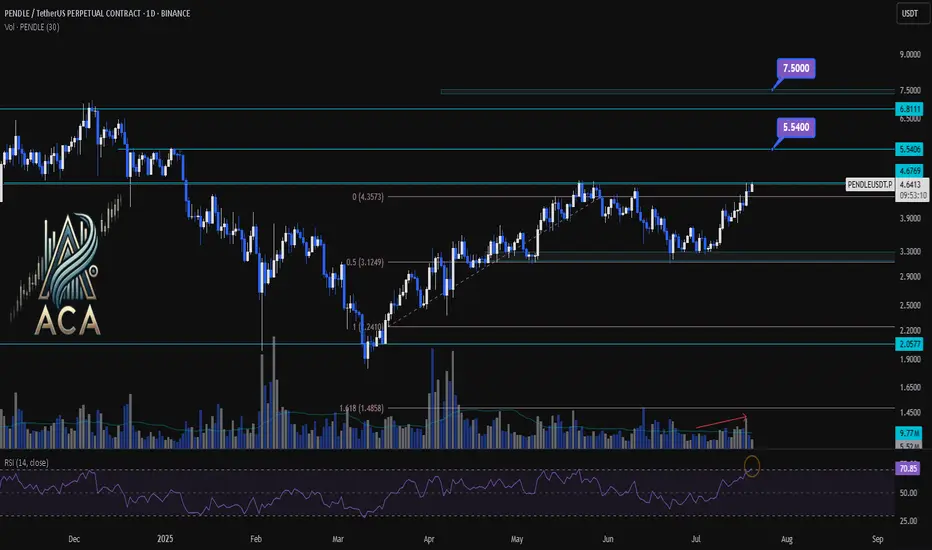
PENDLEUSDT 1D Chart Analysis|Bullish Breakout Eyes Higher TargetPENDLEUSDT 1D Chart Analysis | Bullish Breakout Eyes Higher Targets
🔍 Let’s break down the PENDLE/USDT daily chart, focusing on breakouts above key resistance, Fibonacci retracement dynamics, RSI momentum, and volume confirmation for a comprehensive bullish setup.
⏳ Daily Overview
PENDLE has staged a powerful recovery after pulling back to the 0.5 Fibonacci retracement level (around $3.12). Price is now testing the critical $4.68 resistance—the ceiling from the last corrective wave. RSI has jumped above 71, entering the overbought zone, a classic precursor to strong momentum moves. Volume is rising as bulls attempt a breakout, confirming participation behind the price action.
📈 Technical Convergence and Trend Structure
- Fibonacci Structure: The correction held the 0.5 retracement, a textbook bullish reversal zone in rising trends.
- Resistance Breakout: Price is challenging the $4.68 resistance. A daily close above, especially with high volume, would confirm the breakout and trigger bullish continuation.
- RSI Indicator: RSI has cleared the 70 mark, reinforcing strong momentum. Overbought RSI often supports further rallies when backed by breakout moves and rising volume.
- Volume Confirmation: Volume surged as PENDLE reclaimed lost ground and is now accelerating into the resistance test, suggesting trend conviction and confirming the move.
🔺 Bullish Setup & Targets
- First target: $5.54 — the next resistance based on historical supply and Fibonacci extension.
- If macro conditions like interest rate cuts align, the next potential target: $7.50 — the major extension target where price discovery is likely.
- Key trigger: A strong daily (or weekly) close above $4.68, combined with breakout volume, is likely to ignite the next leg up.
📊 Key Highlights
- Correction held at the 0.5 Fibo, signaling trend health and resetting momentum.
- A bullish daily structure aligned with a weekly breakout confluence.
- RSI and price action both making new local highs — strong uptrend indication.
- Volume confirming the move—a real breakout is underway, not a false start.
🚨 Conclusion
PENDLE/USDT looks primed for continuation higher. The blend of a successful 0.5 retracement retest, breakout attempt above $4.68, robust RSI, and volume surge all point to bullish follow-through. Watch for a confirmed close above resistance as the catalyst for further upside, with $5.54 and $7.50 the next logical targets if momentum persists.
ETH roadmap to 5000!Ethereum Wave 3 in Play? Eyes on the $4500 Target
Ethereum may currently be progressing through a wave 3, which is often the strongest leg of an impulse. The structure so far supports that idea, and based on standard projections, the most likely target sits near $4500.
If price can break and hold above the 4k level, we could see a consolidation forming above the previous high. That would be a constructive sign and might set up the next leg higher.
But there’s still a chance ETH struggles to clear that level. If that happens, consolidation could form just underneath, which would still be acceptable within a wave 3 framework. What matters next is the shape and depth of the pullback.
Wave 4 will be the key. A shallow or sideways correction would keep bullish momentum intact. A deeper pullback doesn't ruin the structure, but it does mean we’ll need to watch support zones more closely.
If wave 4 behaves well and broader market conditions stay supportive, then a final wave 5 could bring ETH into the $5000 region. That’s the upper edge of this current roadmap, based on conservative assumptions.
Stay flexible. Let the structure guide the bias.

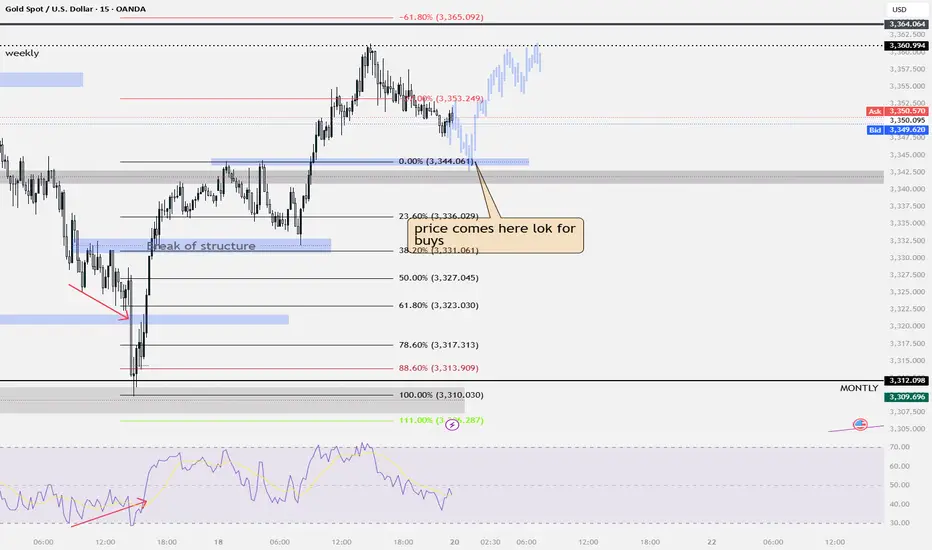
gold buysim looking for buys this week on gold price has been consolidating for the past few weeks. on friday price broke structure on the m15 structure went higher and created new highs... im im looking for a retest of the higher high
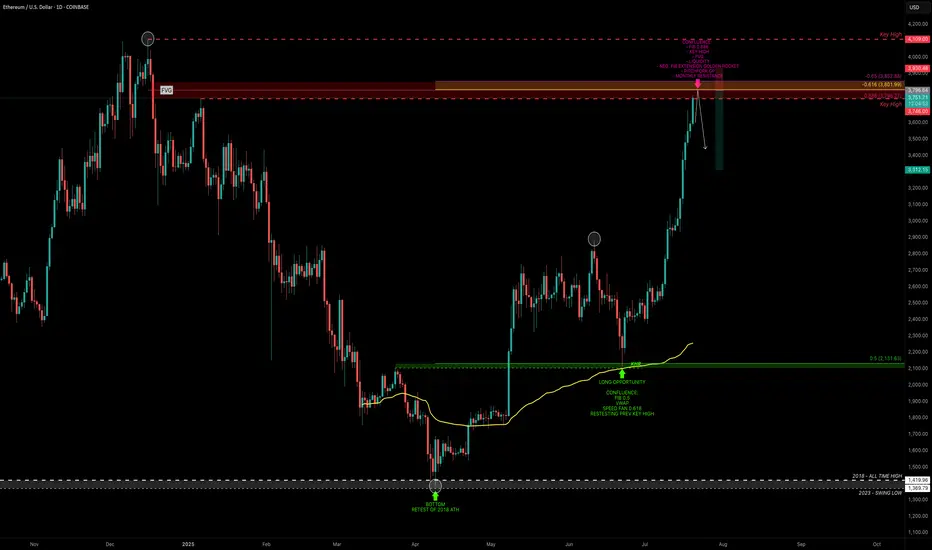
ETH — Rally Exhaustion or More Upside?ETH has been on an absolute tear. After retesting its old 2018 all-time high, it marked a bottom at $1383 — a brutal -66% correction over 114 days from the $4109 top.
From there, ETH ripped +100% in just one month, followed by 40 days of consolidation, and now, over the past 28 days, it’s surged another +76%, currently trading around $3715 — all without any major correction.
So the big question:
What’s next? Are we near a short setup, or is it time to long?
Let’s break it down.
🧩 Key Technicals
➡️ Bounce Zone:
On June 22, ETH retested the 0.5 fib ($2131.63) of the prior 5-wave Elliott impulse, with extra confluence from:
Anchored VWAP
Speed fan 0.618
➡️ Key Highs to Watch:
$3746 → recent local high
$4109 → 2021 all-time high
➡️ Fib Retracement Levels:
ETH has smashed through all major fibs, including the golden pocket (0.618–0.65) and 0.786 fib. The 0.886 fib at $3798.27 is the last major resistance, just above the $3746 key high.
At this zone, we also have:
Fair Value Gap (FVG)
Monthly Resistance
Negative Fib Extension Golden Pocket Target
➡️ Momentum Signal:
ETH is currently on its 8th consecutive bullish daily candle — historically, after 8–13 consecutive candles, price tends to cool off or correct. A sign to be cautious about longing here and consider profit-taking.
🔴 Short Trade Setup
Look for a potential SFP (swing failure pattern) at the key high $3746 to initiate a short trade.
This offers a low-risk setup with:
Entry: around $3746 (if SFP confirms)
Target (TP): ~$3300
Stop-loss: above SFP
R:R ≈ 1:4+
💡 Educational Insight: Why You Don’t Want to Long the Top
Markets often trap late longers near key highs or resistance zones — this is where smart money distributes while retail piles in emotionally.
Lesson: Look for zones of confluence (fib, VWAP, liquidity, FVG) and avoid chasing extended moves after multiple bullish candles.
Patience and confirmation at reversal points lead to higher-probability setups — you don’t need to catch every pump.
Final Thoughts
We’re approaching major highs, so this is a time for caution, not FOMO. Watch for reaction and potential reversals near $3750–$3850.
Stay sharp, manage risk — and remember, tops are where longs get trapped.
_________________________________
💬 If you found this helpful, drop a like and comment!
Want breakdowns of other charts? Leave your requests below.
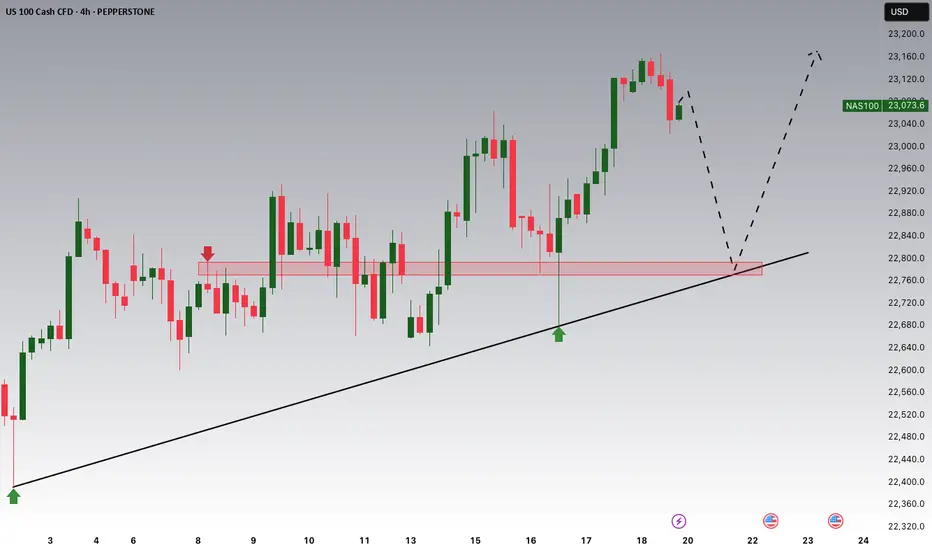
NASDAQ Potential UpsidesHey Traders, in tomorrow's trading session we are monitoring NAS100 for a buying opportunity around 22,780 zone, NASDAQ is trading in an uptrend and currently is in a correction phase in which it is approaching the trend at 22,780 support and resistance area.
Trade safe, Joe.
$SHIB Ready to Move?CRYPTOCAP:SHIB has printed confirmed weekly bullish divergence in RSI and is now attempting to overcome the weekly 200EMA resistance.
A High Volume Node lies just above but a close above this will signal a bullish trend ready to move the initial target of the weekly pivot point followed by the 0.0003579 High Volume Node.
Price completed its retracement to the 'alt-coin' golden pocket 0.786 Fibonacci retracement.
Bearish divergence is currently growing on the weekly RSI but will be diverted with a thrust high!
Is it MEME season? CRYPTOCAP:DOGE also looks ready to go!
Safe trading
