New targets for Reddit RDDT In this video I recap the previous reddit analysis where we looked for the long which is playing out really well .
I also look at the current price action and simulate what I think could be a target for the stock moving forward using Fib expansion tools as well as levels below for price to draw back too.
Welcome any questions below the chart . Thanks for viewing
Fibonacci

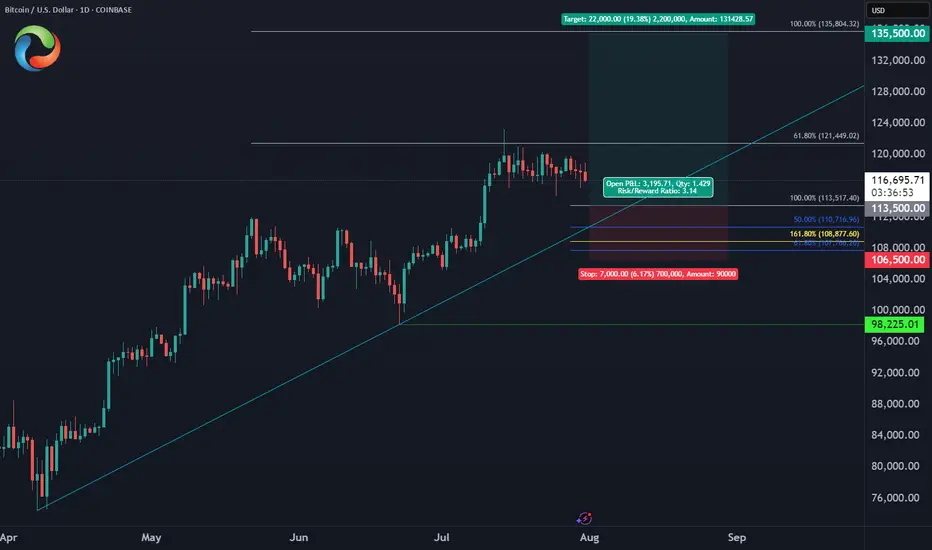
Bitcoin August Trade PlanBINANCE:BTCUSD
✅Entry Zone: $113,500 - $110,700
⛔️Stop: $106,500 (below June low)
🎯Target: $135,500 (ATH liquidity)
🔖Risk/Reward: 1:3
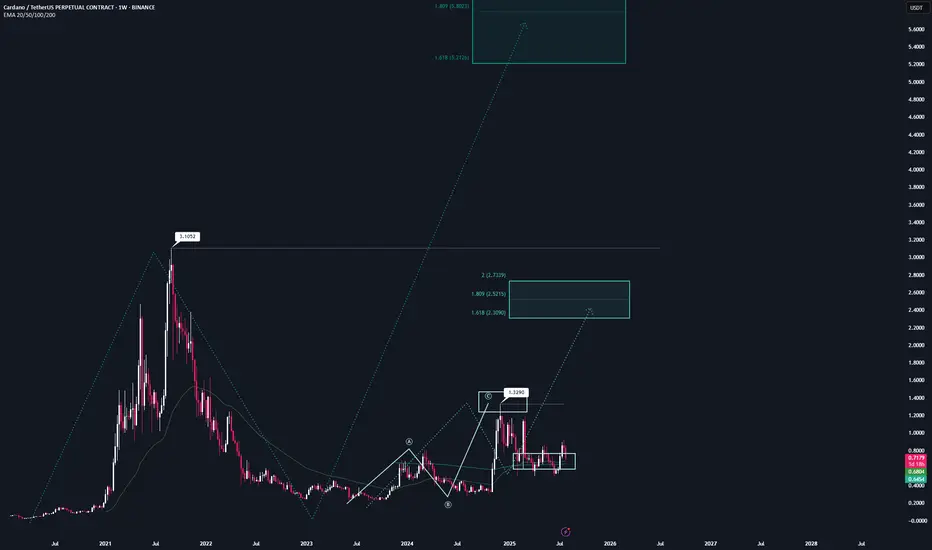
ADA | Full AnalysisHere is the top-down analysis for CRYPTOCAP:ADA as requested 🫡
Weekly Timeframe:
We have one large potential sequence on the weekly chart that will be activated once we break the ATH at $3.1, with a target zone around $5.2. This is also my conservative target for this bull run, assuming we get the “altseason” everyone is hoping for.
We’ve also already completed a smaller sequence on the weekly chart and then corrected into the overall correction level.
If we break the November high at $1.3, we will also activate a new structure that could take us close to the ATH.
Daily Chart:
On the daily chart, we were rejected at the bearish reversal area (green) and corrected down into the B–C correction level, followed by a continuation into the target zone.
According to the rulebook, I expect a bounce from these regions and have positioned myself accordingly with 4 long orders — one at each level.
Local price action:
On the 4H chart, we have a bearish sequence that is counter to the primary scenario. Statistically, it’s less likely to play out, but it’s still worth noting.
The bearish reversal area (blue) is the next key level to watch if we get a bounce here.
If this area is broken, the follow-up move becomes very likely.
-----
Thats the my full Analysis for CRYPTOCAP:ADA , hope it was helpful if you want me to do another analysis for any other pair just comment down below.
Also, if anyone is interested in how my trading system works, let me know and I’ll post some educational content about it.
Thanks for reading❤️
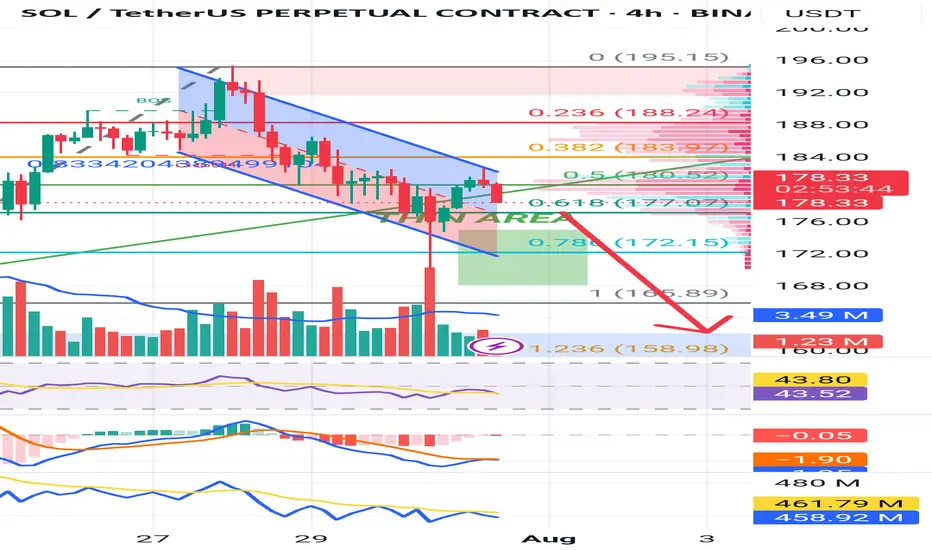
The next levels for Solana coinIn this video I recap the previous video and discuss what may be next after the current retracement .
I reveal some important levels that sit below as well as the relationship with the Eth/Btc chart.
Tools used vwap, Fibs and volume profile .

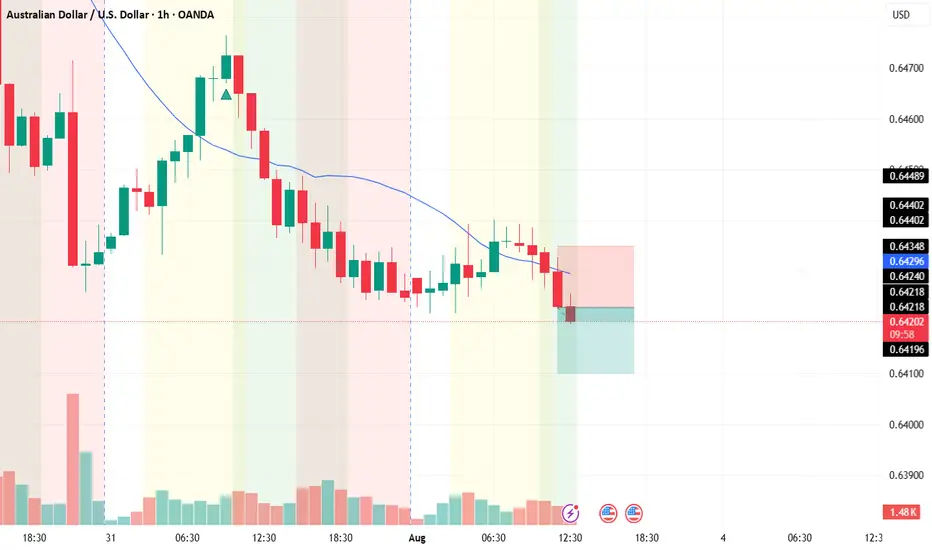
AUD/USDThis is a trade setup for AUD/USD, based on volume and trend analysis.
Entry Price: 0.64230
Stop-Loss (SL): 0.64350
Take-Profit (TP): 0.64100
The trade is intended to be executed instantly at the mentioned price, in alignment with both volume behavior and the current trend direction.
Disclaimer: This setup is shared purely for backtesting purposes and to document trade ideas. It is not financial advice. Always perform your own analysis before making any trading decisions.
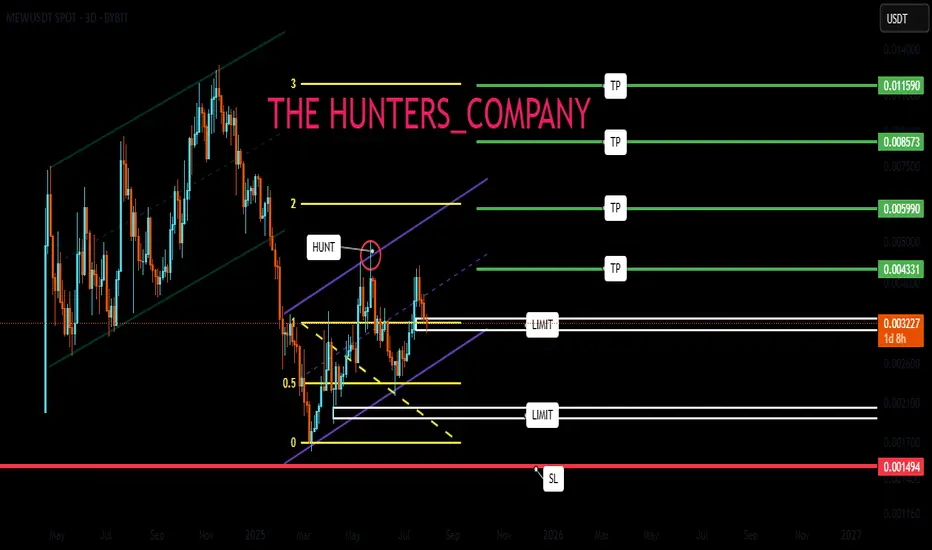
MEW : A meme coin that hasn't grown yetHello friends🙌
Given the decline we had, you can see that buyers entered the specified support area and entered the price into the ascending channel. That is why we can buy with risk and capital management and stay with it until the specified targets.
🔥Follow us for more signals🔥
*Trade safely with us*
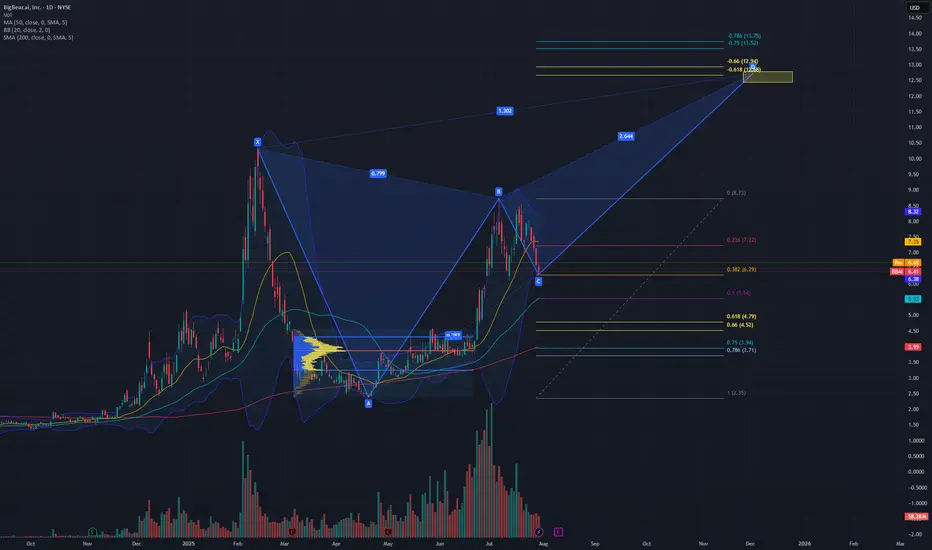
XABCD pattern playing out $12 targetBBAI is looking like it will play out the XABCD butterfly pattern if it continues to rally from the .382 of the pull back from previous $2.35 lows and 8.73 highs.
Breaking down and close below the $6.06 daily candle will potentially expose the previous consolidation POC at $3.87, which is a .75 pull back.
Using Fib time, I am expecting a $12 range around this year in December.
Will look to open a 7/12 bull call spread at Jan 2027 exp.
$AAPL: Structure SurgeryResearch Notes
Original Structure:
Altering structure for experimental purposes
Angle of fib channels that rises from cycle low, has been pushed into the past to the top of first major reaction. blue area resembles the change
Reason
The the angle of Fibonacci channels which cover the general decline (from perspective of ATH to end of cycle), are adjusted to the angle of the first bear wave of smaller scale.
Therefore, when it comes to measurements of opposing forces for working out interference pattern, having this symmetric approach of mapping interconnections is fair.
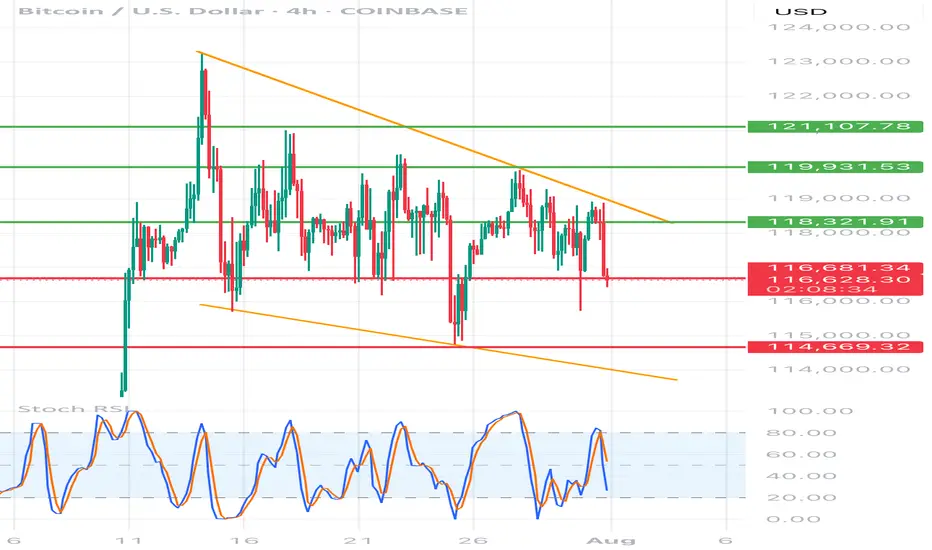
BTC/USD 4h chart🔸 Formation: Triangle descending (descending)
• Upper trend line (orange) - inheritance, connects lower and lower peaks.
• Lower support line (red) - approx. 116,700 USD - key support, tested many times.
🔻 Support
USD 116,700
Tested several times, currently threatened
🔻 Another support
USD 114,669
Target level when struck with a triangle
🔼 Resistance
USD 118,321
The nearest resistance - the former level of support
🔼 Resistance
USD 119,931
Local peak
🔼 Strong resistance
USD 121,107
Upper level of structure
📉 STOCHASTIC RSI (lower indicator)
• Line cutting and a decrease in the purchase area (> 80) towards the center.
• No extreme sales signal, but the trend begins to be negative.
⸻
📌 Applications and possible scenarios:
🔻 Bearish script (more technically likely):
• If BTC breaks below USD 116,700 with a 4H candle closure, possible:
• a decrease around USD 114,669 (lower limit of the triangle)
• Even lower - around 113,500-112,000 USD with an increased volume
🔼 Bullly script (less likely but possible):
• needed quick breaking above USD 118,300 and maintaining above this level
• Then the goal will be USD 119,931, and then possible traffic up to USD 121.107
⸻
📍 Summary:
• We see classic triangle descending-pro-draft formation.
• Support 116,700 USD very close to breaking - if it falls, down movement can be dynamic.
• Stochastic RSI coincides with the deterioration of the moment.
• The inheritance scenario seems dominant, unless there is a strong demand and over 118,300 USD.
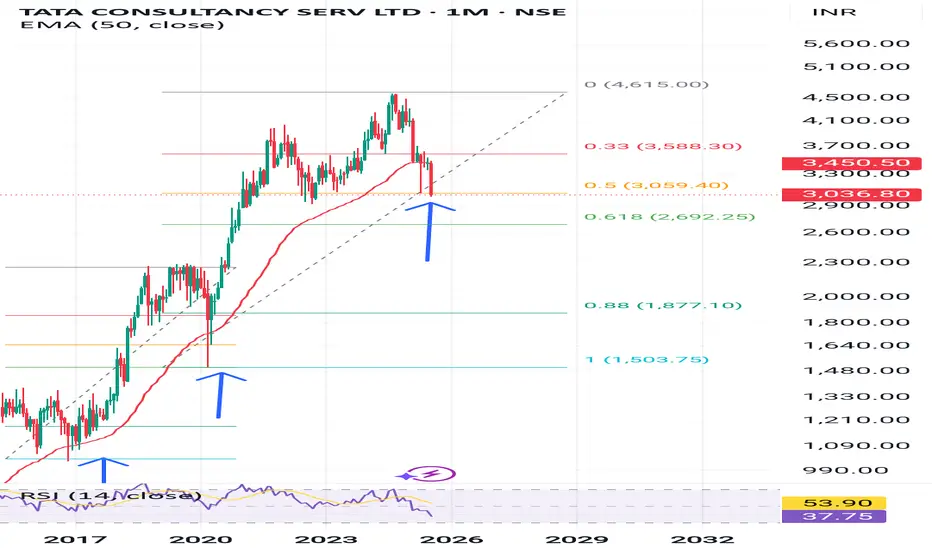
TCS nearing fibonachi support of 2700Historical Analysis of TCS for those who belive in fibonachi levels
Precious retracement of TCS happened exactly till golden ratio 61.8
This time it had already retraced till 50% level.
So buy now or wait till 61.8 levels।
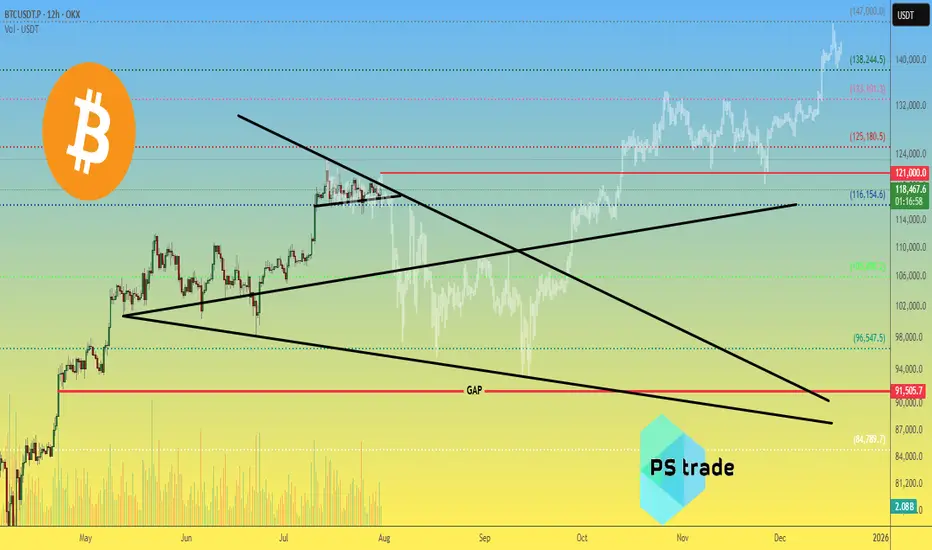
Bitcoin BTC price analysis by the end of 2025🕯 July is coming to an end, with 3 weeks of OKX:BTCUSDT consolidation between $117k–121k.
Tomorrow begins the last month of summer — and it promises to be "hot" as, according to our earlier published calendar Trump's administration plans to send letters with new, increased tariffs to "all countries" on 01.08.
💰 Also, take a look at Bitcoin Monthly Returns. In our view, 2025 resembles 2020 the most.
What do you think?
👉 According to this dynamic, the real "hot" may come not in summer, but late autumn.
💰 We've also tried to find a price fractal for #BTCUSD that fits the current structure — and for now, it looks plausible:
◆ In the coming days, CRYPTOCAP:BTC should not rise above $121k.
◆ A low of correction might hit mid-September around $93k.
◆ A cycle top for #BTC could arrive to the end of 2025, near $147k.
📄 Now that you've seen our version — share your forecasts on future #BTCUSDC price action in the comments 👇
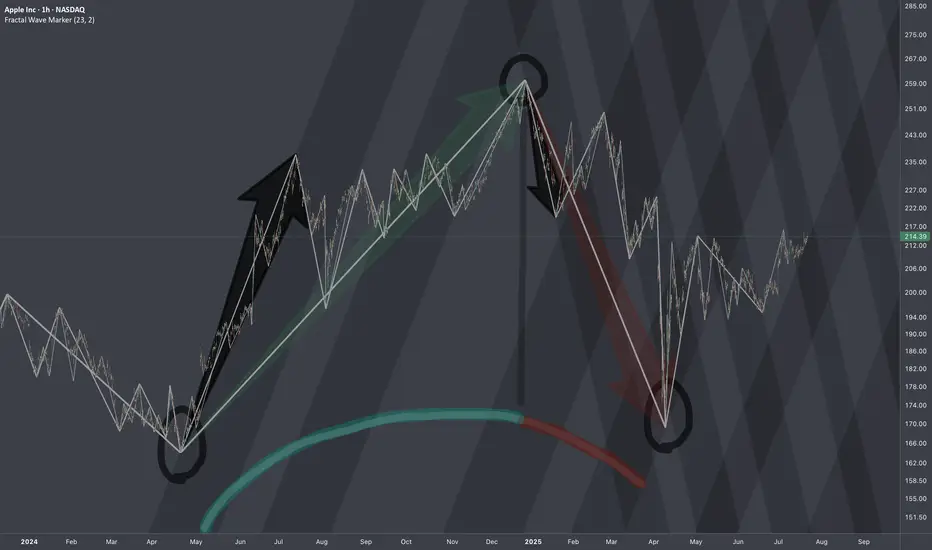
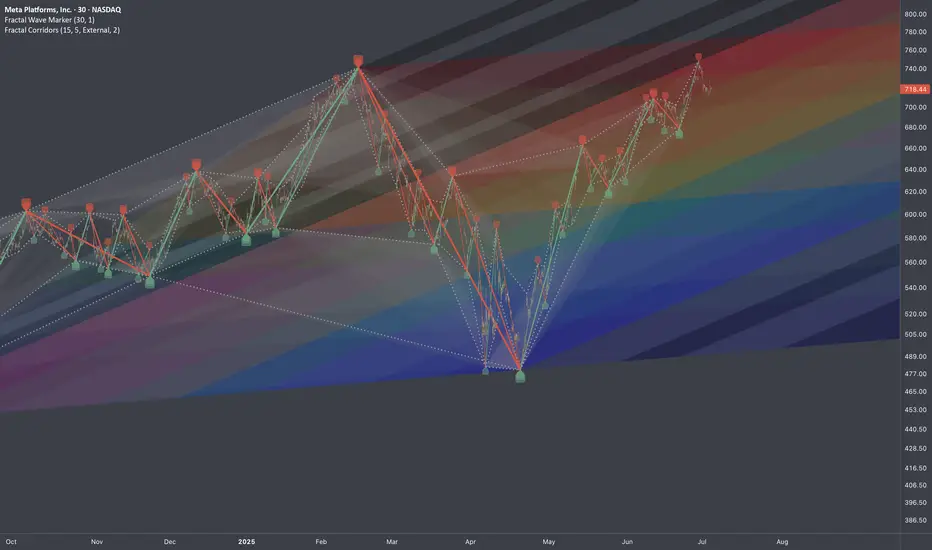
META: Testing Alternative Interconnection TypeResearch Notes
Given expression like this:
Fractal Corridors can be used for horizontal perspective of the same pattern manifestation. Alternative frames of reference exposes how historic swings of various magnitude in some way wire the following price dynamics. tradingview.sweetlogin.com helps to seek a matching commonality in angles of trends which gives a hint how structure evolves in multi-scale perspective.
I use both when it comes to working with complex waves and making interconnections through fibonacci ratios.
To define emerging wave's limits (probable amplitude), I'll test classic rule of Support/Resistance shift in fibs. (When resistance becomes support or vice versa)
By theory it means a trendline can also shift like that.
In our case this can be applied as:
Fibocnacci Structure:
Break down before the run upSo i feel this will go to the 4 hr OB. My reasoning is there's very little buy volume, the OBV is very low even though the price climbed a bit, and the RSI is below 50 still, so still bearish imo. But the market has its own ideas so be wary and watch closely. Make money my friends!
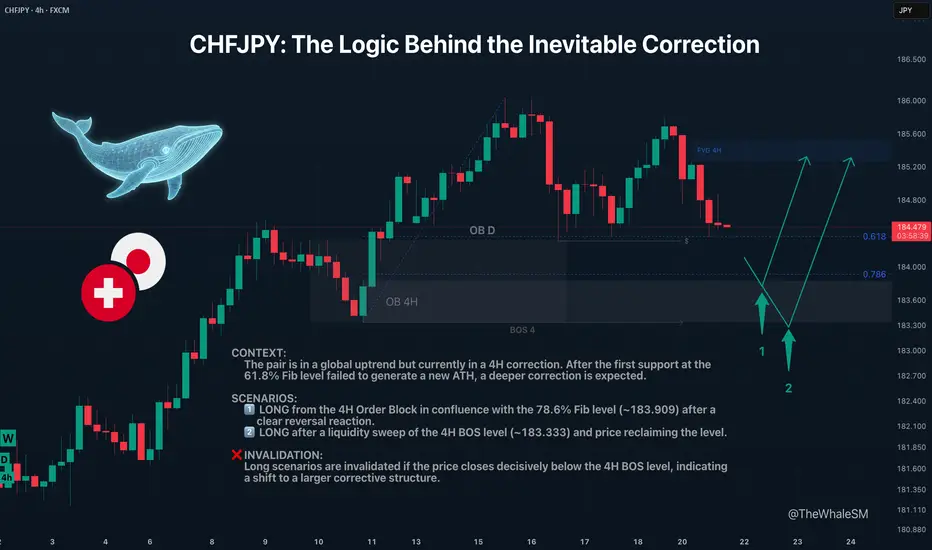
CHFJPY: The Logic Behind the Inevitable CorrectionCHFJPY recently bounced from what seemed like a perfect support level. Many likely saw this as a buy signal. But when the price failed to make a new high, it sent a clear warning: the correction isn't over yet.
This analysis dives into why that first bounce was a trap and where the next institutional levels are waiting below—the ones with the real fuel for the next major move up.
The CHFJPY pair continues its long and strong global uptrend . However, the market cannot move in one direction indefinitely without pullbacks; sooner or later, corrections occur. Large capital, or "Whales," who are the most important market participants, need to refuel with liquidity to continue their advance and to shake off piggybacking competitors. Right now, CHFJPY is in a 4H structure correction .
The first target for this correction was the 61.8% Fib level and a daily order block. The price did show a reversal reaction from them, but it lacked enough liquidity to create a new ATH, and the price continued its corrective movement. The next target for the correction will be the 78.6% Fibonacci retracement level at ~183.909, in conjunction with a 4H order block . This move will also sweep liquidity from the low of July 16th.
Two Potential Long Scenarios
SCENARIO 1: Entry from the 78.6% Fib Level & 4H Order Block
The first long entry scenario will be triggered by a clear reversal reaction from this support confluence.
► Setup Condition: Price must reach this zone, mitigate the order block, and close decisively above the 78.6% level, showing strength. An entry will require LTF confirmation (a BOS or the beginning of LTF order flow).
► Invalidation: If the 78.6% level is broken and the price closes below it, this scenario is invalid. In this case, the 4H order block itself will act as liquidity, and an attack on the 4H structure's break level (BOS 4) will likely occur.
SCENARIO 2: Entry After a Deeper Liquidity Sweep
This path becomes active if the first scenario fails.
► Setup Condition: A liquidity sweep with a candle wick below the 4H BOS level (183.333), with the price then closing back above this level. The final confirmation would be the start of a new order flow on a lower timeframe.
► Invalidation: A decisive close below the 4H BOS level will invalidate all long scenarios and will signal that the correction is shifting to a higher timeframe structure.
~~~~~~~~~~~~~~~~~~~~~~~~~~~~~~~~~~~~~~~~~~~~~~~~~~~~~~~~~~~~~~~~~
The principles and conditions for forming the manipulation zones I show in this trade idea are detailed in my educational publication, which was chosen by TradingView for the "Editor's Picks" category and received a huge amount of positive feedback from this wonderful, advanced TV community. To better understand the logic I've used here and the general principles of price movement in most markets from the perspective of institutional capital, I highly recommend checking out this guide if you haven't already. 👇
P.S. This is not a prediction of the exact price direction. It is a description of high-probability setups that become valid only if specific conditions are met when the price reaches the marked POI. If the conditions are not met, the setups are invalid. No setup has a 100% success rate, so if you decide to use this trade idea, always use a stop-loss and proper risk management. Trade smart.
~~~~~~~~~~~~~~~~~~~~~~~~~~~~~~~~~~~~~~~~~~~~~~~~~~~~~~~~~~~~~~~~~
If you found this analysis helpful, support it with a Boost! 🚀
Have a question or your own view on this idea? Share it in the comments. 💬
► Follow me on TradingView to get real-time updates on THIS idea (entry, targets & live trade management) and not to miss my next detailed breakdown.
~~~~~~~~~~~~~~~~~~~~~~~~~~~~~~~~~~~~~~~~~~~~~~~~~~~~~~~~~~~~~~~~~
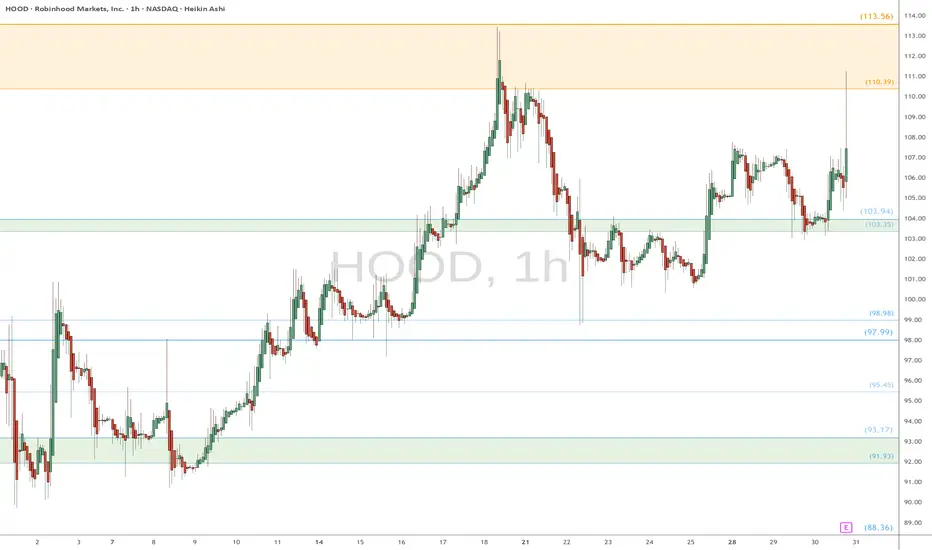
HOOD watch $110 then $113: Dual Golden fibs trying to TOP itHOOD has been a massive bull run since April lows.
Now battling a dual Golden fib zone $110.39-113.56.
Top of the zone is a well proven Golden Genesis fib.
See "Related Publications" for previous charts ------->>>>>>>
Such as this PERFECT catch of a serious bounce:
Hit BOOST and FOLLOW for more such PRECISE and TIMELY charts.
=========================================================
.
Fibonacci Arcs in Stock TradingFibonacci Arcs in Stock Trading
Fibonacci arcs, derived from the renowned Fibonacci sequence, offer a compelling blend of technical analysis and market psychology for traders. By mapping potential support and resistance areas through arcs drawn on stock charts, these tools provide insights into future price movements. This article delves into the practical applications of Fibonacci arcs in trading, their interplay with market psychology, and best practices for effective use.
Understanding Fibonacci Arcs
The Fibonacci arc indicator is a unique tool in technical analysis derived from the famed Fibonacci sequence. It’s crafted by drawing arcs at the key Fibonacci retracement levels - 38.2%, 50%, and 61.8% - from a high to a low point on a stock chart. Each curve represents potential support or resistance areas, offering insights into the stock’s future movements.
The art of arc reading, meaning interpreting these curves, is crucial for traders. When a stock approaches or intersects with an arc, it reflects a significant reaction level. For instance, if a stock price touches or nears an arc, it could face arc resistance, indicating a potential halt or reversal in its trend.
Applying Fibonacci Arcs in Trading
In the stock market, these arcs serve as a guide for traders seeking to anticipate future price movements. When applied correctly, they can provide critical insights into potential support and resistance levels. Here's a step-by-step look at how you may use them effectively:
- Identifying High and Low Points: Begin by selecting a significant high and low point on the stock's chart. In an uptrend, it’s the most recent swing high to a previous swing low, and vice versa. These are the anchor points.
- Drawing the Arcs: Once the points are selected, draw the arcs at the Fibonacci retracement levels of 38.2%, 50%, and 61.8%. They radiate from the chosen low point to the high point (or vice versa), cutting across the chart.
- Interpretation: Watch how the stock interacts with these lines. When the price approaches an arc, it might encounter resistance or support, signalling a potential change in trend or continuation.
- Timing Entries and Exits: Traders can use the arcs in the stock market as a tool to time their trading decisions. For instance, a bounce could be a signal to enter a trade, whereas the price breaking through might suggest it's time to exit.
Fibonacci Arcs and Market Psychology
The effectiveness of Fibonacci arcs in trading is deeply intertwined with market psychology. They tap into the collective mindset of traders, who often react predictably to certain price levels. The Fibonacci sequence, underlying this tool, is not just a mathematical concept but also a representation of natural patterns and human behaviour.
When a stock nears a curve, traders anticipate a reaction, often leading to a self-fulfilling prophecy. If many traders make an arc stock forecast, they might sell as the price approaches a certain point, causing the anticipated resistance to materialise. Similarly, seeing support at an arc can trigger buying, reinforcing the tool’s power.
This psychological aspect makes Fibonacci arcs more than just technical tools. They are reflections of the collective expectations and actions of market participants, turning abstract mathematical concepts into practical indicators of market sentiment and potential movements.
Best Practices
Incorporating Fibonacci arcs into trading strategies involves nuanced techniques for better accuracy and efficacy. Here are some best practices typically followed:
- Complementary Tools: Traders often pair this tool with other indicators like moving averages or RSI for a more robust analysis.
- Accurate Highs and Lows: It's best to carefully select the significant high and low points, as the effectiveness of the curves largely depends on these choices.
- Context Consideration: Understanding the broader market context is crucial. Traders usually use Fibonacci arcs in conjunction with fundamental factors to validate their analysis.
- Watch for Confluence: Identifying areas where Fibonacci levels converge with other technical signals can provide stronger trade setups.
- Practice Patience: Traders typically avoid making hasty decisions based solely on Fibonacci levels. It's usually better to wait to see additional confirmation from the price action.
Advantages and Limitations of Fibonacci Arcs
Fibonacci arcs are a popular tool in technical analysis, offering distinct advantages and some limitations in analysing stock movements. Understanding these can help traders leverage the tool more effectively.
Advantages
- Intuitive Nature: The Fibonacci sequence is a natural pattern, making the tool intuitive for traders to understand and apply.
- Dynamic Support and Resistance Levels: They provide dynamic levels of support and resistance, unlike static lines, adapting to changing market conditions.
- Versatility: Effective in various market conditions, the arcs can be used in both trending and sideways markets.
Limitations
- Subjectivity in Selection: The effectiveness largely depends on correctly identifying the significant high and low points, which can be subjective.
- Potential False Signals: Like all technical tools, they can generate false signals, especially in highly volatile markets.
- Requires Complementary Analysis: To maximise effectiveness, these curves are usually used alongside other technical indicators, as they are not infallible on their own.
The Bottom Line
Fibonacci arcs are invaluable tools in stock analysis, providing insights into market trends and potential price movements.
This article represents the opinion of the Companies operating under the FXOpen brand only. It is not to be construed as an offer, solicitation, or recommendation with respect to products and services provided by the Companies operating under the FXOpen brand, nor is it to be considered financial advice.
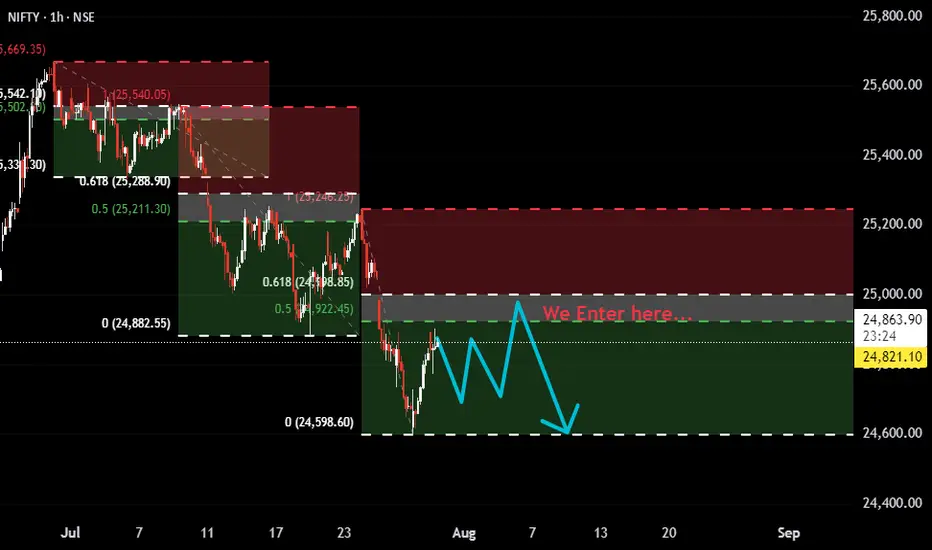
Nifty Bearish Setup: Watching 50–61.8% Fib Zone for Short EntryThis is more of an observation-based post rather than a trade setup.
It appears that Nifty, in its current bearish trend, is consistently respecting the 50–61.8% Fibonacci retracement zone before continuing downward. We’ve seen multiple pullbacks stall and reverse from this zone — making it a key area to watch.
🔸 If you're looking to short, avoid entering too early.
🔸 Let price pull back into the 50–61.8% zone, wait for structure or weakness to develop (e.g., reversal candles, BOS on lower timeframe), and then consider action.
🔸 Trying to catch tops or jumping in too soon can lead to poor entries and stop hunts.
This zone seems to be where sellers are stepping in with conviction.
Staying patient and respecting the structure can offer better entries and risk management.
⚠️ Disclaimer:
This is for educational and observational purposes only. I am not SEBI registered. Always do your own analysis before taking any trades.
AUD/USD Rejected at Resistance-Fed on TapYesterday’s Fed-induced sell-off broke through the monthly opening-range lows / 52-week moving average with the bears now poised to mark a sixth-consecutive daily decline.
It's worth noting that weekly momentum peaked at 60 on the April advance with RSI now poised to close back below 50. The observation suggests the broader downtrend remains intact and a pivot / break below slope support could mark trend resumption.
Initial weekly support is eyed with the February high at 6408 and is backed by the 38.2% retracement of the yearly range / February high-week close (HWC) at 6354/57. A break / daily close below this region would be required to suggest that a more significant high is in place, potentially signaling a larger reversal underway. In such a scenario, the next downside objectives would be the yearly low-week close and 2023 low-close at 6291/96, followed by the 61.8% retracement and 2022 low-close at 6186–6201. Both of these zones are key areas of interest for potential downside exhaustion / price inflection IF reached.
Look for initial resistance back at the 52-week moving average (currently ~6460) with key resistance now seen back at the 61.8% retracement / yearly high-close at 6550/77. Note that the upper parallel converges on this threshold over the next few weeks and further highlights the technical significance of this zone. Ultimately a breach / weekly close above the 2021 trendline (red) would be needed to validate a breakout of the multi-year downtrend in Aussie.
Bottom line: A reversal off downtrend resistance is now approaching initial support- risk for trend resumption heading into August. From a trading standpoint, the immediate focus is on the weekly close with respect to 6400- rallies should be limited to the 52-week moving average IF Aussie is heading lower on this stretch with a close below needed to keep the immediate short-bias viable heading into the monthly cross.
Keep in mind we get the release of key US employment data tomorrow with Non-Farm Payrolls on tap. Stay nimble into the release and watch the weekly close / August opening-range for guidance for guidance.
-MB

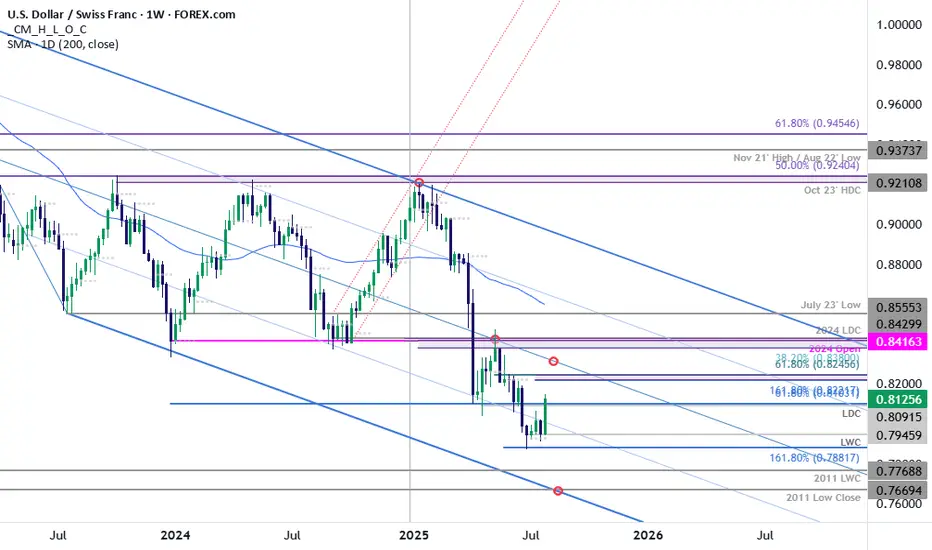
USD/CHF Rally Threatens ReversalThe July opening range broke to the topside on the heels of yesterday’s FOMC rate decision and takes USD/CHF back above the 25% parallel- a weekly close back above the April lows at 8040 tomorrow would suggest a more significant low is in place / a larger reversal is underway. Look for initial support near 8103 today for guidance.
Initial topside resistance objectives eyed at the 1.618% extension of the monthly advance and the 61.8% retracement of the May decline at 8222/46 backed by the median line, currently near the 83-handle. Key lateral resistance stands at 8380-8416- a region defined by the 38.2% retracement of the yearly range, the 2024 low-close, the 2023 low-week close (LWC) and the 2024 yearly open (an area of interest for possible topside exhaustion / price inflection IF reached).
Support rests at the yearly LWC at 7946 with a break / close below 7881 needed to mark resumption of the broader multi-year downtrend. Subsequent support objectives seen at the 2011 LWC at 7769 and the 2011 low-close at 7669.
Bottom line: USD/CHF is threatening a larger reversal within the broader downtrend. From a trading standpoint, losses would need to be limited to 8040 IF price is heading higher on this stretch with weekly close above 8103 on Friday needed to keep the immediate advance viable into the August open.
-MB
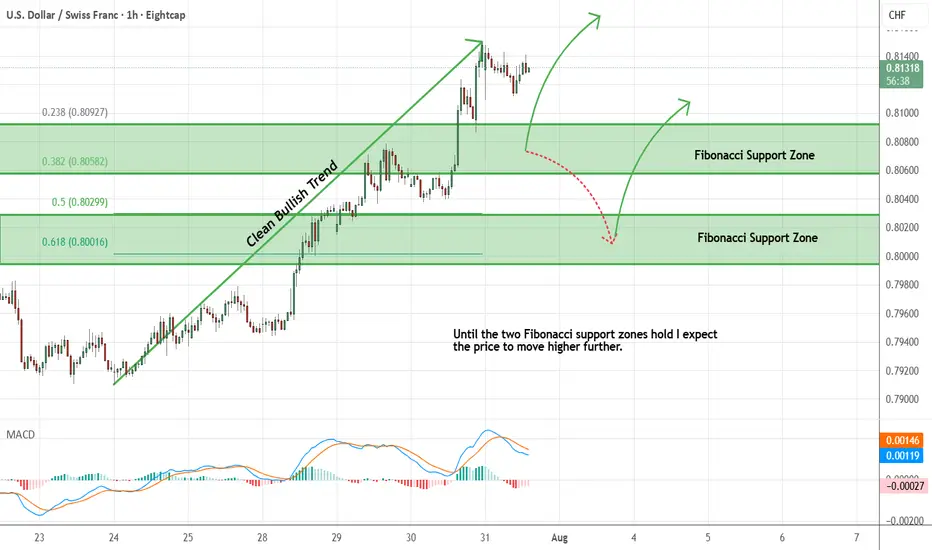
USDCHF - Looking To Buy Pullbacks In The Short TermH1 - We have a clean bullish trend with the price creating a series of higher highs, higher lows structure.
This strong bullish momentum is followed by a pullback.
No opposite signs.
Until the two Fibonacci support zones hold I expect the price to move higher further.
If you enjoy this idea, don’t forget to LIKE 👍, FOLLOW ✅, SHARE 🙌, and COMMENT ✍! Drop your thoughts and charts below to keep the discussion going. Your support helps keep this content free and reach more people! 🚀
--------------------------------------------------------------------------------------------------------------------
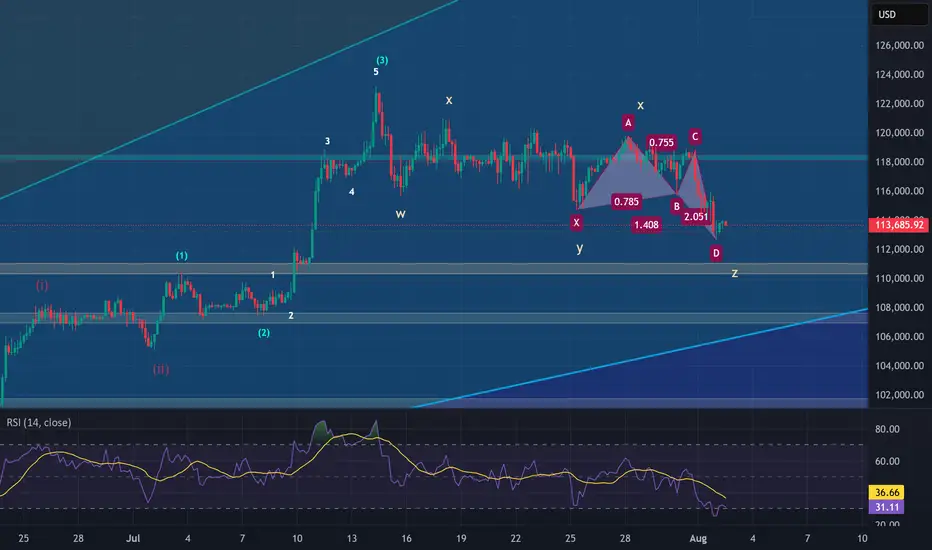
The End of BTC correction? BTC analysis 2/8/2025In my point of view, BTC has completed its correction and is now ready for a strong upward move, potentially targeting the $137,000–$139,000 range, based on the following factors:
1. Confirmation of the Butterfly Harmonic Pattern
The recent reversal occurred within the expected range of the Butterfly harmonic pattern. Typically, the XD leg in a Butterfly harmonic extends to 1.27, but in practice, this can stretch up to 1.414, which is commonly used as a flexible stop-loss zone. After testing the 1.27–1.414 range, a clear 5-wave impulse followed—testing a key trendline and making an attempt to break above the recent high. This sequence, followed by a corrective move, suggests that the broader correction may be complete.
2. Complex WXYXZ Correction Structure
In my previous analysis, I underestimated the duration and depth of the correction. The wave (4) (blue), which is part of the wave (iii), has taken considerable time—likely to allow wave (5) to extend sufficiently to break above the $130,000 level. This would support the assumption that wave (5) (purple) is the extended wave. The overall corrective structure appears highly complex, and can be counted as a W–X–Y–X–Z pattern, supported by the presence of multiple internal corrections within the wave components.
3. 0.618 Fibonacci Retracement of Wave (3)
Wave (4) has now reached the 0.618 Fibonacci retracement level of wave (3), which is significant. Historically, BTC’s corrections rarely retrace beyond the 0.87 level. This deep retracement suggests wave (4) is likely complete—unless price were to fall below that threshold, which would invalidate this assumption.
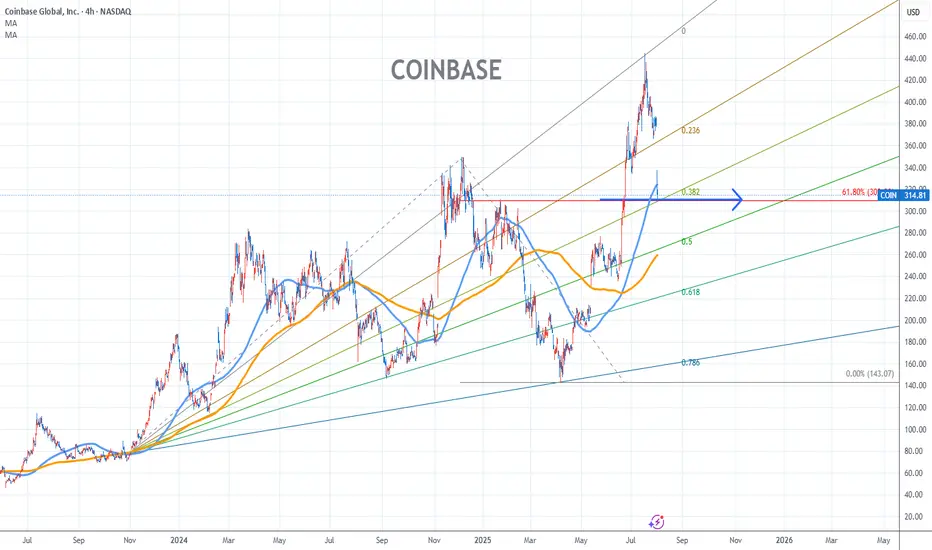
Coinbase Stock Chart Fibonacci Analysis 080125Trading Idea
1) Find a FIBO slingshot
2) Check FIBO 61.80% level
3) Entry Point > 310/61.80%
Chart time frame:C
A) 15 min(1W-3M)
B) 1 hr(3M-6M)
C) 4 hr(6M-1year)
D) 1 day(1-3years)
Stock progress:C
A) Keep rising over 61.80% resistance
B) 61.80% resistance
C) 61.80% support
D) Hit the bottom
E) Hit the top
Stocks rise as they rise from support and fall from resistance. Our goal is to find a low support point and enter. It can be referred to as buying at the pullback point. The pullback point can be found with a Fibonacci extension of 61.80%. This is a step to find entry level. 1) Find a triangle (Fibonacci Speed Fan Line) that connects the high (resistance) and low (support) points of the stock in progress, where it is continuously expressed as a Slingshot, 2) and create a Fibonacci extension level for the first rising wave from the start point of slingshot pattern.
When the current price goes over 61.80% level , that can be a good entry point, especially if the SMA 100 and 200 curves are gathered together at 61.80%, it is a very good entry point.
As a great help, tradingview provides these Fibonacci speed fan lines and extension levels with ease. So if you use the Fibonacci fan line, the extension level, and the SMA 100/200 curve well, you can find an entry point for the stock market. At least you have to enter at this low point to avoid trading failure, and if you are skilled at entering this low point, with fibonacci6180 technique, your reading skill to chart will be greatly improved.
If you want to do day trading, please set the time frame to 5 minutes or 15 minutes, and you will see many of the low point of rising stocks.
If want to prefer long term range trading, you can set the time frame to 1 hr or 1 day.
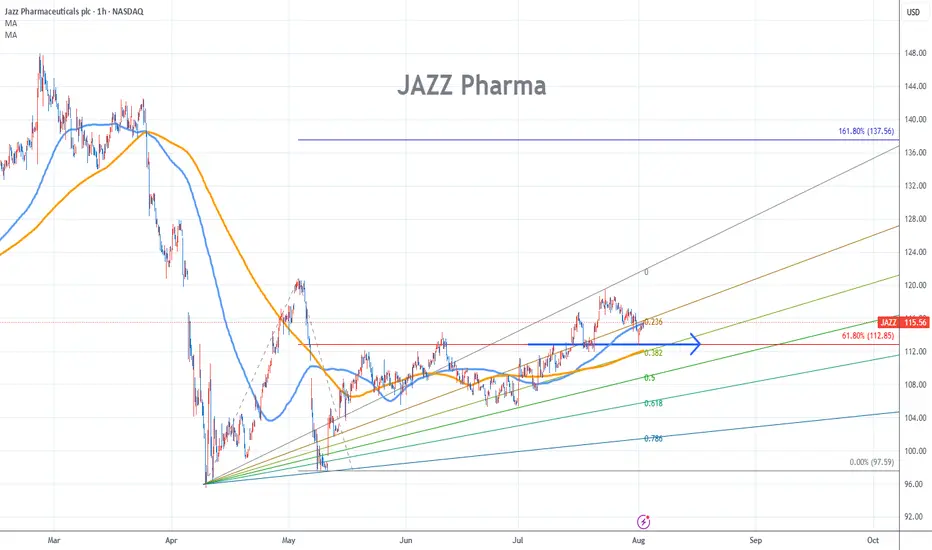
Jazz Pharma Stock Chart Fibonacci Analysis 080125Trading Idea
1) Find a FIBO slingshot
2) Check FIBO 61.80% level
3) Entry Point > 112/61.80%
Chart time frame:B
A) 15 min(1W-3M)
B) 1 hr(3M-6M)
C) 4 hr(6M-1year)
D) 1 day(1-3years)
Stock progress:C
A) Keep rising over 61.80% resistance
B) 61.80% resistance
C) 61.80% support
D) Hit the bottom
E) Hit the top
Stocks rise as they rise from support and fall from resistance. Our goal is to find a low support point and enter. It can be referred to as buying at the pullback point. The pullback point can be found with a Fibonacci extension of 61.80%. This is a step to find entry level. 1) Find a triangle (Fibonacci Speed Fan Line) that connects the high (resistance) and low (support) points of the stock in progress, where it is continuously expressed as a Slingshot, 2) and create a Fibonacci extension level for the first rising wave from the start point of slingshot pattern.
When the current price goes over 61.80% level , that can be a good entry point, especially if the SMA 100 and 200 curves are gathered together at 61.80%, it is a very good entry point.
As a great help, tradingview provides these Fibonacci speed fan lines and extension levels with ease. So if you use the Fibonacci fan line, the extension level, and the SMA 100/200 curve well, you can find an entry point for the stock market. At least you have to enter at this low point to avoid trading failure, and if you are skilled at entering this low point, with fibonacci6180 technique, your reading skill to chart will be greatly improved.
If you want to do day trading, please set the time frame to 5 minutes or 15 minutes, and you will see many of the low point of rising stocks.
If want to prefer long term range trading, you can set the time frame to 1 hr or 1 day.