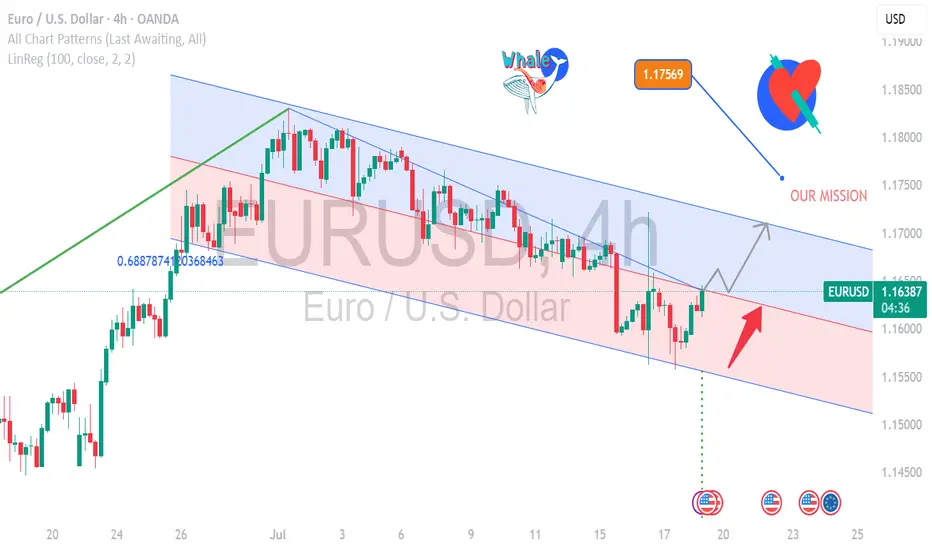
EUR/USD Flexing Strength- Is the Next Big Coming? EUR/USD Market Update – Bullish Setup at 1.16440
EUR/USD is trading around 1.16440, maintaining its bullish momentum in the current uptrend.
🔹 Current Price: 1.16440
🔹 Support Zone: 1.1600 – 1.1620
🔹 Resistance Zone: 1.1680 – 1.1700
🔹 Trend: Strong bullish structure with clear upward momentum
The pair is holding above key support and aiming for the next resistance at 1.1700. A breakout above this level could open the door to further upside. Traders watching for a retest near support or breakout entry above resistance.
🎯 Trading Plan:
Buy on dips above 1.1620 or wait for a confirmed breakout above 1.1680 with volume.
#EURUSD #ForexAnalysis #BullishSetup #ResistanceSupport #TechnicalAnalysis #PriceAction #TrendTrading #SmartTrader #FXSignals
Fibonacci
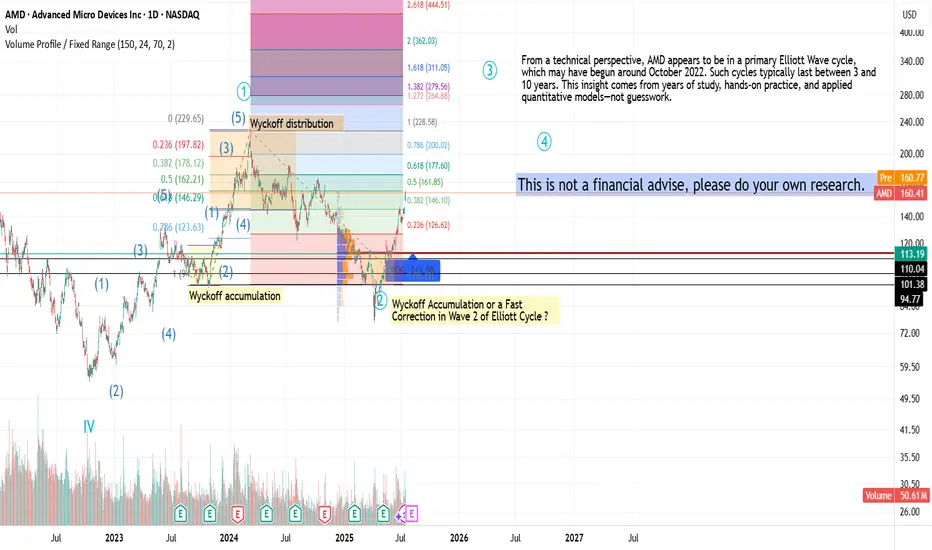
AMD Overview & Elliott Wave CycleAMD recently reported strong Q2 2025 results, with growth driven by Data Center and AI segments, notably thanks to the Instinct MI300 chip family. Revenue rose +15% YoY, with a significant boost from AI-related demand. Future projects include next-gen GPUs, AI platforms, deeper cloud integration, and investments in 3nm architectures.
From a technical perspective, AMD appears to be in a primary Elliott Wave cycle, which may have begun around October 2022. Such cycles typically last between 3 and 10 years. This insight comes from years of study, hands-on practice, and applied quantitative models,not guesswork.
If you found this interesting, share it with others: spreading thoughtful analysis matters.
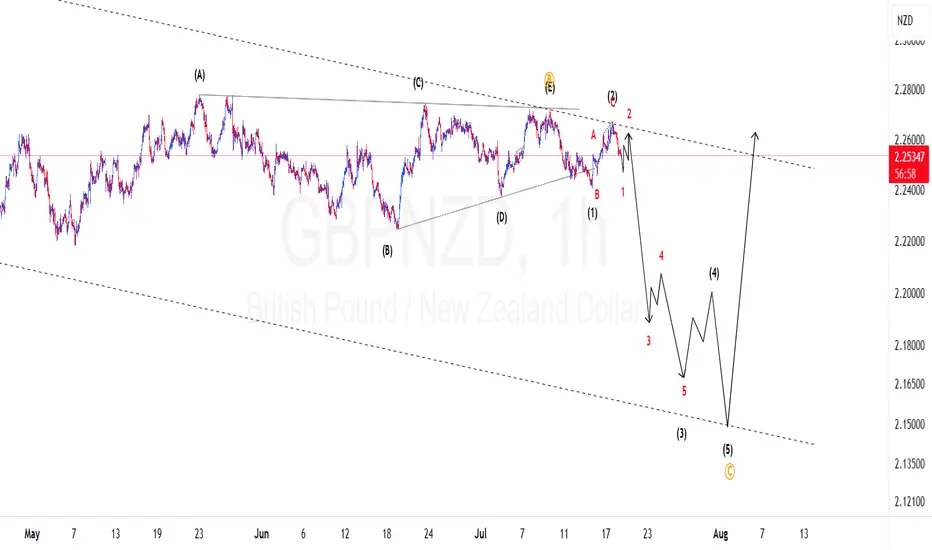
GBPNZD Elliotwaves update: Are Bears still on control?We have been on this in the past two weeks and now we can see clear signs of bears controlling the price. We had a triangle correction completed and made an impulsive wave to the downside which confirmed our bias. Now are are on the first wave of wave 3 and we should anticipate momentum to the downside to increase. To take advantage of the drop one should find areas where price might find resistance and other confluences like Fibonacci to take a trade.
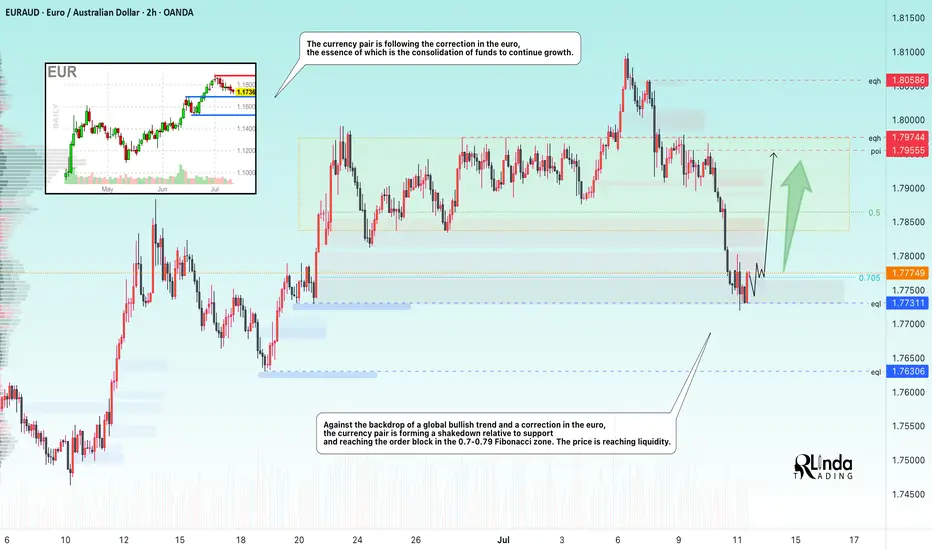
EURAUD → Correction for accumulation before growthFX:EURAUD reaches the zone of interest during a correction and forms a false breakdown of local support. Traders can switch to the buy side to support the trend.
Against the backdrop of a global bullish trend and a correction in the euro, the currency pair is following this movement, the essence of which is to consolidate funds for further growth. Liquidation is forming in relation to the liquidity zones of 1.785, 1.78, and 1.773, and the market imbalance is changing. The current movement is bringing the price to the zone of interest: the liquidity area of 1.773 and the order block. The capture of liquidity relative to 1.773 leads to the formation of a false breakdown and a pullback to the area of interest for buyers. Accordingly, price consolidation above 1.776 and 0.7 Fibonacci could support the main trend and allow the price to strengthen.
Support levels: 1.776, 1.773, 1.763
Resistance levels: 1.786, 1.795
The euro clearly demonstrates an upward trend, the structure of which has not been broken during the correction. Correction is a perfectly healthy movement within a trend, allowing positions to be opened at more favorable prices. If the bulls hold their defense above 1.776, momentum towards the specified targets may form.
Best regards, R. Linda!
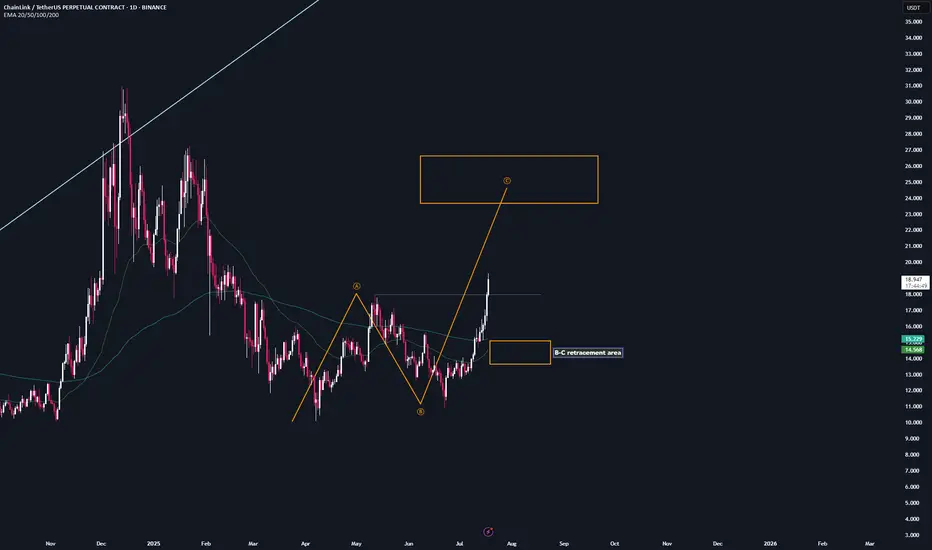
CHainLink | Trade-Setup📌 After the breakout from the last high at $18, a bullish sequence (orange) has now been activated.
📊 These setups typically occur no more than twice per year on any given altcoin, so I’ll be aggressively buying each level at the B-C retracement area.
Trademanagement:
- I'm placing long orders at each level. ((If the price continues climbing, I’ll adjust the trend reversal level (green) accordingly and update my limit orders.)
- Once the trade reaches a 2 R/R, I’ll move the stop-loss to break-even.
- From a 3 R/R onward, I’ll start locking in profits.
✅ I welcome every correction from here on —
but I won’t enter any new positions at these top levels.
Stay safe & lets make money
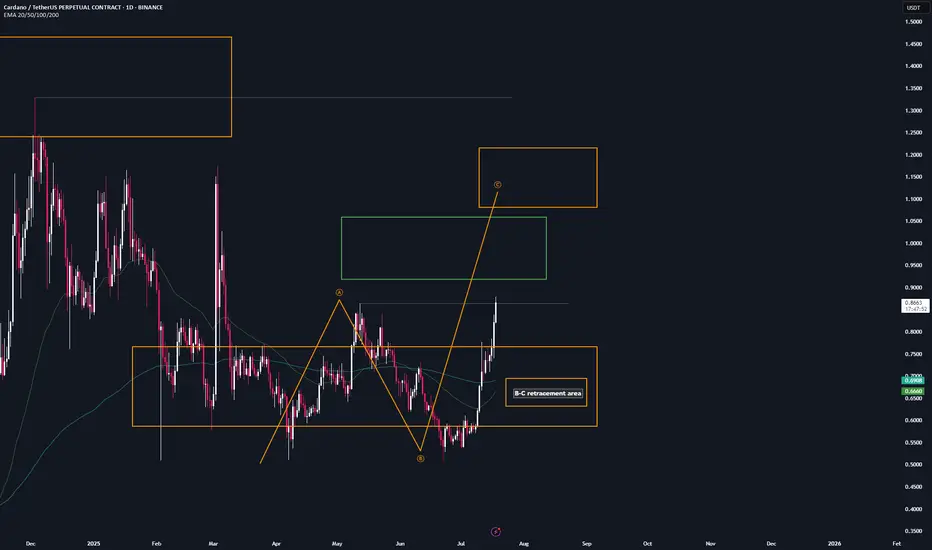
ADA | Trade setup📌 After the breakout from the last high at $0.86, a bullish sequence (orange) has now been activated.
📊 These setups typically occur no more than twice per year on any given altcoin, so I’ll be aggressively buying each level at the B-C retracement area.
Trademanagement:
- I'm placing long orders at each level. ((If the price continues climbing, I’ll adjust the trend reversal level (green) accordingly and update my limit orders.)
- Once the trade reaches a 2 R/R, I’ll move the stop-loss to break-even.
- From a 3 R/R onward, I’ll start locking in profits.
✅ I welcome every correction from here on —
but I won’t enter any new positions at these top levels.
Stay safe & lets make money
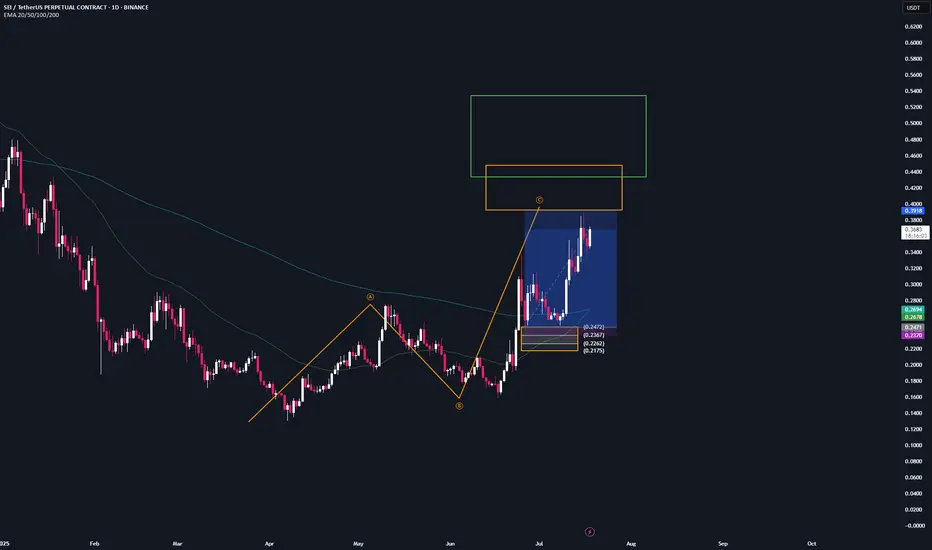
SEI | Trade-updateWe’ve almost reached our final profit target (orange). Once we get there, I’ll take out most of my margin position and let only a small portion run.
Same situation as with $ADA...
13 R/R since my call — you don’t need a strategy with an 80% win rate. A 30–50% win rate is more than enough if your risk-to-reward ratio is solid.
I don’t think any of you have taken trades based on my calls yet, but maybe in the future idk.
I’ll keep posting from time to time. Maybe I’ll get more motivated and post more often. We’ll see.
As always: don’t get FOMO now when prices are green. The time to go long was a month ago — now it’s time to hit the red button.
And thanks to @cemainickam i see that atleast one person is reading my posts. Thank you bro!
cheers, stay safe❤️
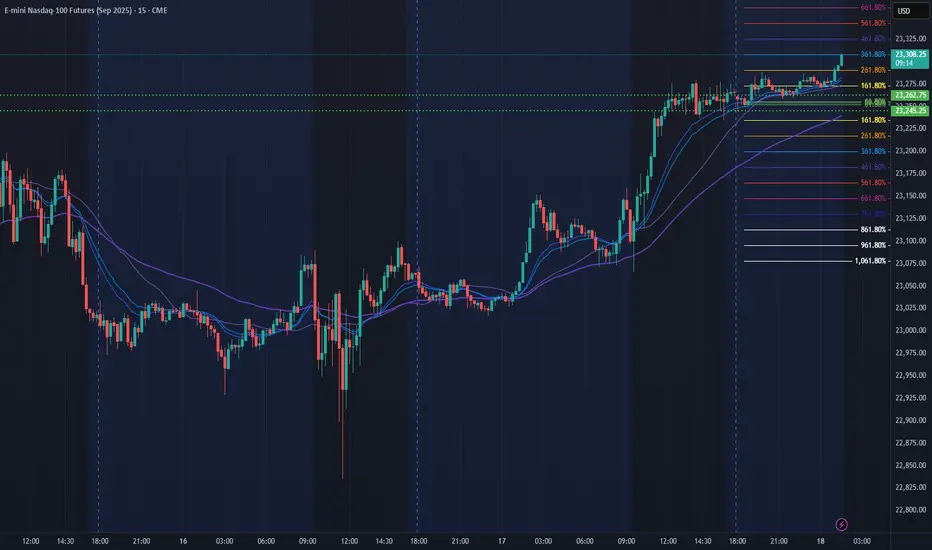
NQ Power Range Report with FIB Ext - 7/18/2025 SessionCME_MINI:NQU2025
- PR High: 23262.75
- PR Low: 23245.25
- NZ Spread: 39.0
No key scheduled economic events
Pushing ATH through overnight hours
Session Open Stats (As of 1:15 AM 7/18)
- Session Open ATR: 272.56
- Volume: 18K
- Open Int: 286K
- Trend Grade: Neutral
- From BA ATH: -0.0% (Rounded)
Key Levels (Rounded - Think of these as ranges)
- Long: 23811
- Mid: 22096
- Short: 20383
Keep in mind this is not speculation or a prediction. Only a report of the Power Range with Fib extensions for target hunting. Do your DD! You determine your risk tolerance. You are fully capable of making your own decisions.
BA: Back Adjusted
BuZ/BeZ: Bull Zone / Bear Zone
NZ: Neutral Zone
GBPUSD ANALYSIS From the previous trading day we can see that the pair has been making random up and down movements without a clear direction and even though we rejected a key support area the higher timeframes like daily and weekly still show bearish sentiment right now the best move is to wait

Sterling Rebounds But Faces Heavy Resistance Ahead GBP/USD Outlook – Sterling Rebounds But Faces Heavy Resistance Ahead
🌐 Macro Insight – UK Labour Data Mixed, Trump Headlines Stir Market
The British Pound (GBP) regained some lost ground against the U.S. Dollar after the UK labour market data revealed mixed signals:
Wage growth cooled as expected, suggesting a potential easing in inflationary pressures.
UK ILO Unemployment ticked up to 4.7%, raising concerns about labour market fragility.
Meanwhile, in the U.S., President Trump denied reports about firing Fed Chair Powell, briefly easing tensions and stabilizing USD demand.
With both currencies facing mixed narratives, GBP/USD is set for a pivotal move, and traders should stay alert to key liquidity zones and order blocks.
🔍 Technical Setup – MMF + Smart Money Framework
On the H2 chart, GBP/USD has reacted from the OBS BUY ZONE at 1.3376, bouncing with a bullish structure and forming a potential continuation pattern. Price is now expected to target key zones above, where significant order blocks and Fibonacci confluence reside.
⚙️ Key Resistance Zones:
1.3578 – 0.5 Fibonacci Retracement + OBS
1.3627 – 0.618 Fibonacci + Supply Zone
1.3697 – CP Continuation Pattern + H2 Order Block
These areas represent institutional interest for potential sell setups.
✅ Trade Plan for GBP/USD
🟢 BUY ZONE: 1.3376 – 1.3398
SL: 1.3360
TP: 1.3450 → 1.3485 → 1.3530 → 1.3578 → 1.3627
Look for bullish structure confirmation before entering. Target the next liquidity highs and imbalance zones.
🔴 SELL ZONE: 1.3627 – 1.3697
SL: 1.3735
TP: 1.3580 → 1.3530 → 1.3480
Watch for rejection and bearish divergence at supply areas to time potential swing shorts.
🧠 Strategy Notes
This setup combines MMF zones with institutional volume and price action concepts. The pair is currently reacting to a deep discount zone and may climb toward premium levels where selling pressure awaits. Be cautious during New York session volatility, especially with potential U.S. policy headlines and upcoming global inflation data.
🗨 What’s Next?
Are bulls ready to reclaim control or will resistance zones cap this recovery? Drop your ideas below and don’t forget to follow for more institutional-grade insights powered by MMF methodology.

Fibonacci Retracement: The Hidden Key to Better EntriesIf you’ve ever wondered how professional traders predict where price might pull back before continuing... the secret lies in Fibonacci Retracement.
In this post, you’ll learn:
What Fibonacci retracement is
Why it works
How to use it on your charts (step-by-step)
Pro tips to increase accuracy in the market
🧠 What Is Fibonacci Retracement?:
Fibonacci Retracement is a technical analysis tool that helps traders identify potential support or resistance zones where price is likely to pause or reverse during a pullback.
It’s based on a mathematical sequence called the Fibonacci Sequence, found everywhere in nature — from galaxies to sunflowers — and yes, even in the markets.
The Fibonacci sequence is a series of numbers where each number is the sum of the two preceding ones, starting with 0 and 1. The sequence typically begins with 0, 1, 1, 2, 3, 5, 8, 13, and so on. This pattern can be expressed as a formula: F(n) = F(n-1) + F(n-2), where F(n) is the nth Fibonacci number.
The key Fibonacci levels traders use are:
23.6%
38.2%
50%
61.8%
78.6%
These levels represent percentages of a previous price move, and they give us reference points for where price might pull back before resuming its trend and where we can anticipate price to move before showing support or resistance to the trend you are following.
💡Breakdown of Each Fib Level:
💎 0.236 (23.6%) – Shallow Pullback
What it indicates:
Weak retracement, often signals strong trend momentum.
Buyers/sellers are aggressively holding the trend.
Best action:
Aggressive entry zone for continuation traders.
Look for momentum signals (break of minor structure, bullish/bearish candles). Stay out of the market until you see more confirmation.
💎 0.382 (38.2%) – First Strong Area of Interest
What it indicates:
Healthy pullback in a trending market.
Seen as a key area for trend followers to step in.
Best action:
Look for entry confirmation: bullish/bearish engulfing, pin bars, Elliott Waves, or break/retest setups.
Ideal for setting up trend continuation trades.
Stop Loss 0.618 Level
💎 0.500 (50.0%) – Neutral Ground
What it indicates:
Often marks the midpoint of a significant price move.
Market is undecided, can go either way.
Best action:
Wait for additional confirmation before entering.
Combine with support/resistance or a confluence zone.
Useful for re-entry on strong trends with good risk/reward.
Stop Loss 1.1 Fib Levels
💎 0.618 (61.8%) – The “Golden Ratio”
What it indicates:
Deep pullback, often seen as the last line of defense before trend reversal.
High-probability area for big players to enter or add to positions.
Best action:
Look for strong reversal patterns (double bottoms/tops, engulfing candles).
Excellent area for entering swing trades with tight risk and high reward.
Use confluence (structure zones, moving averages, psychological levels, Elliott Waves).
Wait for close above or below depending on the momentum of the market.
Stop Loss 1.1 Fib Level
💎 0.786 (78.6%) – Deep Correction Zone
What it indicates:
Very deep retracement. Often a final “trap” zone before price reverses.
Risk of trend failure is higher.
Best action:
Only trade if there's strong reversal evidence.
Use smaller position size or avoid unless other confluences are aligned.
Can act as an entry for counter-trend trades in weaker markets.
Stop Loss around 1.1 and 1.2 Fib Levels
⏱️Best Timeframe to Use Fibs for Day Traders and Swing Traders:
Day trading:
Day traders, focused on capturing short-term price movements and making quick decisions within a single day, typically utilize shorter timeframes for Fibonacci retracement analysis, such as 15-minute through hourly charts.
They may also use tighter Fibonacci levels (like 23.6%, 38.2%, and 50%) to identify more frequent signals and exploit short-term fluctuations.
Combining Fibonacci levels with other indicators such as moving averages, RSI, or MACD, and focusing on shorter timeframes (e.g., 5-minute or 15-minute charts) can enhance signal confirmation for day traders.
However, relying on very short timeframes for Fibonacci can lead to less reliable retracement levels due to increased volatility and potential for false signals.
Swing trading:
Swing traders aim to capture intermediate trends, which necessitates giving trades more room to fluctuate over several days or weeks.
They typically prefer utilizing broader Fibonacci levels (like 38.2%, 50%, and 61.8%) to identify significant retracement points for entering and exiting trades.
Swing traders often focus on 4-hour and daily charts for their analysis, and may even consult weekly charts for a broader market perspective.
🎯 Why Does Fibonacci Work?:
Fibonacci levels work because of:
Mass psychology – many traders use them
Natural rhythm – markets move in waves, not straight lines
Institutional footprint – smart money often scales in around key retracement zones
It's not magic — it's structure, and it's surprisingly reliable when used correctly.
🛠 How to Draw Fibonacci Retracement (Step-by-Step):
Let’s say you want to trade XAU/USD (Gold), and price just had a strong bullish run.
✏️ Follow These Steps:
Identify the swing low (start of move)
Identify the swing high (end of move)
Use your Fibonacci tool to draw from low to high (for a bullish move)
The tool will automatically mark levels like 38.2%, 50%, 61.8%, etc.
These levels act as pullback zones, and your job is to look for entry confirmation around them.
🔁 For bearish moves, draw from high to low. (I will show a bearish example later)
Now let’s throw some examples and pictures into play to get a better understanding.
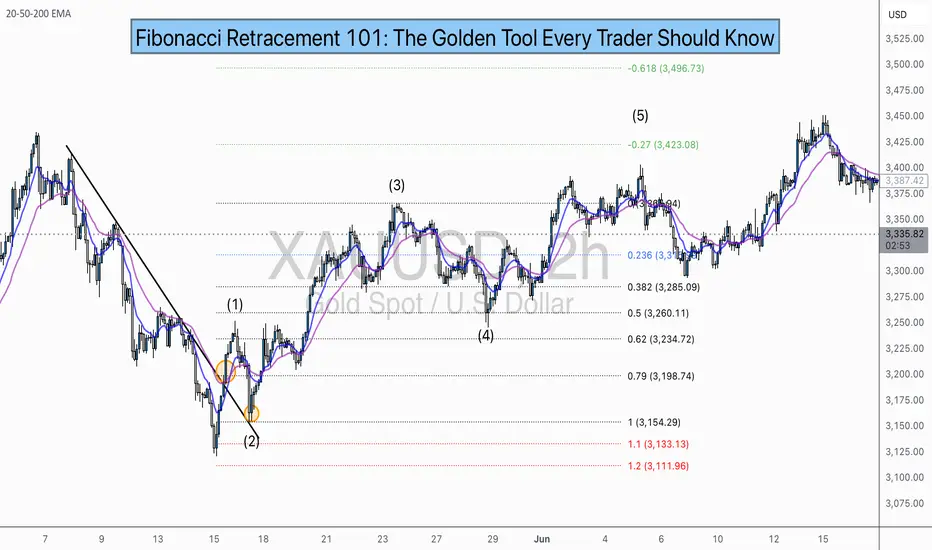
📈 XAU/USD BULLISH Example:
1.First we Identify the direction of the market:
2.Now we set our fibs by looking for confirmations to get possible entry point:
Lets zoom in a bit:
Now that we have a break of the trendline we wait for confirmation and look for confluence:
Now we set our fibs from the last low to the last high:
This will act as our entry point for the trade.
3. Now we can look for our stop loss and take profit levels:
Stop Loss:
For the stop loss I like to use the fib levels 1.1 and 1.2 when I make an entry based upon the 0.618 level. These levels to me typically indicate that the trade idea is invalid once crossed because it will usually violate the prior confirmations
Take Profit:
For the take profit I like to use the Fib levels 0.236, 0, -0.27, and -0.618. This is based upon your personal risk tolerance and overall analysis. You can use 0.236 and 0 level as areas to take partial profits.
Re-Entry Point Using Elliott Waves as Confluence Example:
This is an example of how I used Elliott Waves to enter the trade again from the prior entry point. If you don’t know what Elliott Waves are I will link my other educational post so you can read up on it and have a better understanding my explanation to follow.
After seeing all of our prior confirmations I am now confident that our trend is still strongly bullish so I will mark my Waves and look for an entry point.
As we can see price dipped into the 0.38-0.5 Fib level and rejected it nicely which is also in confluence with the Elliott Wave Theory for the creation of wave 5 which is the last impulse leg before correction.
🔻 In a downtrend:
Same steps, but reverse the direction — draw from high to low and look to short the pullback.
XAU/USD Example:
As you can see the same basic principles applied for bearish movement as well.
⚠️ Pro Tips for Accuracy:
✅ Always use Fib in confluence with:
Market structure (higher highs/lows or lower highs/lows)
Key support/resistance zones
Volume or momentum indicators
Candle Patterns
Elliott Waves, etc.
❌ Don’t trade Fib levels blindly — they are zones, not guarantees.
📊 Use higher timeframes for cleaner levels (4H, Daily)
💡 Final Thought
Fibonacci retracement doesn’t predict the future — it reveals probability zones where price is likely to react.
When combined with structure and confirmation, it becomes one of the most reliable tools for new and experienced traders alike.
🔥 Drop a comment if this helped — or if you want a Part 2 where I break down Fibonacci Extensions and how to use them for take-profit targets.
💬 Tag or share with a beginner who needs to see this!
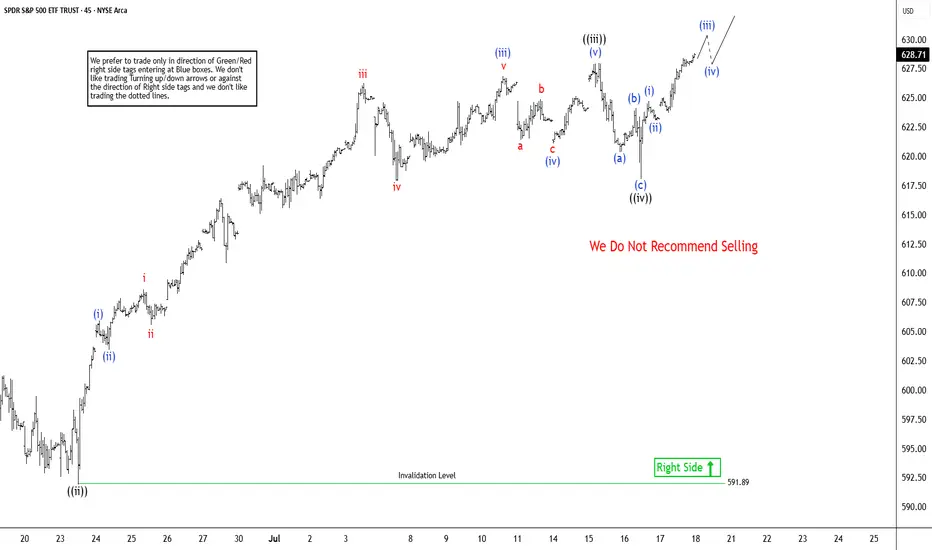
Elliott Wave Analysis: SPY Poised To Extend Higher In Bullish SeElliott Wave sequence in SPY (S&P 500 ETF) suggest bullish sequence in progress started from 4.07.2025 low. It expects two or few more highs to extend the impulse sequence from April-2025, while dips remain above 6.23.2025 low. SPY ended the daily corrective pullback in 3 swings at 480 low on 4.07.2025 low from February-2025 peak. Above there, it favors upside in bullish impulse sequence as broke above February-2025 high. Currently, it favors wave 3 of (1) & expect one more push higher from 7.16.2025 low in to 630.31 – 651.1 area before correcting in wave 4. In 4-hour, it placed 1 at 596.05 high, 2 at 573.26 low as shallow connector & extend higher in 3. Within 3, it placed ((i)) at 606.40 high, ((ii)) at 591.89 low, ((iii)) at 627.97 high & ((iv)) at 618.05 low.
In 1-hour above ((ii)) low of 591.89 low, it ended (i) at 605.96 high, (ii) at 603.17 low, (iii) at 626.87 high as extended move, (iv) at 620 low & (v) as ((iii)) at 627.97 high. Wave ((iv)) ended in 3 swing pullback as shallow connector slightly below 0.236 Fibonacci retracement of ((iii)). Within ((iii)), it ended (a) at 619.8 low, (b) at 624.12 high & (c) at 618.05 low on 7.16.2025 low (this week). Above there, it favors rally in ((v)) of 3 targeting in to 630.31 – 651.1 area before correcting in 4. Within ((v)), it placed (i) at 624.73 high, (ii) at 623.08 low & favors upside in (iii) of ((v)). We like to buy the pullback in clear 3, 7 or 11 swings correction at extreme area in 4 and later in (2) pullback, once finished (1) in 5 swings.
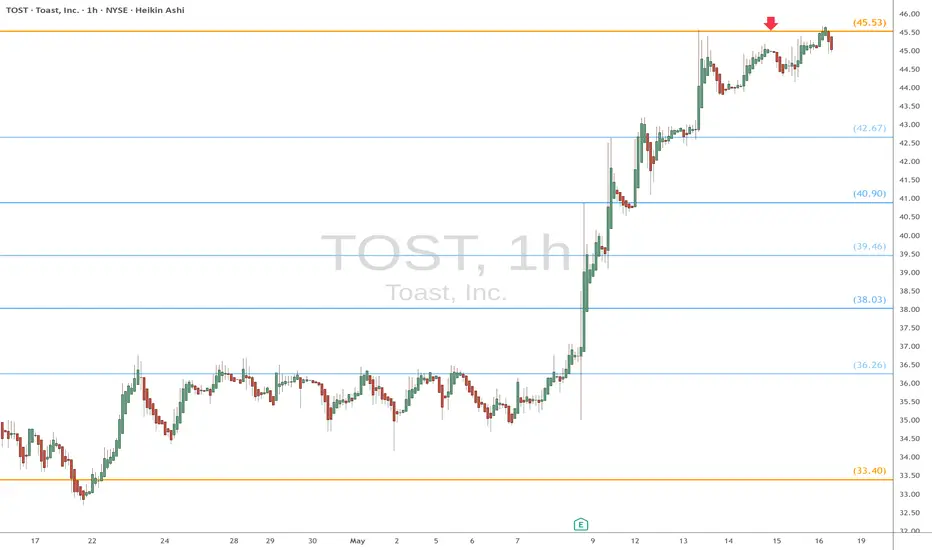
TOST eyes on $45.53: Golden Genesis fib already proven strongTOST has been on a ferocious rip upwards.
Now struggling against a Golden Genesis fib.
Look for a Break-n-Retest or Dip-to-Fib buy.
.
Last plot that caught the HUGE breakout gains:
==========================================
.
URI eyes on $671: proven Double Fib zone holding up new Highs URI should actually BENEFIT from Tariffs.
Currently testing a double fib at $671.16/30
Look for a Dip to a Break-n-Retest for entry.

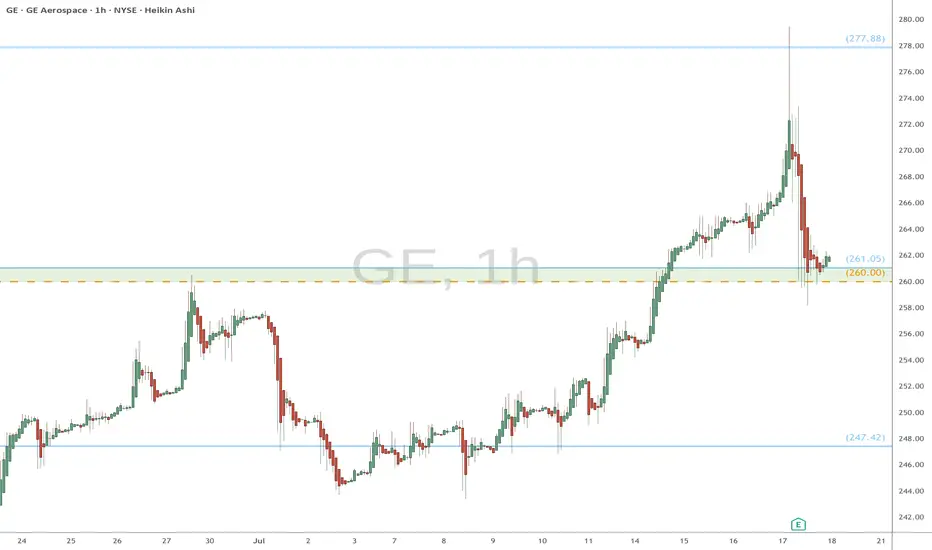
GE watch $260-261: Key support to maintain strong UptrendGE has been in a strong uptrend for a couple of years now.
Earnings report dropped it to support zone at $260.00-261.05
This zone is now clearly visible to everyon, so Do-or-Die here.
Long entry here with tight stop loss just below zone.
======================================================
.
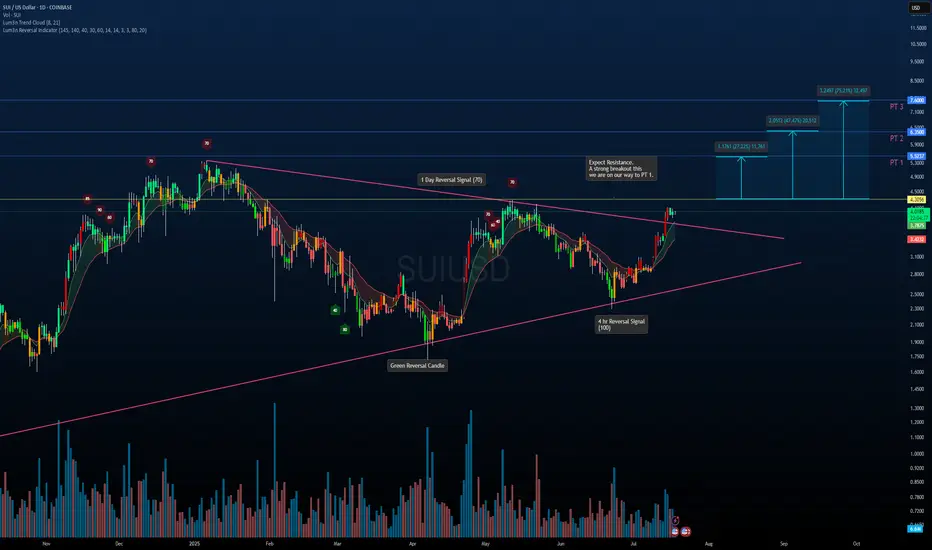
SUI/USDT – Symmetrical Triangle Breakout in PlaySUI has officially broken out of a multi-month symmetrical triangle on strong momentum. This structure has been building since early 2024 and now looks ready for continuation.
Key Notes:
Breakout confirmed above trendline resistance with strong volume.
Reversal signals on the 1D and 4H timeframes aligned before the move.
Pullback toward the breakout zone is possible before continuation.
Upside Fibonacci-Based Targets:
PT1: $5.32 (+27%)
PT2: $6.53 (+47%)
PT3: $7.60 (+75%)
If the breakout holds and momentum continues, these levels offer a solid roadmap for potential long-term gains. Watching how price reacts around the $4.30 resistance will be key.
Not Financial Advice – For educational purposes only.
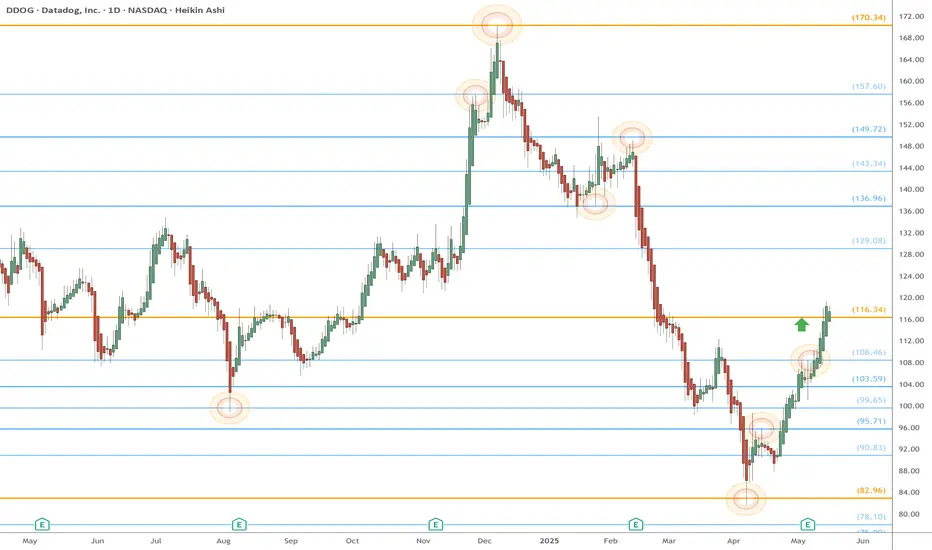
DDOG eyes on $116.34: Golden Genesis fib to determine the TrendDDOG bounce just hit a Golden Genesis at $116.34
The sister Goldens above and below marked extremes.
This one could mark the orbital center for some time.
It is PROBABLE that we orbit this fib a few times.
It is POSSIBLE that we see a pullback from here.
It is PLAUSIBLE but unlikely to continue non-stop.
===============================================
.
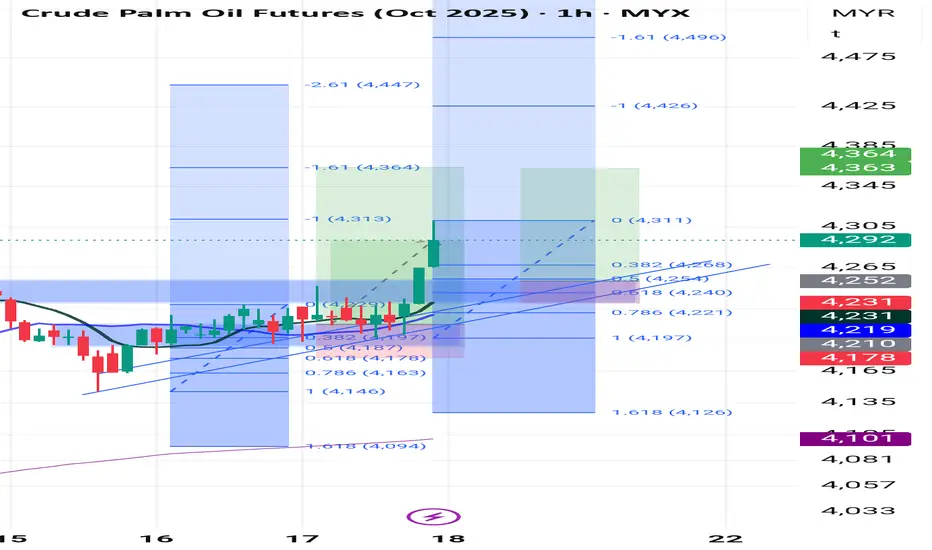
continuation bullish modeBased on the chart tf 1h, looks still strong to bullish mode. retracement area maybe between 4254 to 4230 which is area hh before (major market structure and Fibonacci retracement 0.5 to 0.618. and theres also strong support trendline in that area. however, will see how much the gap this morning .18 July. #testingpublish
SPX LONG📘 Daily Trade Journal – Thursday, July 17
1. Trade Overview
- Asset:-SPX - Direction:** Long
- Entry Time:** After 10:00 p.m. (Vietnam Time)
- Timeframes Used:** 1H, 30m
- Bias Origin:** Bullish market structure continuation with recent change of character
---
2. Trade Idea (Before Entry)
I came to the charts shortly after 10:00 p.m. PopCat had just wicked into the 0.618 Fibonacci level. I considered it a chase, so I passed on it—didn’t get the retracement I wanted.
ETH and Solana were not retracing into the OTE zones either.
Pengu appeared more bearish—potentially forming a daily lower high, indicating slowing upside momentum. I ruled that one out too.
I ended up selecting **SPX**, trading it for the first time. Despite that, I stayed focused on structure and levels:
1H timeframe had a bullish **external break of structure.
30m timeframe showed a temporary bearish retracement, but then a bullish change of character followed.
This change of character swept the previous day’s high, which was a concern since that level was also my target, and it had already been touched—possibly by London.
Despite this, I decided to take the trade based on:
* Anchored Fibonacci from today's early session low to the current high
* Overall structure still being bullish
* Expecting a possible sweep of today’s **intraday high** and maybe even another test above **yesterday’s high**
---
### 3. **Entry Details**
* **Entry Price:** \
* **Risk Taken:** \
* **Stop Loss Placement:** Below the retracement swing low / point of invalidation
* **Confluences Used:**
* ✅ Fibonacci retracement
* ✅ Change of Character
* ❌ No AVWAP, trendlines, or order blocks used
---
### 4. **Exit Details**
*(To be completed when the trade closes)*
* **Exit Time:** \
* **Exit Price:** \
* **Reason for Exit:** \
---
### 5. **Outcome**
*(To be completed when the trade closes)*
* **P\&L:** \
* **Partial or Full Exit:** \
* **Session of Exit:** \
---
### 6. **Self-Assessment**
* ✅ **What went right?**
* Didn’t force a trade on assets that didn’t return to key levels.
* Stayed open to switching assets when familiar names didn’t provide ideal setups.
* Executed a setup based on structure, not emotional attachment.
* ❌ **What could be improved?**
* SPX target had already been swept—may need to reevaluate entering **after** key liquidity has already been taken.
* More clarity needed when trading unfamiliar assets for the first time (like SPX).
* 📋 **Did I follow my trading plan?**
* Yes. I stayed within my timeframe, followed structure, used Fibonacci, respected the process.
* 📈 **Would I take this trade again, exactly the same way?**
* Yes, with caution. Would want stronger confirmation if the target liquidity has already been touched. Otherwise, setup fits criteria.
* 🔎 **How would I rate this trade out of 10?**
* \
---
🧠 Notes for Improvement
Today, I didn’t fixate on one asset, which may be a strength.
Need to define a clearer protocol for **target levels that have already been swept**—whether to stand aside or expect continuation.
Emotionally balanced today. No FOMO trades. If this one plays out, great. If not, it’s still within plan.
---
💤 Closing Note
This is Day 3 of live journaling and publishing. One clean setup executed. No overtrading. I’ll let the market decide the outcome and stick to my commitment: one session, one plan, one trade idea. Back tomorrow—same window.
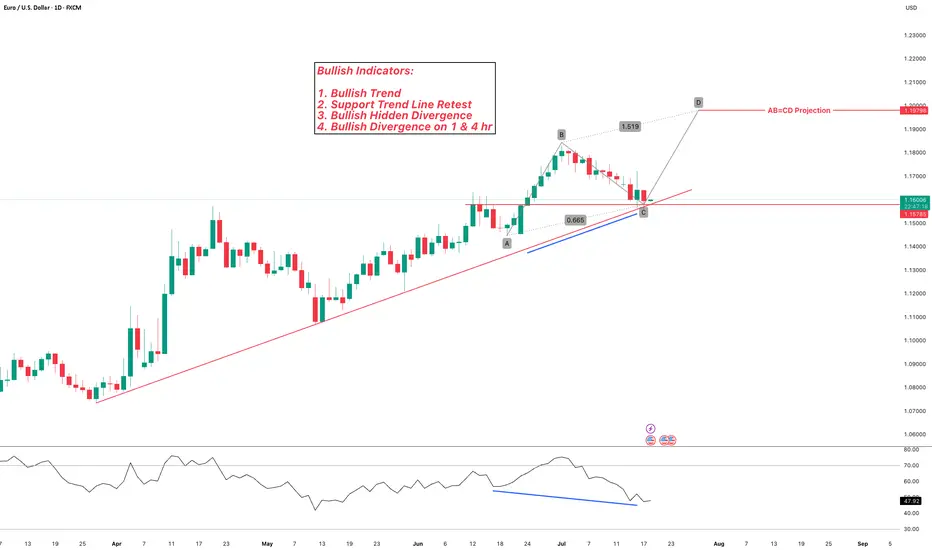
EURUSD Bullish Continuation OutlookFX:EURUSD has been trading in a bullish trend. Currently price is retesting the previous resistance level, as well as 0.618 fib. Hidden bullish divergence can be observed on the chart, in addition to regular bullish divergence on lower timeframes (1 & 4 hour).
I am expecting bullish continuation from here to complete the price projections!
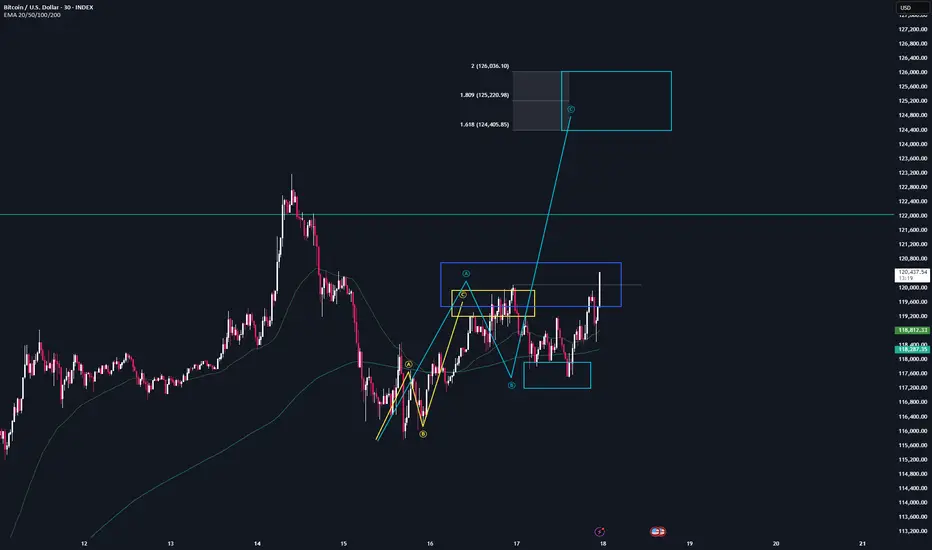
BTC updateWe just activated a new bullish structure on the lower timeframes for CRYPTOCAP:BTC , which will take us to 124K.
There’s a high probability that this setup will play out, so keep an eye on it.
However, once we reach all-time high (ATH) regions make sure you dont get fomo. Position yourself when others are in fear — or regret it later. There’s no point in gambling on long positions when Bitcoin is at an ATH.
cheers, Stay safe
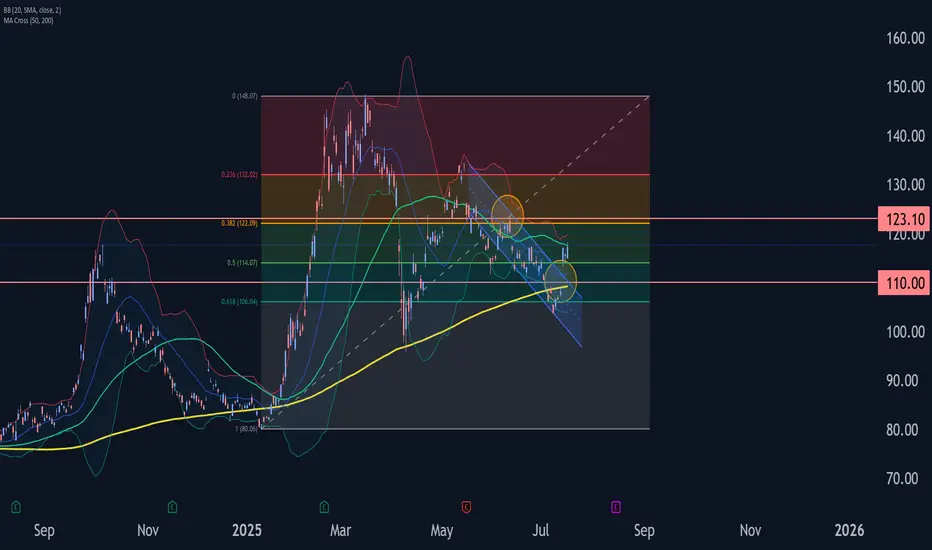
Alibaba Group Wave Analysis – 17 July 2025
- Alibaba Group rising inside impulse wave (3)
- Likely to reach resistance level 123.10
Alibaba Group recently rose with a sharp upward gap, breaking the resistance level 110.00 and the resistance trendline of the daily down channel from May.
The breakout of these resistance levels accelerated the active intermediate impulse wave (3).
Alibaba Group can be expected to rise to the next resistance level 123.10 (the former monthly high and top of wave B from June).
Coca-Cola Wave Analysis – 17 July 2025- Coca-Cola reversed from the support area
- Likely to rise to resistance level 72.00
Coca-Cola recently reversed from the support area between the key support level 68.55 (which has been reversing the price from May), lower daily Bollinger Band and the 38.2% Fibonacci correction of the upward impulse (1) from January.
The upward reversal from this support area stopped the previous minor ABC correction (ii).
Coca-Cola can be expected to rise to the next resistance level 72.00 (which stopped the earlier waves B, 1 and i).
