Coca-Cola Wave Analysis – 17 July 2025- Coca-Cola reversed from the support area
- Likely to rise to resistance level 72.00
Coca-Cola recently reversed from the support area between the key support level 68.55 (which has been reversing the price from May), lower daily Bollinger Band and the 38.2% Fibonacci correction of the upward impulse (1) from January.
The upward reversal from this support area stopped the previous minor ABC correction (ii).
Coca-Cola can be expected to rise to the next resistance level 72.00 (which stopped the earlier waves B, 1 and i).
Fibonacci

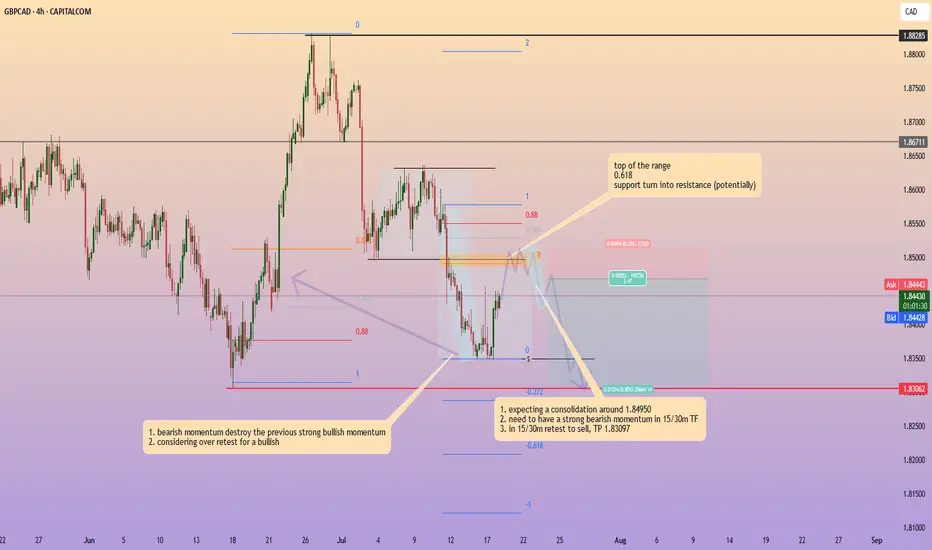
GBPCAD bearish take in place, prepare for sell CAPITALCOM:GBPCAD
4hr mind map
1. bearish momentum destroy the previous strong bullish momentum
2. considering over retest for a bullish
next action:
1. expecting a consolidation around 1.84950
2. need to have a strong bearish momentum in 15/30m TF
3. in 15/30m retest to sell, TP 1.83097
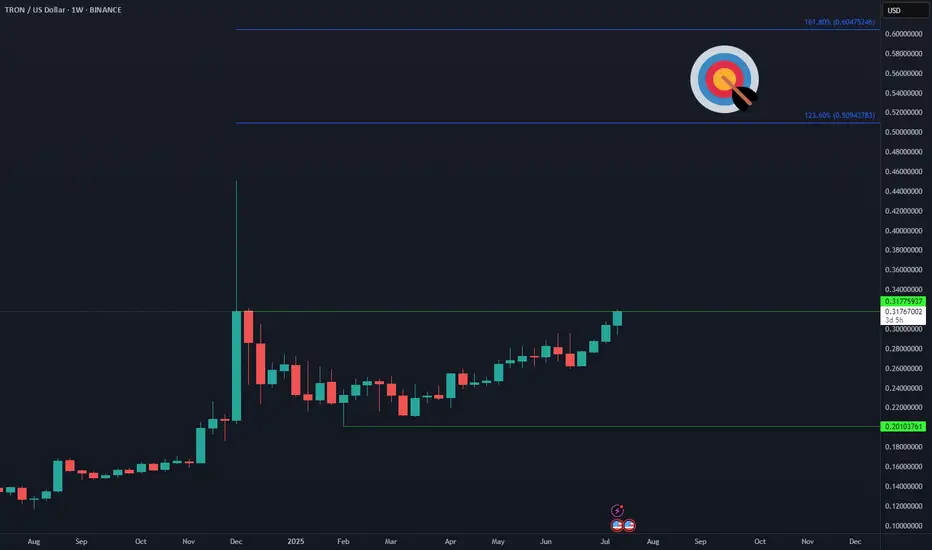
TRON TRX Eying New ATH📈 After 6 months of sideways accumulation, CRYPTOCAP:TRX is finally picking up momentum. A weekly close above $0.317 could trigger acceleration toward the next targets at $0.50–$0.60 🚀
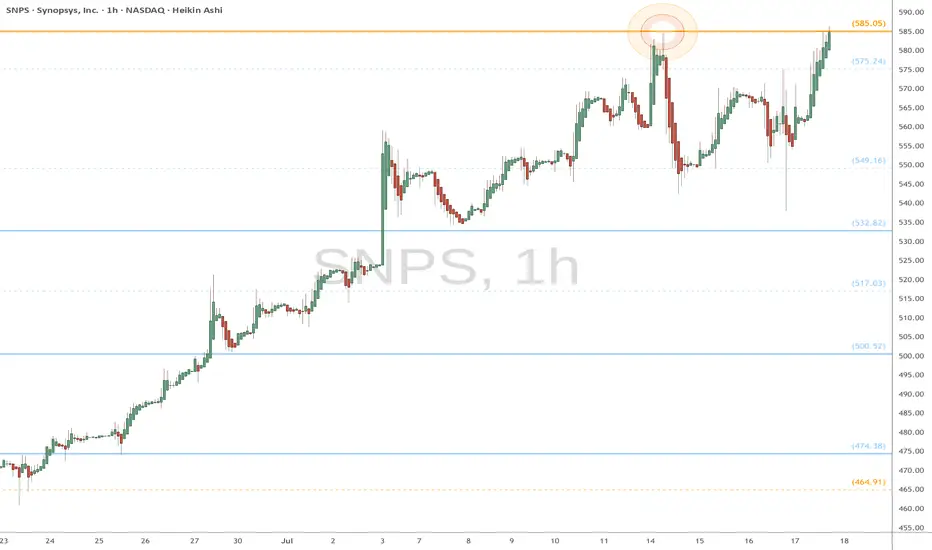
SNPS eyes on $585.05: Golden Genesis break should RUN strongSNPS back to a Golden Genesis that caused last dip.
Current stance and market winds favor break and run.
$585.05 will be key for entries and tight stop losses.
Cardano ADA price analysis🪙 Five months ago, we published a medium-term trade for CRYPTOCAP:ADA , and the price still remains in the buying zone.
With the current growth, the price of OKX:ADAUSDT remains in consolidation, and when the correction begins, it would be very good if it stayed above $0.60.
😈 If you still have faith in the prospects of the #Cardano project, you can continue to hold or even buy #ADA during the correction.
Well, theoretically possible targets for the #ADAusd price are:
TP1 - $1.75
TP2 - $2.90
TP3 - $6.40
_____________________
Did you like our analysis? Leave a comment, like, and follow to get more

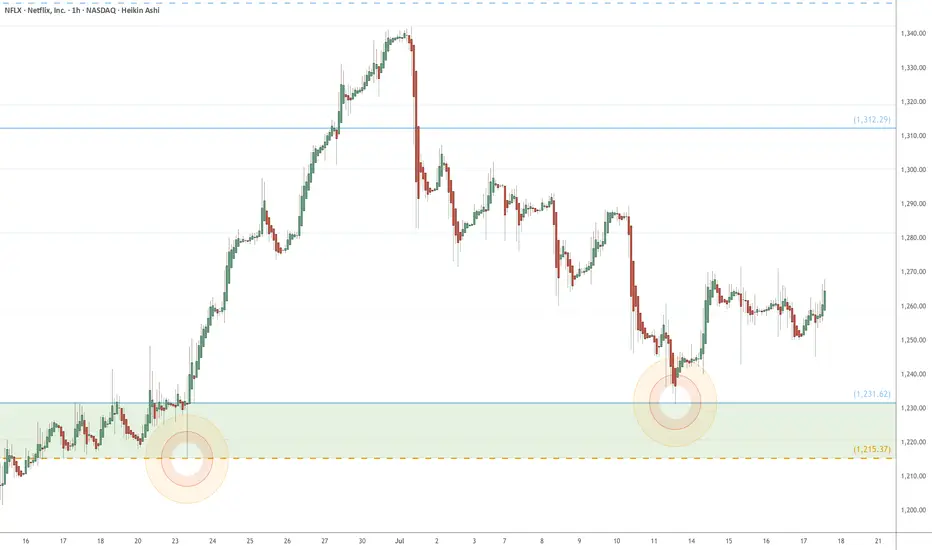
NFLX eyes on $1215-1232: poised for next leg UP with earningsNFLX broke and retested a key resistance zone.
Loud PING's on two major fibs announced support.
It is perfectly set to LAUNCH if earnings are good.
Positive earnings may push to mid $1500's above.
Negative may drop to $1061 Golden Genesis below.
Neutral report should continue uptrend from here.
.
See "Related Publications" for previous charts such as this BOTTOM CALL:
============================================
.
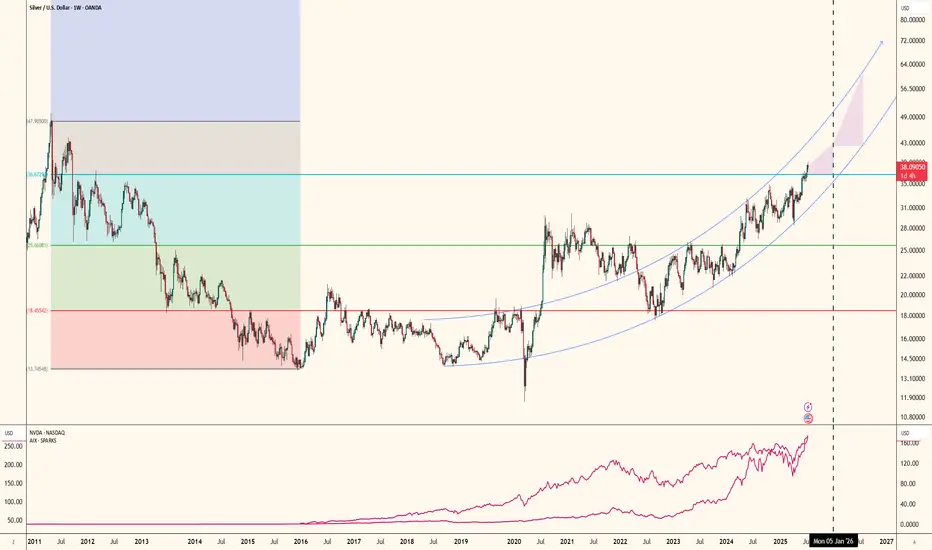
The AI Boom's Unsung HeroThe rise of artificial intelligence isn’t just shaking up tech companies it’s quietly transforming the global silver market in a big way. As major players like NVIDIA, Google and others ramp up their AI infrastructure silver is becoming more critical than ever. Why? Because silver, thanks to its unmatched electrical conductivity, plays a key role in powering the hardware behind AI.
Silver is the most conductive metal on Earth. That makes it perfect for high-performance computing something AI needs a lot of. It’s especially important in data centers and advanced semiconductors, where both electrical and thermal performance are mission-critical.
What’s really interesting is that AI servers tend to use two to three times more silver than traditional data center servers. That’s because AI workloads are more power-hungry, generate more heat and require more complex cooling and electrical systems. Simply put, more AI means more silver.
If there’s one company at the heart of this trend it’s NVIDIA. Analysts at Morgan Stanley expect NVIDIA to consume a staggering 77% of all silicon wafers used for AI accelerators in 2025 up from 51% in 2024. That adds up to around 535,000 300-mm wafers a year each of which contains silver in key components.
All of this AI growth is showing up in the numbers. Industrial silver demand hit an all-time high of 680.5 million ounces in 2024. The electronics industry alone uses around 250 million ounces per year and AI is now the fastest-growing part of that.
Despite all this demand, silver supply just isn’t keeping up. The market’s been in deficit for four straight years, with a total shortfall of 678 million ounces between 2021 and 2024. That’s roughly ten months of global mine output gone missing from the balance sheet.
It’s no surprise, then, that silver prices have been climbing fast. As of July 2025 silver’s up nearly 30% for the year. Looking further ahead I see room for silver to keep climbing:
In the short term (2025): $36–$42 per ounce seems realistic
By 2026: Potential for $50+ as more AI growth stays strong
AI isn’t just changing how we work, communicate, or compute—it’s literally reshaping the commodities that make this technology possible. Silver, once thought of mainly in the context of jewelry or coins, is now a backbone material for the AI revolution.
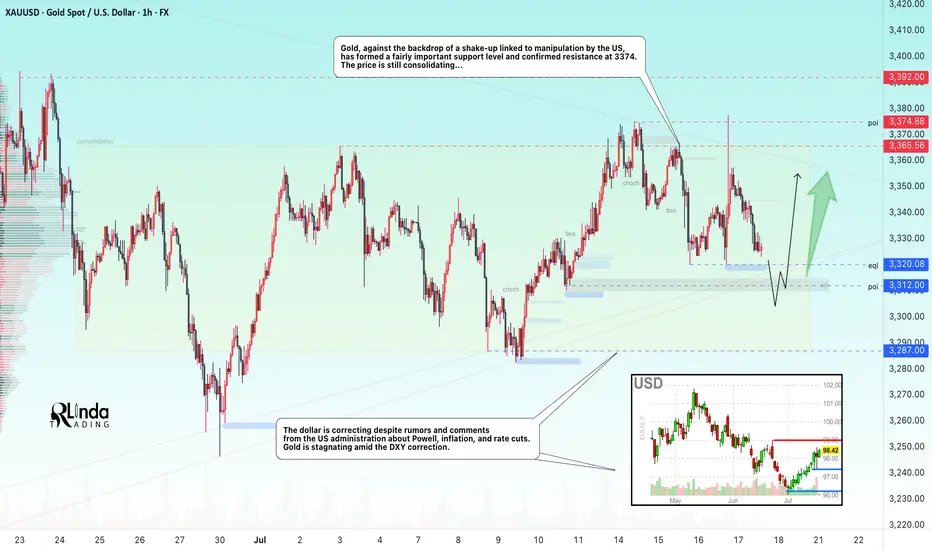
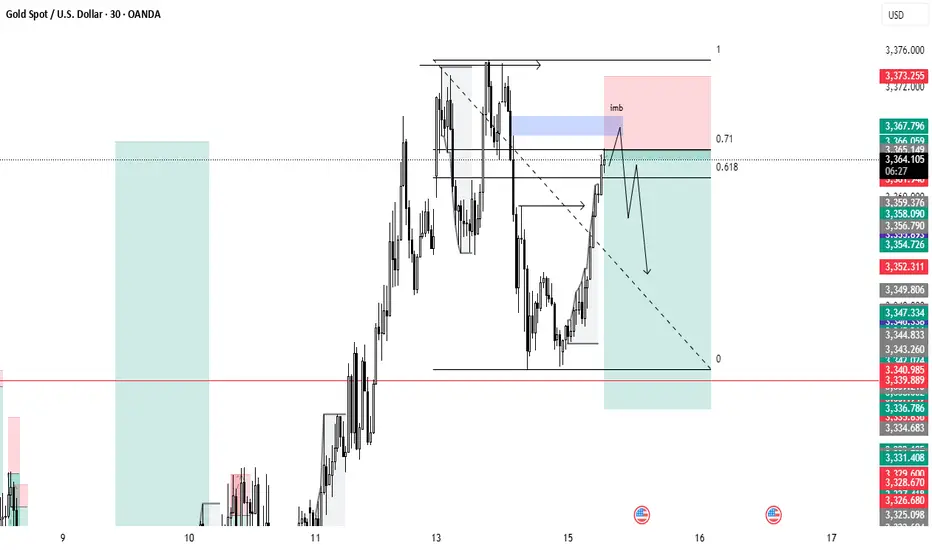
GOLD → The triangle is contracting. Retest of support...FX:XAUUSD tested a local high of 3375 but quickly returned to consolidation. The reason is manipulation by the US administration related to Powell, inflation, and interest rates...
Demand for gold has risen sharply amid global risks: Trump's aggressive tariff plans, strong inflation, and uncertainty about the Fed's actions have increased interest in defensive assets. Despite the temporary strengthening of the dollar, gold remains a popular hedging instrument. Technical analysis also points to a bullish outlook. However, growth potential is limited until the Fed clarifies its interest rate policy
Technically, on the D1 chart, it is clear that the price is consolidating, with the range continuing to narrow. Due to the bullish factors listed above, we can expect growth to continue. However, it is difficult to say where and when the growth will begin due to the uncertainty factor. All attention is on the support at 3320-3312, the triangle support, as well as the consolidation support at 3287.
Resistance levels: 3365, 3375
Support levels: 3320, 3312, 3287
Since the opening of the session, the price has spent part of its daily range, so there may not be enough potential for the decline to continue. A false breakdown of support and consolidation of the price above the key zone may attract buyers, which will trigger growth towards resistance.
Best regards, R. Linda!
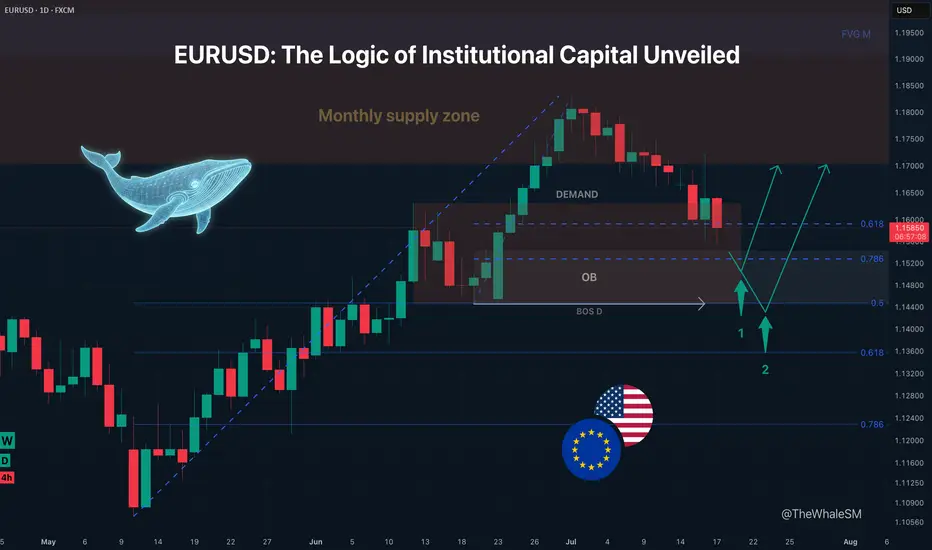
EURUSD: The Logic of Institutional Capital UnveiledThe trend is your friend... until it isn't. While EURUSD remains in a clear global uptrend, the short-term picture is far more deceptive. Before you jump into a long position, it's crucial to understand the bearish order flow that has taken control on the 4H chart.
This idea isn't about fighting the trend, but about having the patience to join it at the right, high-probability moment. Let's dive in.
The most liquid forex asset, EURUSD , continues its global uptrend as long as the price does not close decisively below the daily structure's BOS level at 1.14458. On its ascent, the pair met resistance from a monthly supply zone , from which it began a daily structure correction. This correction was paused by a demand zone and the 61.8% Fib level.
While this might seem like a sufficient support point to consider long positions, let's look at the context on the 4H structure to see why I believe the correction will go deeper.
The 4H structure shows a clear bearish order flow that began from the aforementioned monthly supply zone. We see this order flow manifest as the price consecutively rejects from order blocks #1 and #2 ( they have fulfilled their role and should no longer be considered — any manipulation zone becomes deactivated after its first mitigation ). It would have seemed logical for the price to then reject from OB #3 , where I was personally expecting a counter-trend short trade upon its mitigation, especially after the 4H structure had broken down (BOS 4H).
However, the price doesn't always behave as we expect ; it dropped to the demand zone, leaving behind a 4H FVG. This left OB #3 still technically valid. But the sharp squeeze on July 16th reached the 4H FVG, rebalancing it and thus invalidating OB #3 as a Point of Interest (POI) for large capital. This is because the price was already delivered close to it, and with a high probability, the "Whale" closed its losing hedged long positions there, having no reason to return the price. The sharp upward squeeze on July 16th also served to sweep liquidity from the high marked with an 'x'.
These two factors — the FVG mitigation and the liquidity sweep — confirmed the continuation of the bearish order flow and indicated that the price is likely to continue its corrective move towards the next support levels. Let's examine them in more detail.
~~~~~~~~~~~~~~~~~~~~~~~~~~~~~~~~~~~~~~~~~~~~~~~~~~~~~~~~~~~~~~~~~
Two Potential Long Scenarios
SCENARIO 1: Entry from the Daily Order Block
The first level for a potential reversal is the 78.6% Fibonacci retracement level from the daily structure, in conjunction with a daily order block .
► Setup Condition: Price must reach this level, mitigate the order block, and hold above the 78.6% Fib level. An entry will require LTF confirmation (a BOS or the beginning of LTF order flow).
► Invalidation: A break of the 78.6% level with the price closing below it.
Note: I consider the scenario of breaking this level quite probable due to the weakness of this daily order block — it did not sweep any liquidity when it was formed. Thus, it may itself act as liquidity, activating the second long scenario.
SCENARIO 2: Entry after a Deeper Liquidity Sweep
This scenario becomes valid if the first one fails.
► Setup Condition: A liquidity sweep below the daily structure's break level (BOS D) , which simultaneously corresponds to reaching the 50% Fib level from the weekly structure . This confluence strongly reinforces the setup if this level (at 1.14480) holds. Since this is a weekly level, it must not be broken by the bodies of daily candles closing below it.
► Invalidation: A daily candle close below this level. In that case, we can confidently assume that the uptrend is changing and start looking for short positions.
~~~~~~~~~~~~~~~~~~~~~~~~~~~~~~~~~~~~~~~~~~~~~~~~~~~~~~~~~~~~~~~~~
The principles and conditions for forming the manipulation zones I show in this trade idea are detailed in my educational publication, which was chosen by TradingView for the "Editor's Picks" category and received a huge amount of positive feedback from this wonderful, advanced TV community. To better understand the logic I've used here and the general principles of price movement in most markets from the perspective of institutional capital, I highly recommend checking out this guide if you haven't already. 👇
P.S. This is not a prediction of the exact price direction. It is a description of high-probability setups that become valid only if specific conditions are met when the price reaches the marked POI. If the conditions are not met, the setups are invalid. No setup has a 100% success rate, so if you decide to use this trade idea, always use a stop-loss and proper risk management. Trade smart.
~~~~~~~~~~~~~~~~~~~~~~~~~~~~~~~~~~~~~~~~~~~~~~~~~~~~~~~~~~~~~~~~~
If you found this analysis helpful, support it with a Boost! 🚀
Have a question or your own view on this idea? Share it in the comments. 💬
► Follow me on TradingView to get real-time updates on THIS idea (entry, targets & live trade management) and not to miss my next detailed breakdown.
~~~~~~~~~~~~~~~~~~~~~~~~~~~~~~~~~~~~~~~~~~~~~~~~~~~~~~~~~~~~~~~~~
gold analyse*The content on this analysis is subject to change at any time without notice, and is provided for the sole purpose of assisting traders to make independent investment decisions.

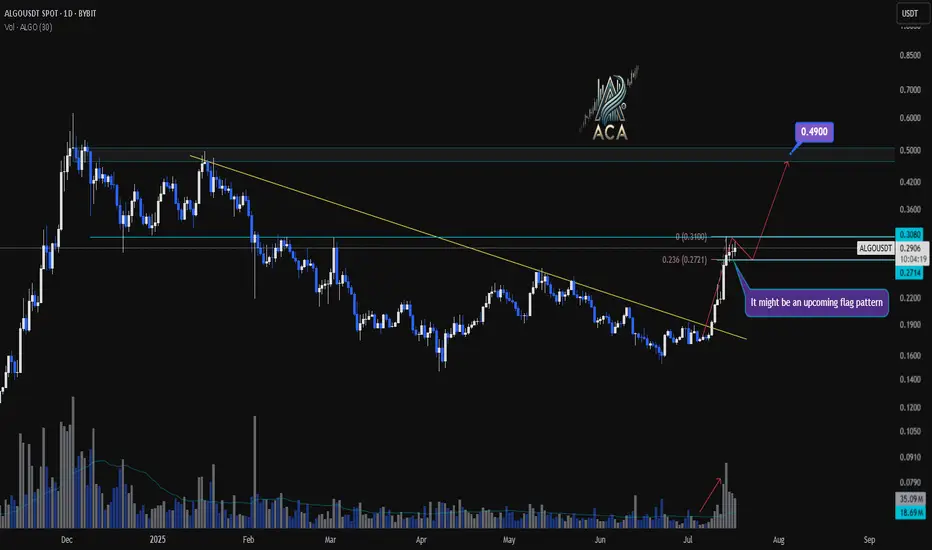
ALGOUSDT Daily Chart Analysis | Continuational patternsALGOUSDT Daily Chart Analysis | Momentum Picks Up on Higher Timeframe
🔍 Let’s break down the latest ALGO/USDT daily chart, highlighting a shift in market structure and key bullish signals.
⏳ Daily Overview
A decisive breakout above the long-standing descending trendline has flipped the narrative for ALGOUSDT. Increased volume during the breakout points to robust bullish momentum, suggesting buyers are regaining control at this multi-month inflection point.
🔔 Flag Pattern & Chart Structure
- Bullish flag pattern is emerging after the recent breakout, as price consolidates in a tight range—a classic continuation formation.
- Former trendline resistance is now acting as support, confirming a notable shift on the higher timeframe.
📐 Fibonacci & Target Levels
- The 0.236 Fibonacci retracement at $0.2771 is providing immediate support, with price consolidating above this anchor level.
- Upside targets:
- First resistance at $0.3080, which aligns with horizontal supply and previous pivot highs.
- If the flag pattern resolves upward, the next Fibonacci extension points to $0.4900, marking a significant confluence and potential for further gains.
📊 Key Highlights
- Strong daily candle and surging volume confirm momentum shift.
- Watch the developing flag pattern for breakout confirmation.
- Major trendline break on the daily signals structural reversal.
- $0.3080 is the immediate target; $0.4900 is the extended objective from the flag/Fibonacci alignment.
🚨 Conclusion
ALGOUSDT is setting up a compelling bullish scenario—keep a close eye on price behavior at the flag and $0.3080 level. A breakout may trigger the next impulsive move toward $0.4900.
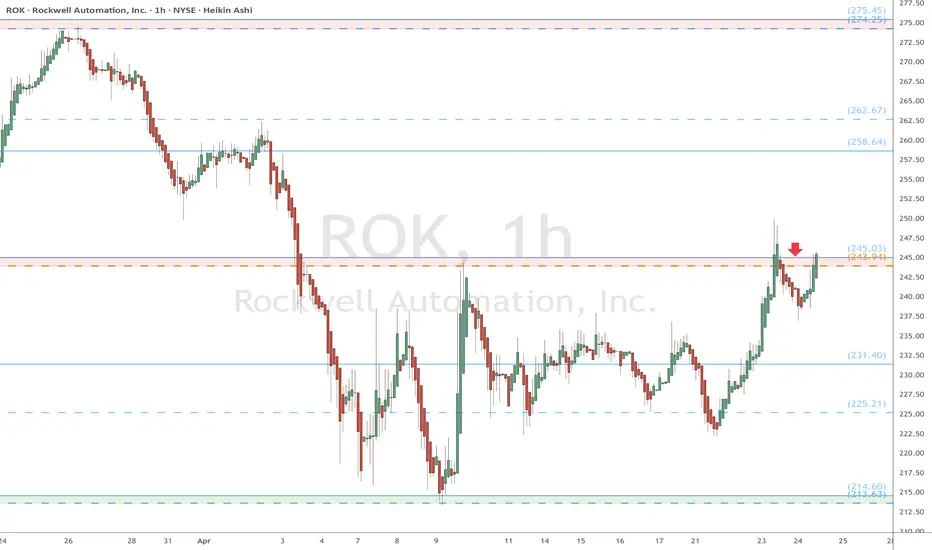
ROK eyes on $245: Key Resistance break may Mark bottomROK trying to recover along with the general market.
Now testing a well proven resistance at $243.94-245.03
Look for a Break-and-Retest for possible long term entry.
JNJ watch $156.72-158.17: Double Golden Fib zone about to break?JNJ struggling against Double Goldens at $156.72-158.17
After many tests from underside, it looks ready to break.
Above this zone are only scattered clouds for some ways.

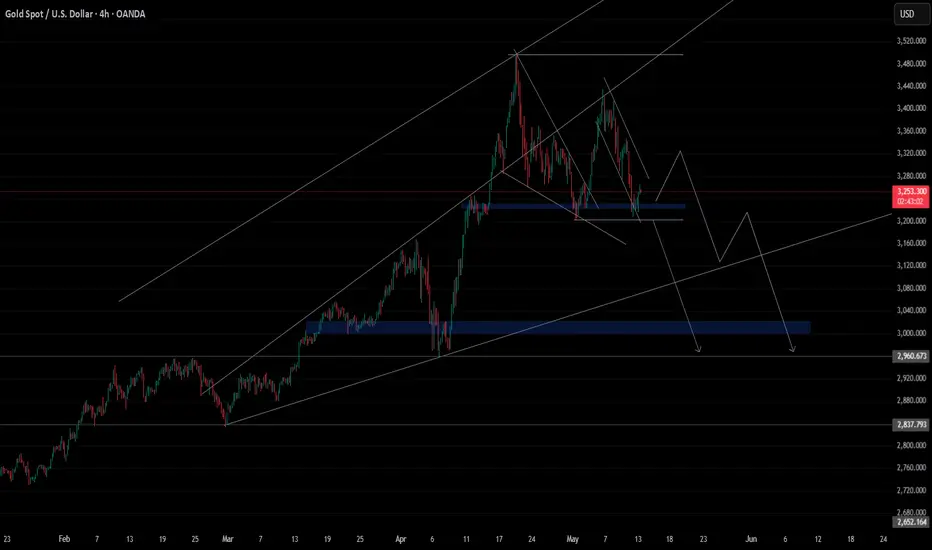
Gold Setup. Midas losing his touch.TVC:GOLD has reached an all time high of $3500. It further created a LH @ $3435 in the daily TF. This signals the beginning of a possible down trend of the commodity with the current fundamentals as confluence.
Furthermore, TVC:GOLD is likely to reach level $3160 and possibly test levels as low as $2960, below the much acclaimed $3000 support structure.
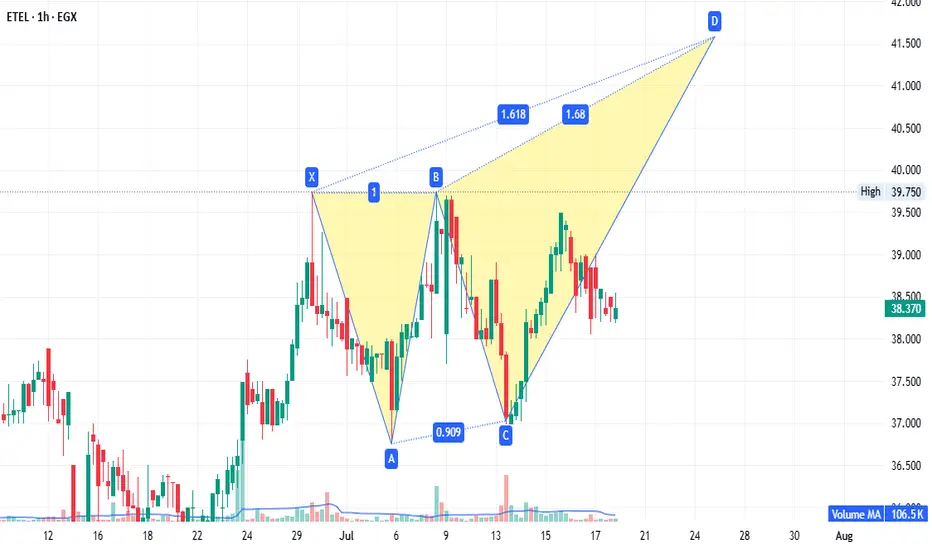
ETEL - strong fundamentals.EGX:ETEL 1-hour timeframe:
A potential bearish Gartley pattern targets 41.50. If prices reach 41.55 (without breaking 37.00), it becomes a sell point with targets at 39.73 and 38.60. Conversely, if prices continue rising and close above 42.70, rebuy what was sold at 41.50, targeting 52.00. This setup is both strategic and supported by strong fundamentals.
Disclaimer: This is not financial advice, only our analysis based on chart data. Consult your account manager before investing.
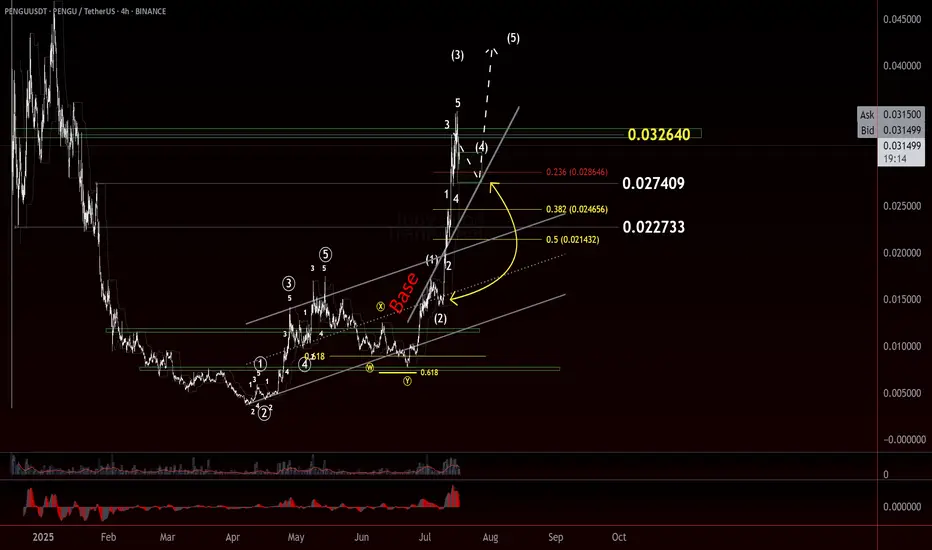
$PENGU Taking a Breather? CSECY:PENGU Taking a Breather? Wave 4 May Be Brewing
After a strong move, CSECY:PENGU looks like it might be pausing for breath. The recent action suggests we may have just wrapped up a small-degree Wave 3, with price now struggling to clear a key resistance level from earlier in the structure.
That hesitation could mark the early stages of a Wave 4 correction...Conservatively.
Here’s the zone I’m watching for a potential W4 pullback:
- .236 to 50% retracement of Wave 3, measured from the Wave 2 low
- Most Likely Target (MLT) sits right around the .382 fib
- Keep an eye on time symmetry—Wave 4 may offset the time duration of Wave 2
- Price could react off the base channel as a support guide
If this is a W4, it could give us a clean continuation setup into Wave 5—provided it holds structure and doesn’t overlap the Wave 1 territory. Stalking the pullback as it plays out, and am ready to react if we see support step in at the expected fib levels or the base channel.
Trade Safe!
Trade Clarity!
AUDCAD - Short Term Sell IdeaH1 - Strong bearish move.
No opposite signs.
Currently it looks like a pullback is happening.
Expecting bearish continuation until the two Fibonacci resistance zones hold.
If you enjoy this idea, don’t forget to LIKE 👍, FOLLOW ✅, SHARE 🙌, and COMMENT ✍! Drop your thoughts and charts below to keep the discussion going. Your support helps keep this content free and reach more people! 🚀
--------------------------------------------------------------------------------------------------------------------

Bitcoin Dominance BTC.D analysisCurrently, the maximum of BTC.D was 65.38% and the absolute maximum is very close, and then the capital will start flowing into altcoins.
We will have to keep a close eye on where the capital will go: only to highly liquid altcoins, or to a certain industry, or to a narrative, as it was before: “defi”, “memecoin”, and so on...
Do you have any ideas where the capital can go? Write in the comments!
❗️ Also, it is worth noting that such a popular term as "alt-season" lasts less and less, and you have to wait longer and longer for it!
It seems that this time the "alt-season" has every chance to last until the end of 2025, and then... it will be seen. Perhaps the market will gain capital and new powerful players who will set a new vector and new rules by 2028....
But first... we have to live to see it!)
_____________________
Did you like our analysis? Leave a comment, like, and follow to get more

Germany 40 – Preparing For A Short Term Range BreakoutTariff worries, including new comments from President Trump stating that he is likely to impose fresh import charges on pharmaceuticals, have continued to dominate the thinking of Germany 40 traders this week. This has lead to some choppy price action for the index, which after opening on Monday at 24140, has bounced between a Tuesday high of 24293 and a Wednesday low of 23923, before settling back into the middle of that range.
Throw into the mix, the start of Q2 earnings season for European corporates and an upcoming ECB interest rate decision in a week's time and you can see how price action could become increasingly volatile moving forward into the end of July.
Earnings season has so far got off to a slow start in Europe and Germany 40 traders may have to wait until SAP, the company carrying the highest market capitalisation ($352 billion) and index weighting (14.5%), reports its results next Tuesday (after the close) for further insight into where prices may move next.
In terms of the ECB rate decision next Thursday (July 24th), market expectations may currently be indicating that another rate cut is unlikely, although it could be a close call. Traders seem to be focusing on recent commentary from policymakers which suggests the balance of power for the time being has shifted to the more hawkish committee members, who have stated that with inflation sitting on the central bank's target of 2% there is no need to cut rates further. Choosing instead to wait for more clarity on the outcome of trade negotiations with the US, which could decide whether a trade war between the world's first and third biggest economies may be something they need to navigate.
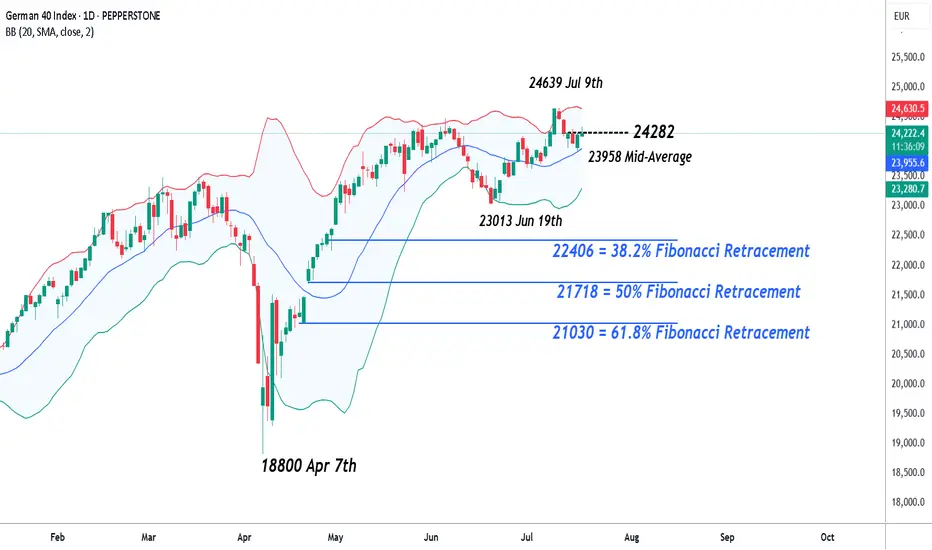
Technical Update: Assessing Current Pirce Action
Having posted a new all-time high at 24639 on July 9th the Germany 40 index has entered a corrective period in price. However, while much will depend on future market sentiment and price trends, traders may well be asking, whether current price declines can develop into a more extended phase of weakness, or if the downside move could be limited as buyers return once again.
Time will tell, but in the meantime, technical analysis may help pinpoint potential support and resistance levels which can aid traders in establishing the next possible trends and directional risks.
Potential Support Levels:
Having recently posted a new all-time high at 24639, it might be argued this is still a positive price trend, especially as the Bollinger mid-average is currently rising. The mid-average stands at 23954, so may mark the first support focus for traders over coming sessions.
However, if closing breaks of this 23954 level materialise, it might lead towards a further phase of price weakness towards 23013, the June 19th session low, even 22406, which is the 38.2% Fibonacci retracement of April to July 2025 price strength.
Potential Resistance Levels:
If the 23954 mid-average successfully holds the current price setback, it could prompt further attempts to extend recent strength.
The first resistance might then stand at 24282, which is equal to half of the latest weakness, with successful closing breaks above this level possibly opening scope back to the 24639 all-time high and maybe further, if this in turn gives way.
The material provided here has not been prepared accordance with legal requirements designed to promote the independence of investment research and as such is considered to be a marketing communication. Whilst it is not subject to any prohibition on dealing ahead of the dissemination of investment research, we will not seek to take any advantage before providing it to our clients.
Pepperstone doesn’t represent that the material provided here is accurate, current or complete, and therefore shouldn’t be relied upon as such. The information, whether from a third party or not, isn’t to be considered as a recommendation; or an offer to buy or sell; or the solicitation of an offer to buy or sell any security, financial product or instrument; or to participate in any particular trading strategy. It does not take into account readers’ financial situation or investment objectives. We advise any readers of this content to seek their own advice. Without the approval of Pepperstone, reproduction or redistribution of this information isn’t permitted.
XRP Hits $3.10 — Rising Wedge or Ready to Fly?XRP has been on a strong run over the past 24 days, rallying from $1.90 → $3.10 — a +62% price increase. But after hitting key resistance, is XRP about to correct, or will it break out further? Let’s dive into the technicals.
🧩 Market Structure
Rising Wedge Pattern:
The current market structure resembles a rising wedge, with XRP likely completing wave 5.
Rejection Zone Hit:
Price tapped the nPOC at $3.10 and rejected — providing a clean short opportunity.
📉 Key Support Levels & Confluences
Taking the full 24-day bullish move:
0.382 Fib Retracement: $2.6326 — aligns with liquidity pool below the $2.6596 swing low.
226-day Trading Range VAH: ~$2.62 (red dashed line) — adds confluence.
Daily Level: $2.60 — further support.
Anchored VWAP from $1.90 Low: ~$2.54 (rising over time).
✅ Conclusion: The $2.66–$2.60 zone is a critical support area and offers a solid long opportunity.
Trade Setups
🔴 Short Setup (After Breakdown Confirmation):
Wait for a sell-off & breakdown of the wedge.
Ideal entry: retest of the lower wedge edge, ideal short entry would be between 0.618–0.786 fib retracement.
🟢 Long Setup:
Entry Zone: $2.66–$2.60
SL: below VWAP line
Target: Fib 0.618 as TP
🧠 Educational Insight: Rising Wedges Explained
A rising wedge is a bearish pattern, often signalling weakening momentum as price climbs within narrowing highs and lows.
Key points:
➡️ Volume typically declines as the wedge matures.
➡️ Breakdown below the lower wedge edge often triggers stronger sell-offs.
➡️ Retests of the broken wedge support turn into ideal short entries.
Pro tip: Combine wedge patterns with fib retracement zones and VWAP levels for higher-confidence setups.
Watch for wedge breakdown confirmation before shorting.
_________________________________
💬 If you found this helpful, drop a like and comment!
Want breakdowns of other charts? Leave your requests below.

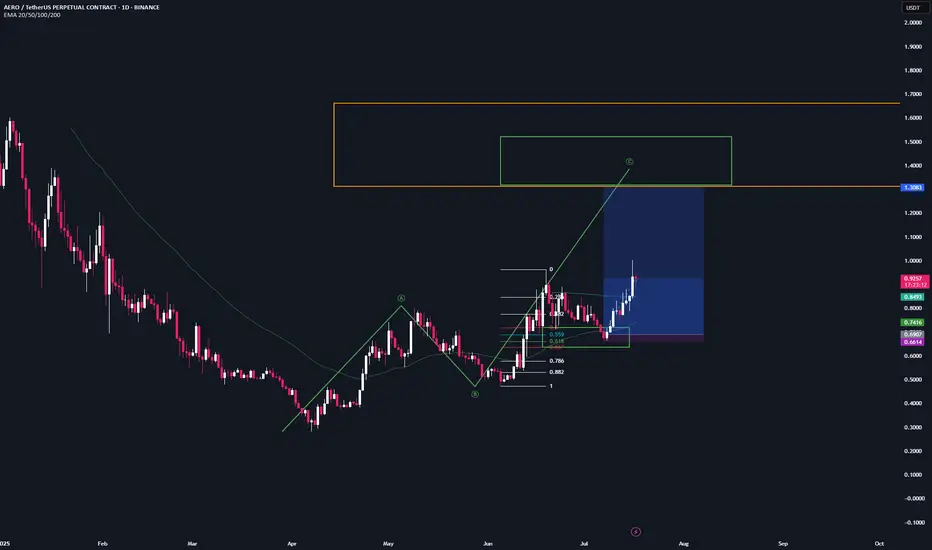
AERO | Trade-UpdateWe’re in full profit on our $AEROtrade.
I took 30% out at the last high, the next target is the bullish target zone (green)
Gave yall that one for free — 12 R/R so far lol.
Your win rate doesn’t need to be high — 30–40% with solid R/R is enough to be profitable.
Have a blessed day!
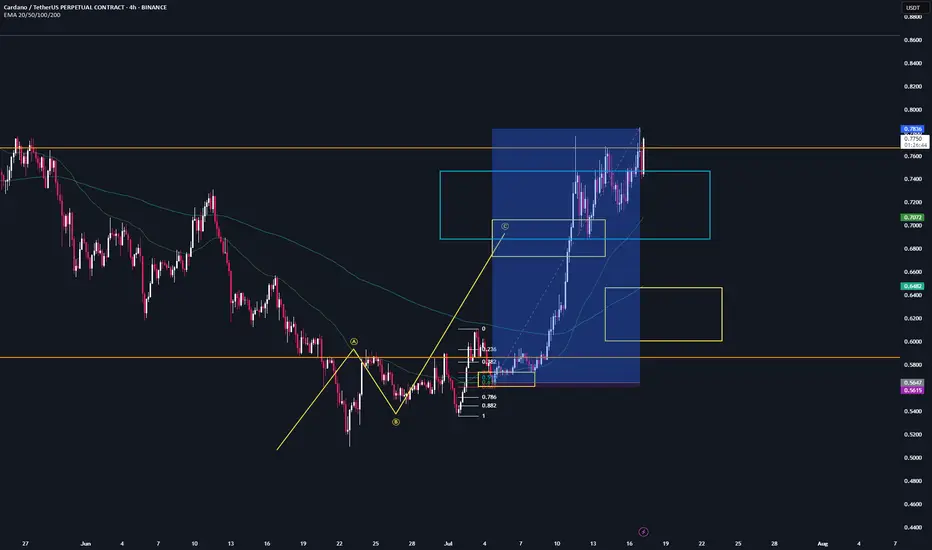
ADA | Trade-updateWe’re in full profit on our CRYPTOCAP:ADA trade.
I took the final profits at the target zone (yellow); just a small portion is still running.
Gave yall that one for free — 68 R/R, lol.
Your win rate doesn’t need to be high — 30–40% with solid R/R is enough to be profitable.
Have a blessed day!