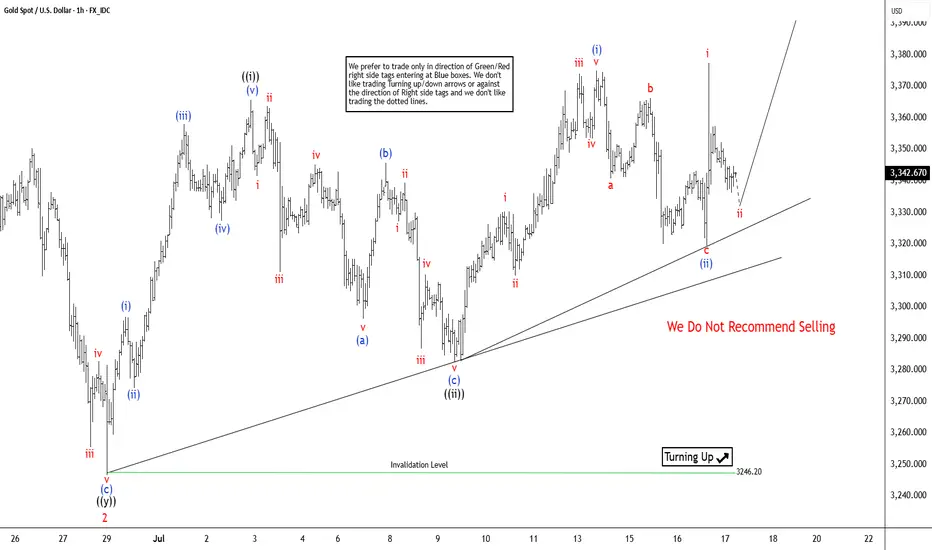
Elliott Wave View: XAUUSD (Gold) Should Continue RallyElliott Wave sequence in XAUUSD (GOLD) suggest bullish view against September-2022 low in weekly. In daily, it should remain supported in 3, 7 or 11 swings to continue rally to extend higher. In daily, it ended ((4)) correction in 7 swings sequence at 3120.20 low in 5.15.2025 low against April-2025 peak. Above May-2025 low, it should continue rally targeting 3589 or higher levels, while pullback stays above 3246.55 low. In 4-hour, it placed 1 at 3452.5 low in proposed diagonal sequence. Within 1, it ended ((i)) at 3252.05 high, ((ii)) at 3245.20 low, ((iii)) at 3365.93 high, ((iv)) at 3245.20 low & finally ((v)) ended at 3452.50 high. It ended 2 in 7 swings correction at 3246.55 low in 6.29.2025. Within 2 pullback, it ended ((w)) at 3340.18 low, ((x)) at 3398.35 high & ((y)) at 3246.55 low in extreme area. It provided short term buying opportunity in extreme area, corrected 0.618 Fibonacci retracement of 1.
Above 2 low, it is showing nest in 1-hour sequence expecting further rally. It needs to break above 6.15.2025 high of 3452.5 to confirm the upside to extend daily sequence. Short term, it placed ((i)) of 3 at 3365.70 high, ((ii)) at 3282.43 low, (i) of ((iii)) at 3374.96 high & (ii) of ((iii)) at 3319.50 low. It is showing higher high since 2 low in 5 swings, which can be nest or a diagonal sequence, if breaks below 7.09.2025 low before rally higher above 6.29.2025 low. In (i), it ended i at 3330.32 high, ii at 3309.91 low, iii at 3374.02 high, iv at 3353.43 low & v at 3374.96 high. In (ii) pullback, it placed a at 3340.76 low, b at 3366.38 high & c as diagonal at 3319.50 low. It already broke above (i) high, confirmed upside can be possible as long as it stays above 3319.50 low.
Currently, it favors pullback in ii of (iii), while placed i at 3377.48 high. It expects pullback in 3 swings to hold above 3319.50 low before rally continue in iii of (iii). The further upside confirms when it breaks above 3452.50 high. Five swings rally from 6.29.2025 low, suggests more upside should be unfold. The next leg higher expects to erase the momentum divergence in 1-hour to be (iii) of ((iii)). Alternatively, if it breaks below 7.09.2025 low, it can be pullback against 6.29.2025 low, while ended ((i)) in diagonal at 3377.48 high. Gold is choppy after April-2025 peak. It can even do double correction, if breaks below 6.29.2025 low, correcting against May-2025 low before rally continue. We like to buy the pullback in 3, 7, or 11 swings pullback as it is bullish in weekly sequence.
Fibonacci
GBPUSD ANALYSIS After seeing the market react to key are of support yesterday and a retrace of a 100% on the Fibonacci seller are still in control of the market a break below support and retest for further sells could occur

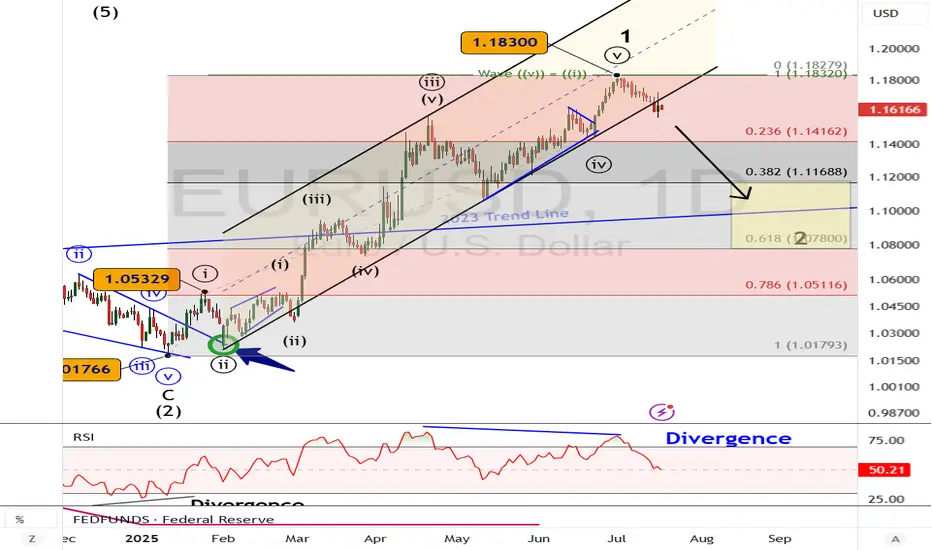
EURUSD Elliott Wave: Top in PlaceExecutive Summary
Wave 1 rally from January 2025 to July 2025 appears complete
Decline to 1.1170 and possibly 1.08 in wave 2.
The support shelf near 1.1170 may contain the decline.
We now have enough evidence in place to consider a medium-term (or longer) top in place for EURUSD.
The weekly chart above shows a rally from the January 2025 low that reached the upper parallel at the July high. This rally appears to be complete and a sideways to lower consolidation is likely underway.
On January 24, we forecasted a rally with a second target of 1.18. EURUSD reached the target topping at 1.1830.
Now, it’s time to flip the scrip as a correction is likely underway to correct that strong rally.
The 6-month rally in EURUSD appears to have ended this month and a correction is likely underway to 1.1170 and possibly lower levels.
The top of EURUSD on July 1 is labeled as wave 1. The decline underway appears incomplete and would be wave 2.
Within the wave 1, wave ((v)) measures equal to wave ((i)) at 1.1832, just a couple of pips within the actual high. Additionally, there is RSI divergence within the wave ((v)) and wave ((iii)) highs. This is a common pattern within a fifth wave of an Elliott wave impulse pattern.
The next trend (lower) will likely carry to below 1.1170.
Near this level is the 38% Fibonacci retracement level of the 6-month rally. Additionally, there is a support shelf of broken resistance and congestion appearing between 1.1033 - 1.1275.
At the lower end of that price zone is a broken trend line dating back to 2023. Therefore, this price zone will offer up a strong level of support that may launch the next rally or at least a small bounce.
BOTTOM LINE
The Elliott wave impulse pattern from January to July 2025 appears over. A downward correction appears to have begun and may visit 1.1170 and possibly lower levels.
As the downward trend takes hold, we’ll review its structure to determine where we are at within the larger wave sequence.
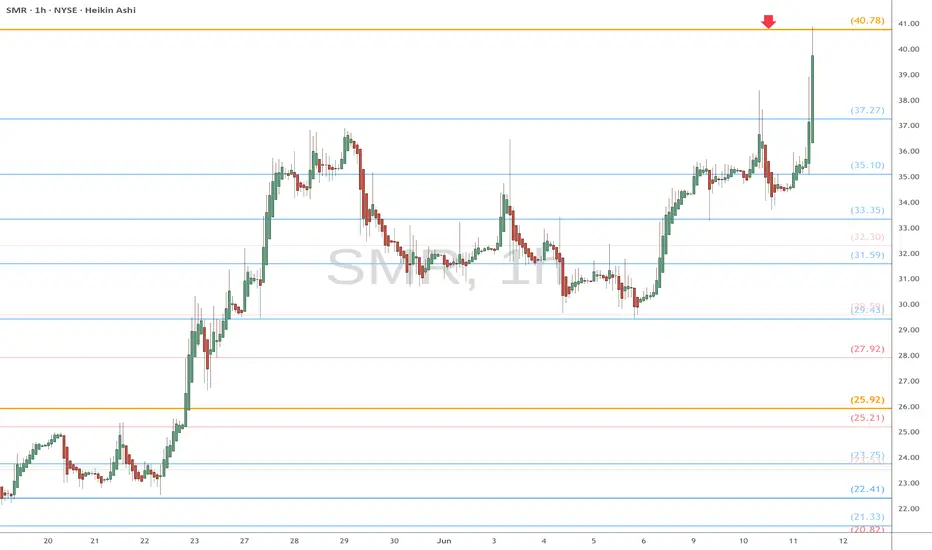
SMR heads up at $40.78: Golden Genesis fib may cause a DIPSMR got a strong spike with all nuclear stocks.
It has just hit a Golden Genesis fib at $40.78.
Look for a Dip-to-Fib or Break-n-Retest for longs.
.
See "Related Publications" for previous plots including this BOTTOM CALL:
===========================================
.
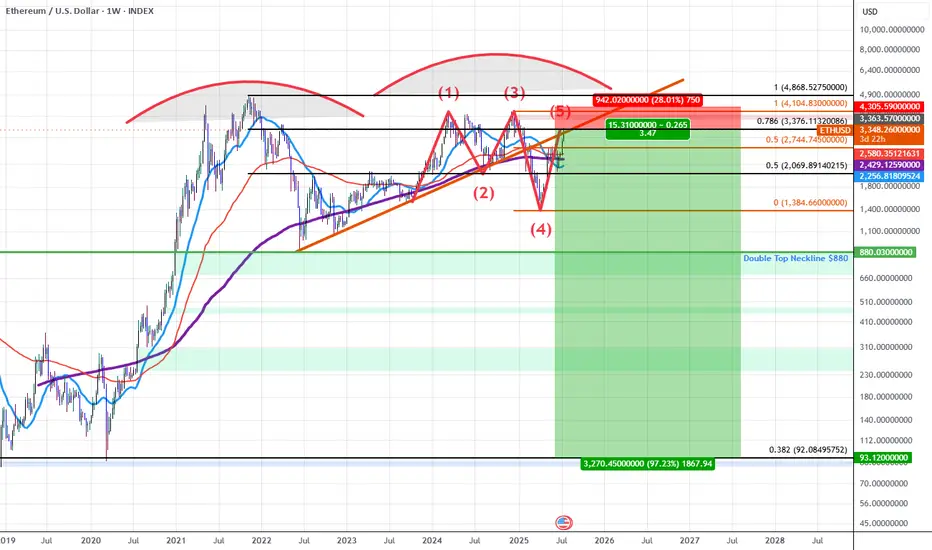
ETHUSD: Double Top into A Bearish 5-0 Breakdown (Extended)Updated Commentary: ETH has extended a bit further than projected as the Pattern Completed at the 0.618 but ETH gapped into the 0.786 instead. The gap up aligned with an upside gap fill on the CME futures as well as a gap fill on the grayscale ETH futures ETF $ETHE. The easier move from here to simply add to the ETH shorts and adjust the stop to be above the previous highs while sizing up at the 0.786 and playing off this gap higher as an anomaly. Beyond this, my view on ETH at the current 0.786 retrace remains the same as the original Idea posted as ETH rose into the initial 0.618 PCZ the details of which I will also include once again below as it still remains relevant.
ETH for the last 5 years has been developing a Double Topping pattern which has put in a series of lower highs during the most recent 2nd run up. As we've confirmed these lower highs we've broken down below trendline and are finding resistance at the trendline which happens to have confluence with the PCZ of a Bearish 5-0 wave formation near a 0.786 retrace.
As we begin to find weakness and Bearish price action begins I suspect price will make it's way towards the neckline of the double top aligning with the $880 price level if ETH breaks below that level there will be no significant support until it reaches the all-time 0.382 retrace down at around $92.10.
In short it seems ETH is in the early stages of a macro breakdown which could result in value declines greater than 80%.
I also suspect that we will see many of the assets that ran up significantly going into this week to sharply reverse those run-ups as this week comes to a close and the new week begins mainly due to the effects of OpEx, this includes: Bitcoin, MSTR, SOL, XLC, META, and BTBT. Long-dated Put accumulation on these assets at these levels is far easier to manage than naked short positions and that's how I will go about positioning here.
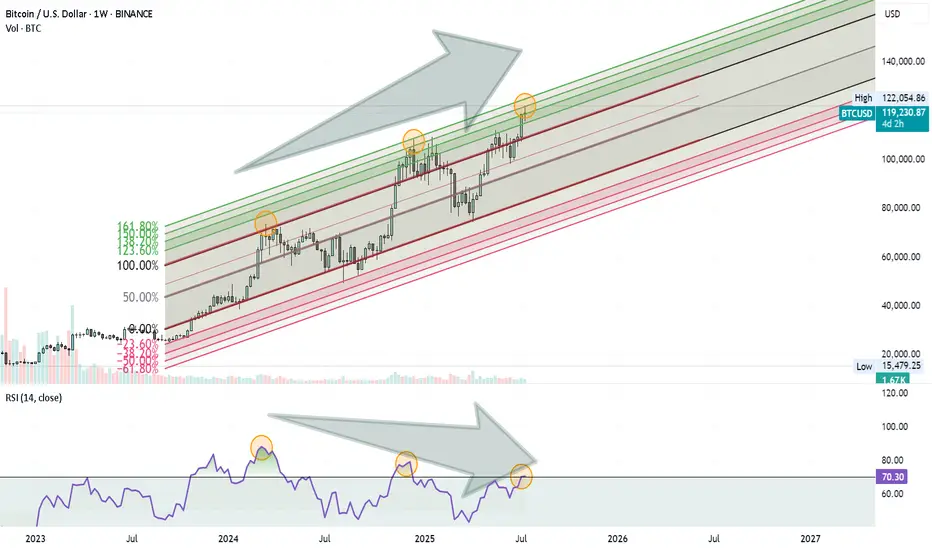
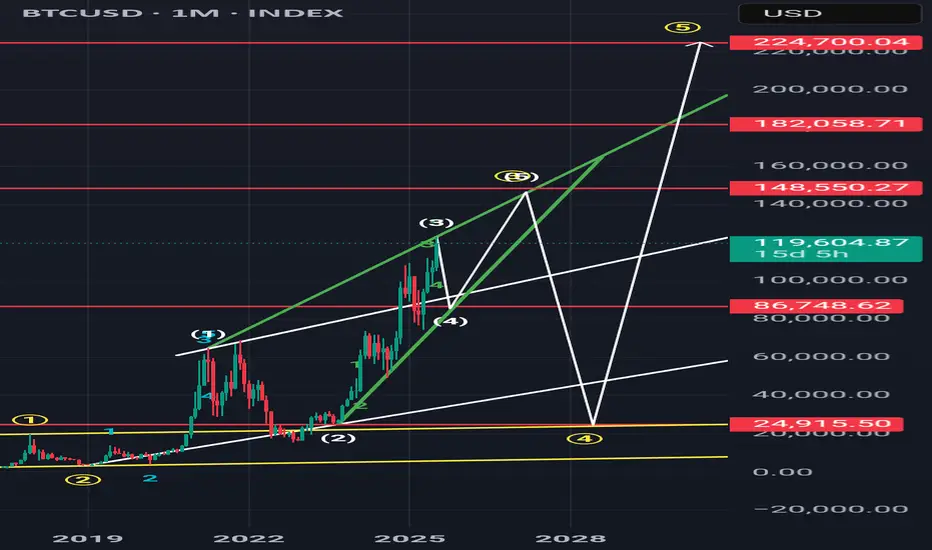
Bitcoin Rally Losing Steam?Bitcoin might be approaching a Turning Point . Here’s what I’m seeing on the weekly chart:
Price is moving inside an ascending Fibonacci channel.
It’s getting close to the 1.60 (160%) extension level, which has acted as a reversal zone before.
At the same time, the RSI is showing a clear negative divergence, suggesting that momentum is weakening.
These signs combined could mean we’re not far from a significant correction.
Nothing is confirmed yet, but it’s a setup worth keeping an eye on.
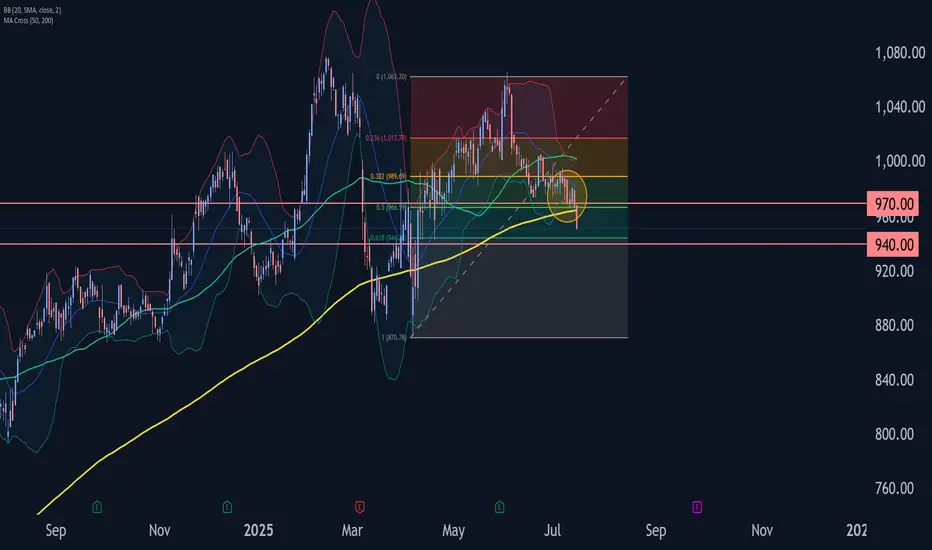
Costco Wave Analysis – 16 July 2025
- Costco broke the support area
- Likely to fall to support level 940.00
Costco recently broke the support area located between the pivotal support level 970.00 and the 50% Fibonacci correction of the upward impulse from April.
The breakout of this support area accelerated the C-wave of the active ABC correction (2).
Costco can be expected to fall to the next support level 940.00 (target price for the completion of the active C-wave).
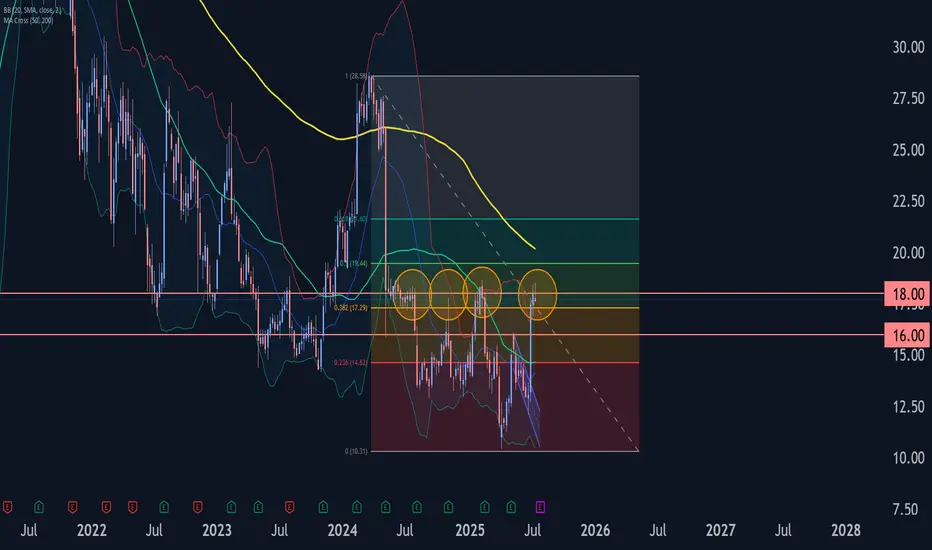
Trip Wave Analysis – 16 July 2025- Trip reversed from resistance area
- Likely to fall to support level 16.00
Trip recently reversed down from the resistance area located at the intersection of the strong resistance level 18.00, upper weekly Bollinger Band and the 38.2% Fibonacci correction of the weekly downtrend from 2024.
The downward reversal from this resistance area stopped the earlier weekly impulse waves i and C.
Given the strength of the resistance level 18.00 and the overbought weekly Stochastic, Trip can be expected to fall to the next support level 16.00.
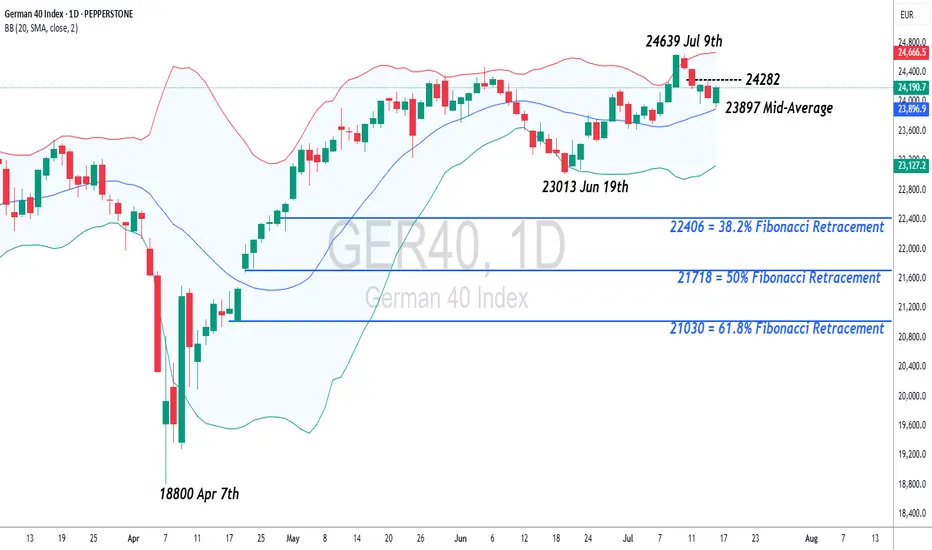
Germany 40 – Preparing For A Short Term Range BreakoutTariff worries, including new comments from President Trump stating that he is likely to impose fresh import charges on pharmaceuticals, have continued to dominate the thinking of Germany 40 traders this week, leading to some choppy price action for the index, which after opening on Monday at 24084, has bounced between a Tuesday high of 24293 and a Wednesday low of 23925, before settling back into the middle of that range.
Throw into the mix, the start of Q2 earnings season for European corporates and an upcoming ECB interest rate decision in a week's time and you can see how price action could become increasingly volatile moving forward into the end of July.
Earnings season has so far got off to a slow start in Europe and Germany 40 traders may have to wait until SAP, the company carrying the highest market capitalisation ($352 billion) and index weighting (14.5%), reports its results next Tuesday (after the close) for further insight into where prices may move next.
In terms of the ECB rate decision next Thursday (July 24th), market expectations may currently be indicating that another rate cut is unlikely, although it could be a close call. Traders seem to be focusing on recent commentary from policymakers which suggests the balance of power for the time being has shifted to the more hawkish committee members, who have stated that with inflation sitting on the central bank's target of 2% there is no need to cut rates further. Choosing instead to wait for more clarity on the outcome of trade negotiations with the US, which could decide whether a trade war between the world's first and third biggest economies may be something they need to navigate.
Technical Update:
Having posted a new all-time high at 24639 on July 9th the German 40 index has entered a corrective period. However, while much will depend on future unknow market sentiment and price trends, traders may well be asking, if current price weakness can develop into a more extended phase of weakness, or if downside is just a limited move before buyers return to extend price strength.
Time will tell, but in the meantime, technical analysis may help pinpoint potential support and resistance levels, aiding us establish next potential trends and directional risks.
Potential Support:
Having recently posted a new all-time high at 24639, it might be argued this is still a possible positive trend, especially as the Bollinger mid-average is currently rising. This for Thursday stands at 23897, so may mark the first support focus for traders over coming sessions.
If closing breaks of this 23965 level materialise, it might lead towards a further phase of price weakness towards 23013, the June 19th session low, even 22406, the 38.2% Fibonacci retracement of April to July 2025 price strength.
Potential Resistance:
If the 23965 mid-average successfully holds the current price setback, it could possibly prompt further attempts to extend recent strength.
First resistance might then stand at 24282, equal to half latest weakness, with successful closing breaks possibly then opening scope back to the 24639 all-time high and maybe further, if this in turn gives way.
The material provided here has not been prepared accordance with legal requirements designed to promote the independence of investment research and as such is considered to be a marketing communication. Whilst it is not subject to any prohibition on dealing ahead of the dissemination of investment research, we will not seek to take any advantage before providing it to our clients.
Pepperstone doesn’t represent that the material provided here is accurate, current or complete, and therefore shouldn’t be relied upon as such. The information, whether from a third party or not, isn’t to be considered as a recommendation; or an offer to buy or sell; or the solicitation of an offer to buy or sell any security, financial product or instrument; or to participate in any particular trading strategy. It does not take into account readers’ financial situation or investment objectives. We advise any readers of this content to seek their own advice. Without the approval of Pepperstone, reproduction or redistribution of this information isn’t permitted.
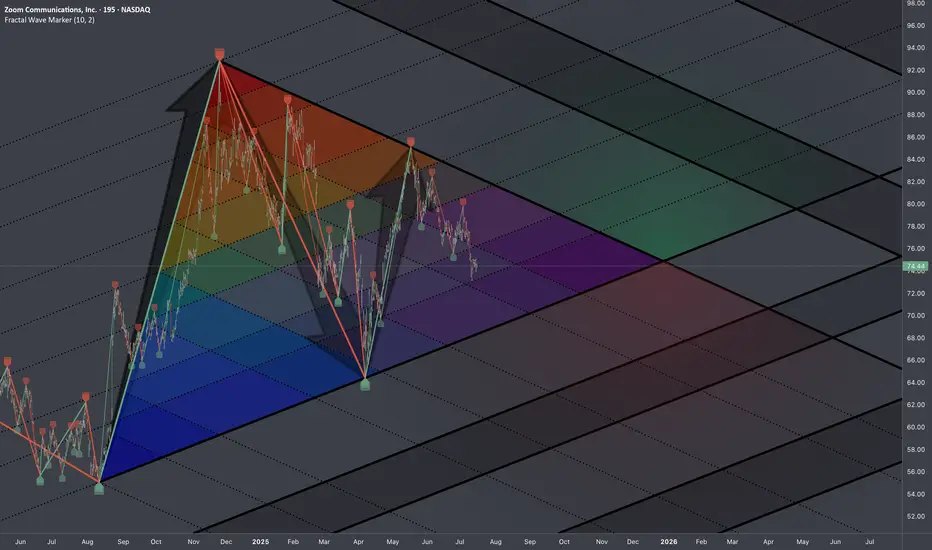
$ZM: Fib TriangleChose TF 195m (3h15m) so that each candle is half of trading session.
Research Notes
Documenting identified compression of cycles and their phases on multiple scales:
Fib Interconnections of critical points:
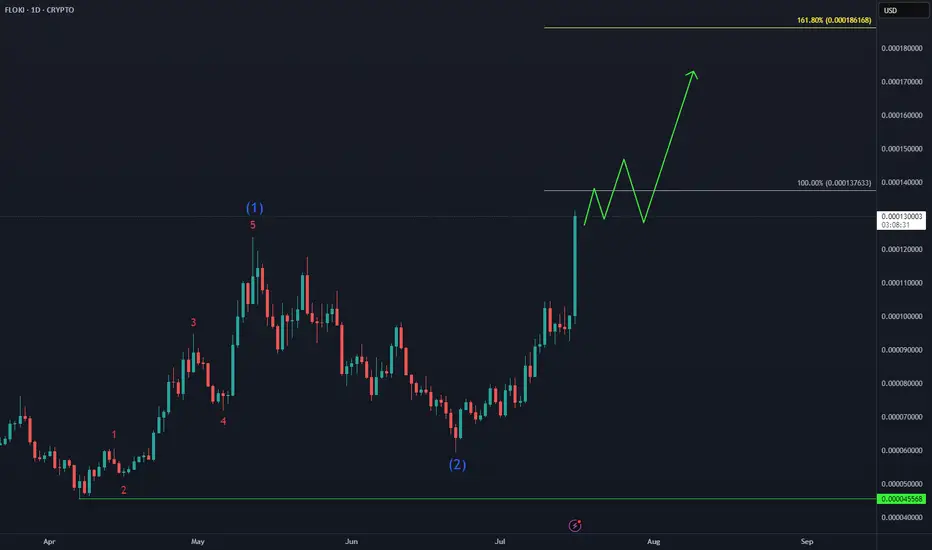
FLOKI Isn’t Missing the Party🚀 CRYPTO:FLOKIUSD Price has broken above the May peak, confirming a bullish continuation. With momentum building, price is now eyeing the next upside target near $0.00018.
#elliottwave #memecoins #altseason
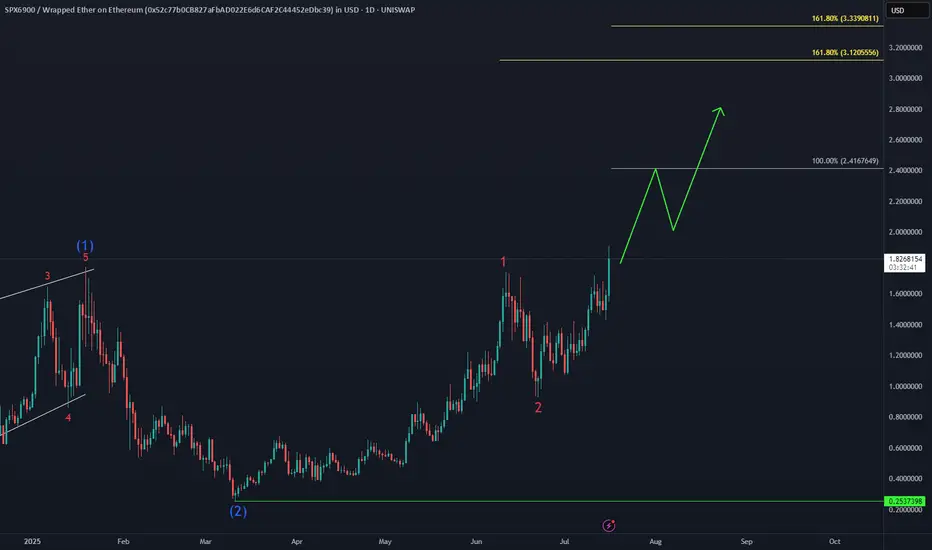
#SPX6900 Bullish SequenceThe Gate Is Open – Send It 🚀🚀🚀
UNISWAP:SPXWETH_52C77B.USD just smashed into a new all-time high, unlocking the next bullish targets at $2.4 and $3.1.
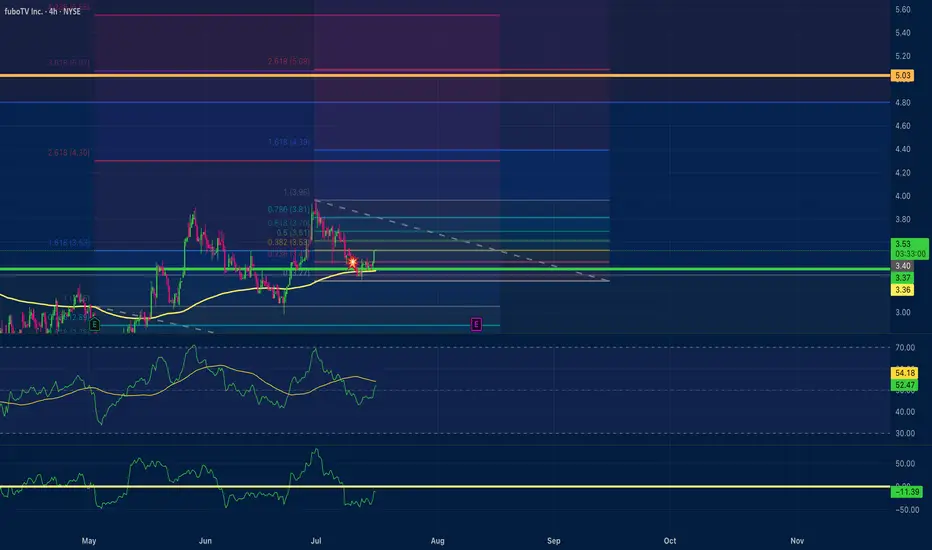
fuboTV $5.00 price target Positive Divergence Multi time frameMy trade on fuboTV has a $5.00 price target. With positive divergence multiple time frames 15,1hr, 4hr. An RSI scoop where the hrly RSI with a length setting of 36 shows upward momentum? The Chande momentum oscillator with a setting of 24 indicates the price may not stall at $4.50.
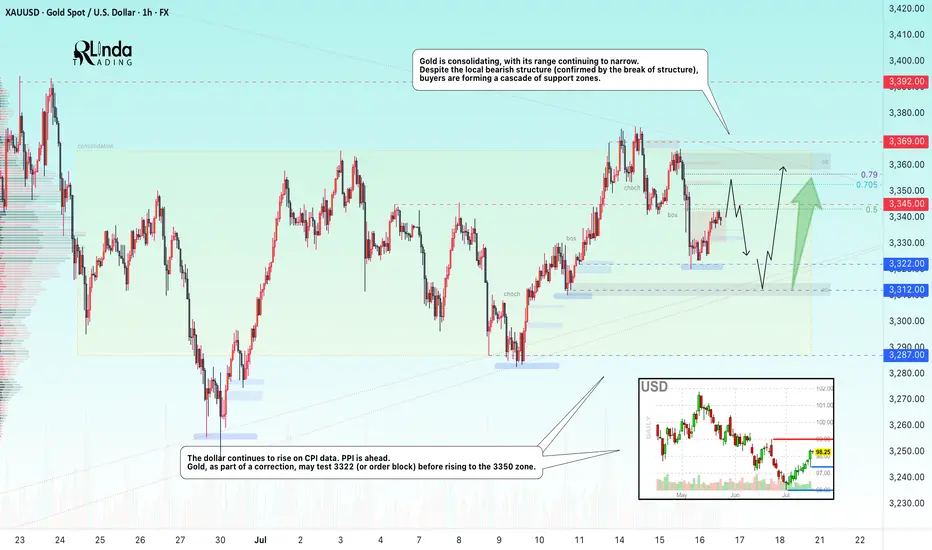
GOLD → Borders are shrinking. Consolidation continues...FX:XAUUSD is adjusting amid controversial CPI data and confirming the local bearish market structure. The PPI is ahead, and gold is consolidating, with its boundaries continuing to narrow...
Gold is recovering slightly but remains under pressure amid rising bond yields and a stronger US dollar. Higher inflation in the US reduces the chances of a quick Fed rate cut. Traders are cautious ahead of the PPI data release. If producer inflation exceeds forecasts, the dollar may rise again, putting further pressure on gold
Technically, we see consolidation in a symmetrical triangle pattern. Trading within the consolidation has a negative side - low volatility and unpredictable movements. The purpose of such movements is accumulation. However, decisions can be made based on relatively strong levels. In the current situation, we are seeing a rebound from 0.5 Fibonacci (I do not rule out a retest of the 0.7 zone before correction). The price may head towards the liquidity zone of 3322 before rising to the upper boundary of the consolidation and the zone of interest of 3350-3360.
Resistance levels: 3345, 3353, 3369
Support levels: 3322, 3312, 3287
The problem is that the price is in a consolidation phase. That is, technically, it is standing still and moving between local levels. You can trade relative to the indicated levels. Focus on PPI data. At the moment, gold is in the middle of a triangle and is likely to continue trading within the boundaries of a narrowing channel due to uncertainty...
Best regards, R. Linda!
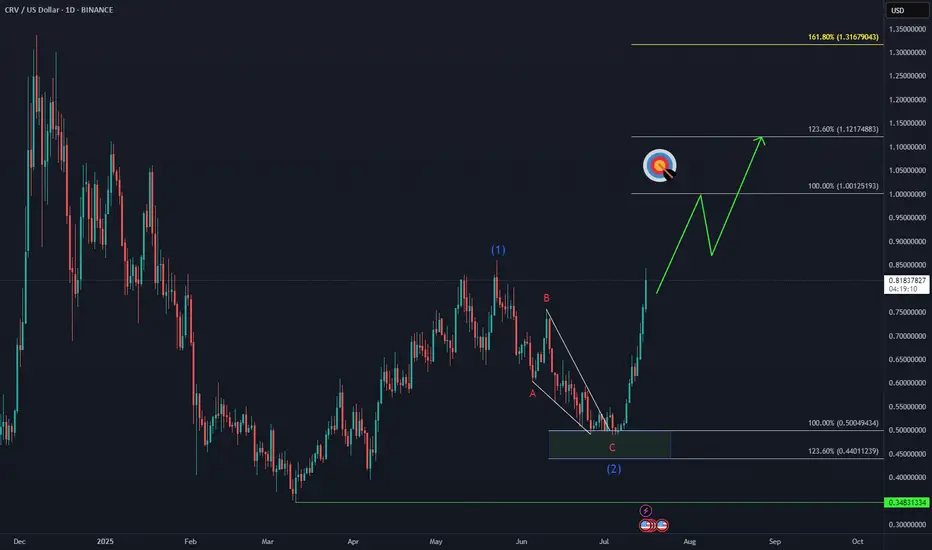
CRV Marching Toward Target📈 CRYPTO:CRVUSD is approaching a key breakout level, with bulls aiming to surpass the May peak and reach the $1.00 initial target.
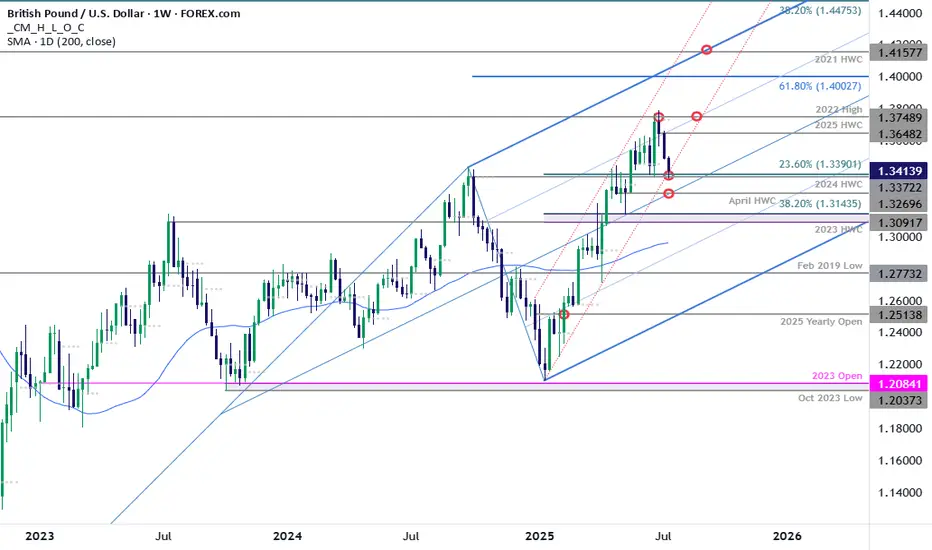
GBP/USD Plunges to Make-or-Break SupportSterling is poised to mark a third consecutive weekly decline after turning from resistance at multi-year highs. The decline takes price into critical support at the yearly trendline- this is a make-or-break level for the bulls.
GBP/USD is testing confluent support today at 1.3372/90- a region defined by the 2024 high-week close (HWC) and the 23.6% retracement of the yearly range. Looking for a reaction off this mark with a weekly close below the April HWC / median-line at 1.3270 ultimately needed to suggest a more significant high is in place / invalidate the yearly uptrend. Subsequent support rests with the 2023 HWC / 38.2% retracement at 1.3091-1.3143 and the 52-week moving average, currently near ~1.2980.
Weekly resistance now eyed at the yearly high-week reversal close at 1.3648 with a breach / close above the 2022 high at 1.3749 still needed to mark resumption of the broader Sterling up trend. Subsequent resistance objectives eyed at the 61.8% extension of the 2022 advance at 1.4003 and the 2021 HWC at 1.4158.
Bottom line: Sterling is attempting to break below the yearly uptrend and the focus is on the weekly close with respect to 1.3372/90- risk for price inflection here. From a trading standpoint, a good zone to reduce portions of short-exposure / lower protective stops- rallies should be limited to 1.3648 IF price is heading lower on this stretch with a close below 1.3270 needed to suggest a reversal is underway.
-MB
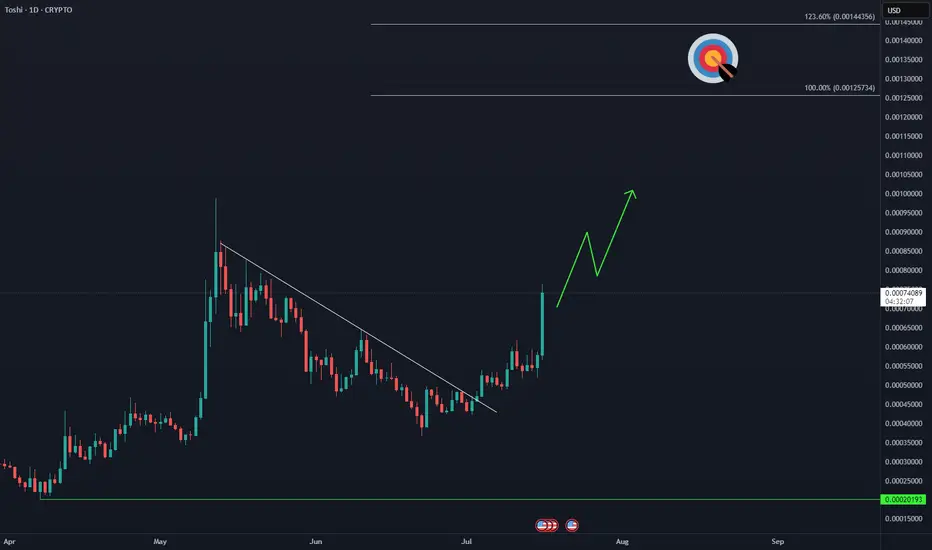
TOSHI Bulls on the Move🚀 COINBASE:TOSHIUSD is showing signs of acceleration, aiming to break above the May peak and extend toward the $0.0012 target zone.
#btc #btcusd #elliottwave short sell setup wave 4 16Jul24This count is based on my assumptions so anything can happen not a trading or financial advice just for educational purposes only kindly do your own ta thanks trade with care good luck.
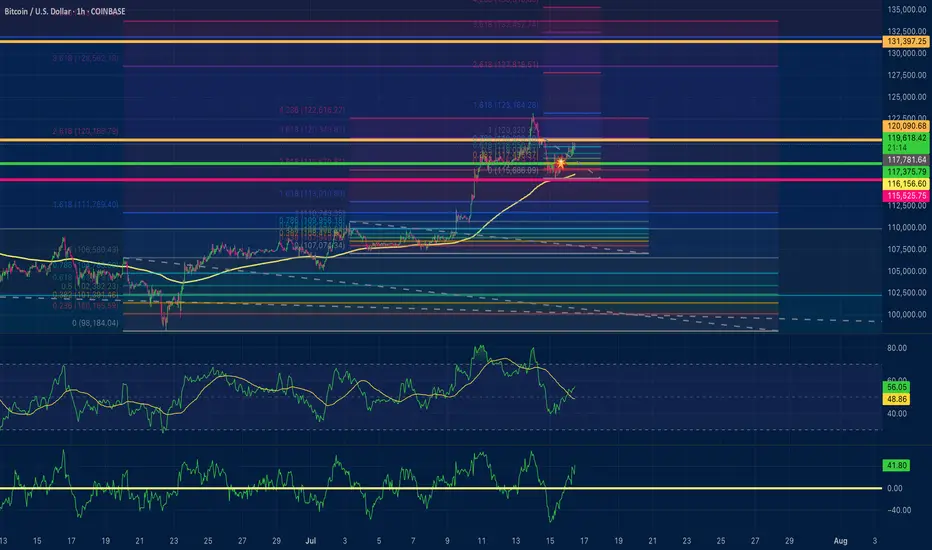
Bitcoin positive diversion to $131,000Using fibonacci retracements for price targets based off of positive divergences on the 15 min time frame and hourly time frame. I am utilizing 2 ioscilating indicators: RSI length is 36 with smma at 50 and the Chande momentum oscillator with a length of 24. My conservative estimate is $131,000 for a safe trade close. $132,400 exact area for pullback to $128,500?
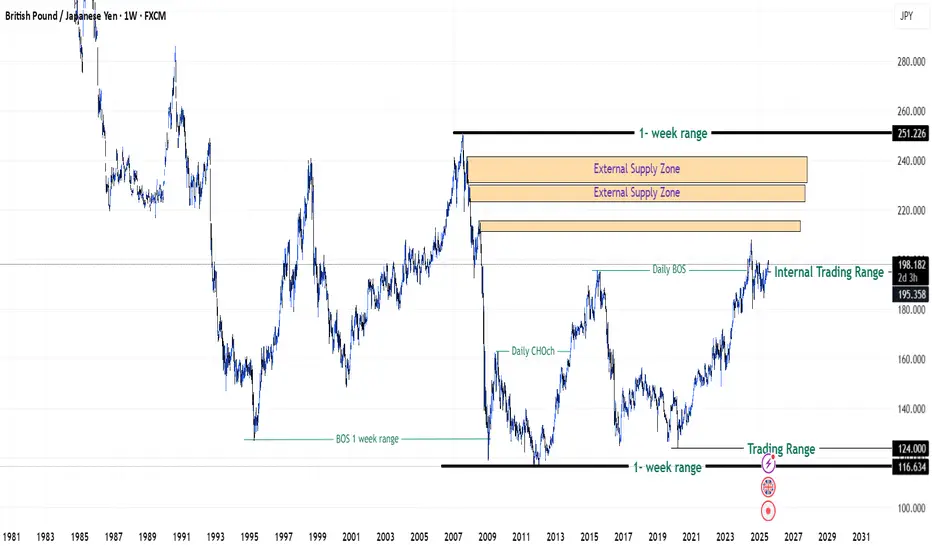
GBPJPY in Premium Zones of 2008 Financial Crisis - {17/07/2025}Educational Analysis says that GBPJPY (FX pair) may give trend Trading opportunities from this range, according to my technical analysis.
Broker - FXCM
So, my analysis is based on a top-down approach from weekly to trend range to internal trend range.
So my analysis comprises of two structures: 1) Break of structure on weekly range and 2) Trading Range to fill the remaining fair value gap
Will Jpy start to lose value like it is doing since 2019 or it will do free fall same like 2008 crisis.
Let's see what this FX pair brings to the table for us in the future.
Please check the comment section to see how this turned out.
DISCLAIMER:-
This is not an entry signal. THIS IS FOR EDUCATIONAL PURPOSES ONLY.
I HAVE NO CONCERNS WITH YOUR PROFIT OR LOSS,
Happy Trading.
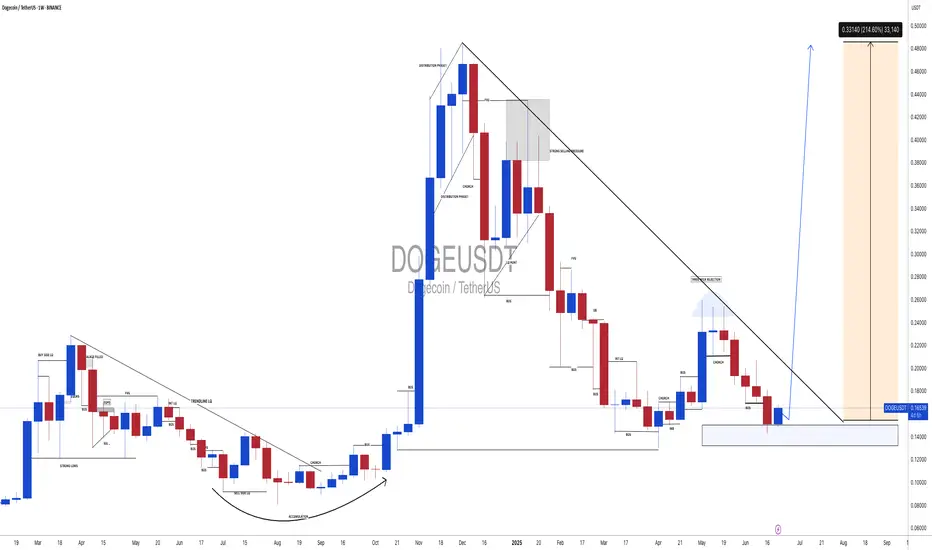
DOGEUSDT: Time For Bulls To Rule! The Dogecoin is currently trading at a key buying level, making it a potential opportunity to buy. However, we need confirmation before making a purchase or entering a trade. This trade could take time to develop as we are currently in the accumulating phase. To be certain of the price direction, we need to enter the distribution phase. While a single swing trade could be a target, you can set your own risk management parameters.
Good luck and trade safely!
Team Setupsfx_
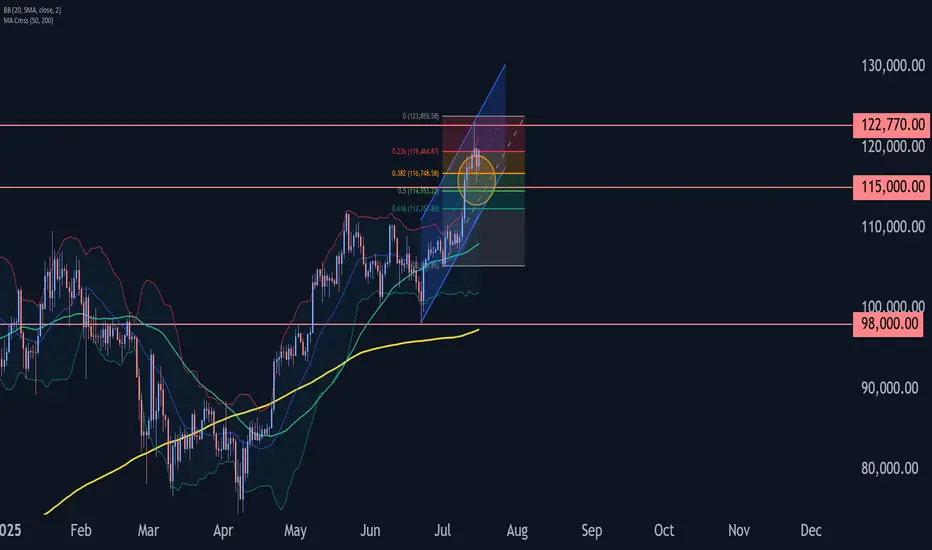
Bitcoin Wave Analysis – 16 July 2025- Bitcoin reversed from a support area
- Likely to rise to resistance level 122770.00
Bitcoin cryptocurrency recently reversed up from the support area located between the key support level 115000.00 and the support trendline of the daily up channel from June.
This support area was further strengthened by the 38.2% Fibonacci correction of the sharp upward impulse from July.
Given the clear daily uptrend and the strongly bullish sentiment seen across cryptocurrency markets today, Bitcoin cryptocurrency can be expected to rise to the next resistance level 122770.00 (top of the previous impulse wave i).
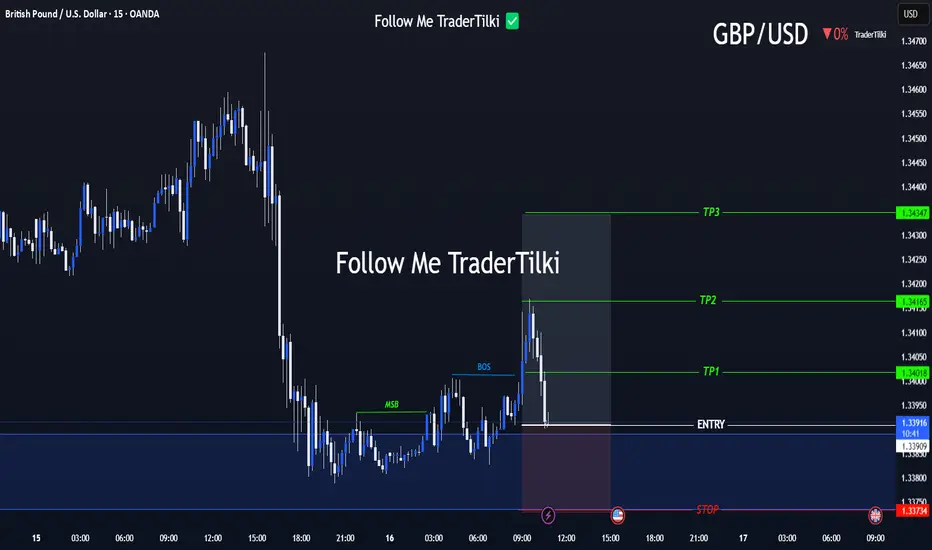
Strategic Entry, Clear Targets: The GBPUSD Game Plan Is Set📢 Hello Guys,
I've prepared a fresh GBPUSD signal for you:
🟢 Entry Level: 1.33918
🔴 Stop Loss: 1.33734
🎯 TP1: 1.34018
🎯 TP2: 1.34165
🎯 TP3: 1.34347
📈 Risk/Reward Ratio: 2,40
------
Your likes and support are what keep me motivated to share these analyses consistently.
Huge thanks to everyone who shows love and appreciation! 🙏