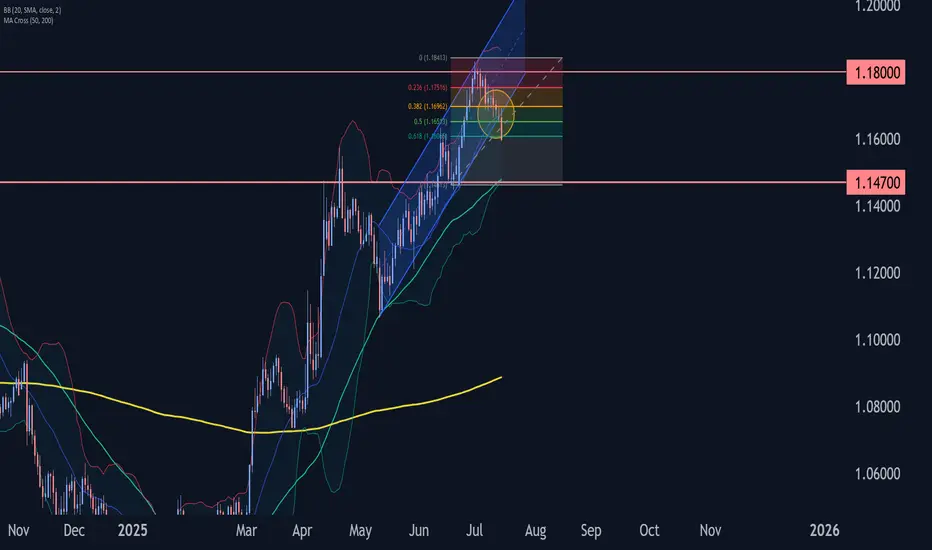
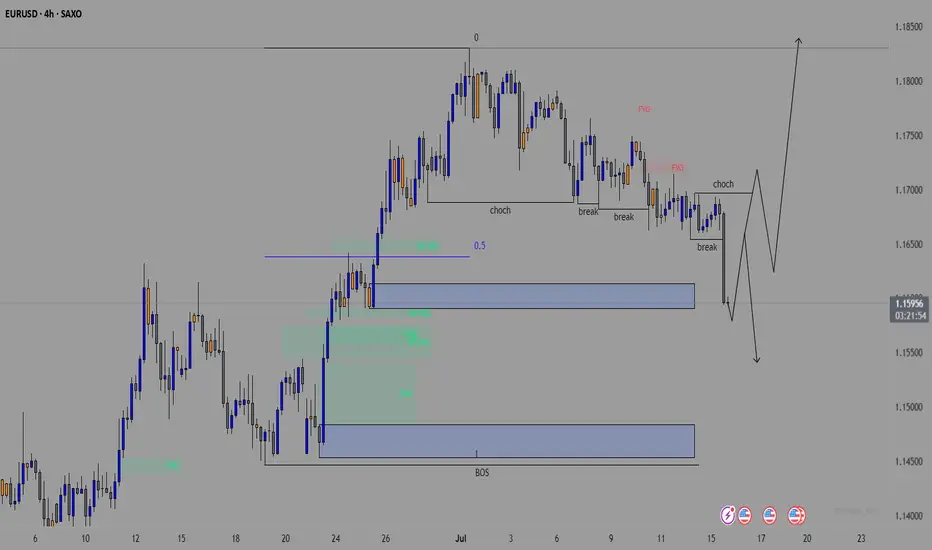
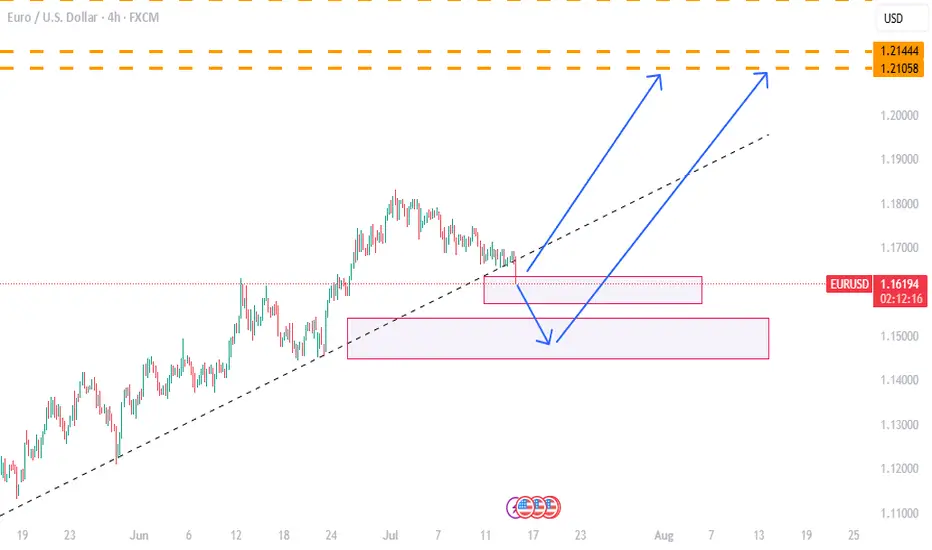
EURUSD Wave Analysis – 15 July 2025- EURUSD broke daily up channel
- Likely to fall to support level 1.1470
EURUSD currency pair recently broke the support area located at the intersection of the support trendline of the daily up channel from May and the 38.2% Fibonacci correction of the upward impulse from June.
The breakout of this support area accelerated the active short-term ABC correction 4.
Given the strongly bullish US dollar sentiment coupled with significant euro pessimism seen today, EURUSD currency pair can be expected to fall further to the next support level 1.1470 (low of former wave iv).
Fibonacci
Got filled at the bugattiMy hedge short is filled
continuation of my other chart
IF this is good the target it the!!....
key levels will be longed if data aligns.
#xauusd #elliottwave short sell setup wave 4 16Jul24This count is based on my assumptions so anything can happen not a trading or financial advice just for educational purposes only kindly do your own ta thanks trade with care good luck.
USD/CAD Coils Below Key ResistanceUSD/CAD has rallied nearly 1.3% off the monthly low with the advance now testing resistance at 1.3729/50- a region defined by the 38.2% retracement of the 2021 rally and the May opening-range lows. Note that pitchfork resistance converges on this threshold over the next few days and further highlights the technical significance of this key zone- looking for a reaction off this mark this week.
USD/CAD is trading within the confines of an embedded channel extending off the monthly low with the weekly opening range taking shape just below confluent resistance at 1.3729/50. Ultimately, a breach / close above the June high / 61.8% retracement of the December 2023 advance at 1.3795/98 is needed to suggest a more significant low was registered last month / a larger trend reversal is underway. Subsequent resistance seen at the 2022 high close / 2023 high at 1.3881/99 and the 2022 high / 2020 March weekly-reversal close at 1.3977/90- both levels of interest for possible topside exhaustion / price inflection IF reached.
Initial support rests with the weekly range lows at 1.3670- a break / close below the monthly channel would threaten resumption of the broader downtrend. Subsequent support objectives unchanged at the yearly low-day close (LDC) / May, June, July lows at 1.3571/90 and the Fibonacci confluence at 1.3504/23.
Bottom line: The USD/CAD is testing confluent resistance at the February downtrend with the weekly opening-range set just below- look for the breakout in the days ahead and watch the weekly close here. From a trading standpoint, losses would need to be limited to the weekly lows IF price is heading for a breakout on this stretch with a close above 1.3795 ultimately needed to put the bulls in control.
-MB

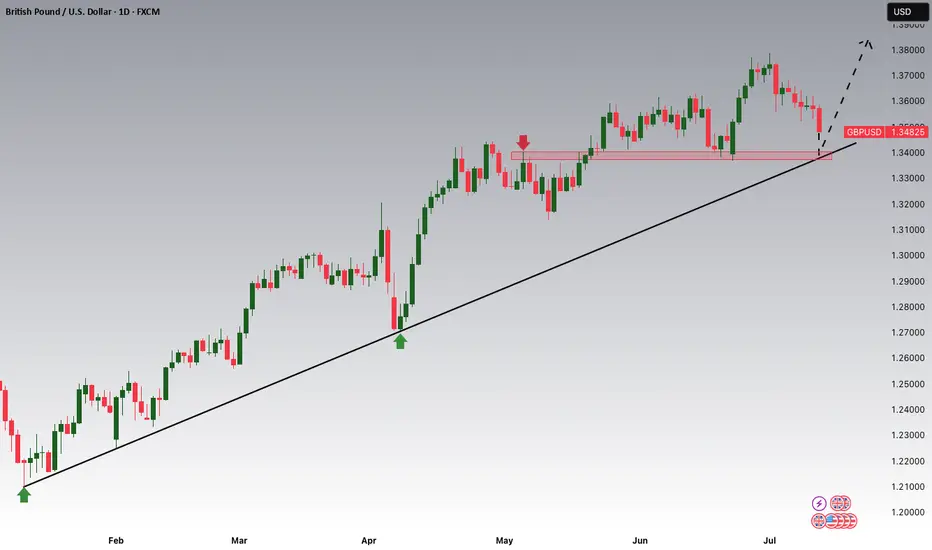
GBPUSD is Nearing the Daily Trend!!!Hey Traders, in tomorrow's trading session we are monitoring GBPUSD for a buying opportunity around 1.34100 zone, GBPUSD is trading in an uptrend and currently is in a correction phase in which it is approaching the trend at 1.34100 support and resistance area.
Trade safe, Joe.
EURUSD OUTLOOK 15 - 18 JULYCore CPI m/m came in light which gave a mixed signal at first but CPI y/y was higher than expected which eventually moved EU lower.
The last two analysis that I posted were more longer term focused so this time I will be giving a more short term outlook.
Currently the dollar is stronger based on the recent news that has been coming out and because of that I am still looking to short this pair keeping in mind that it is only the internal structure that is bearish and the swing structure is still bullish
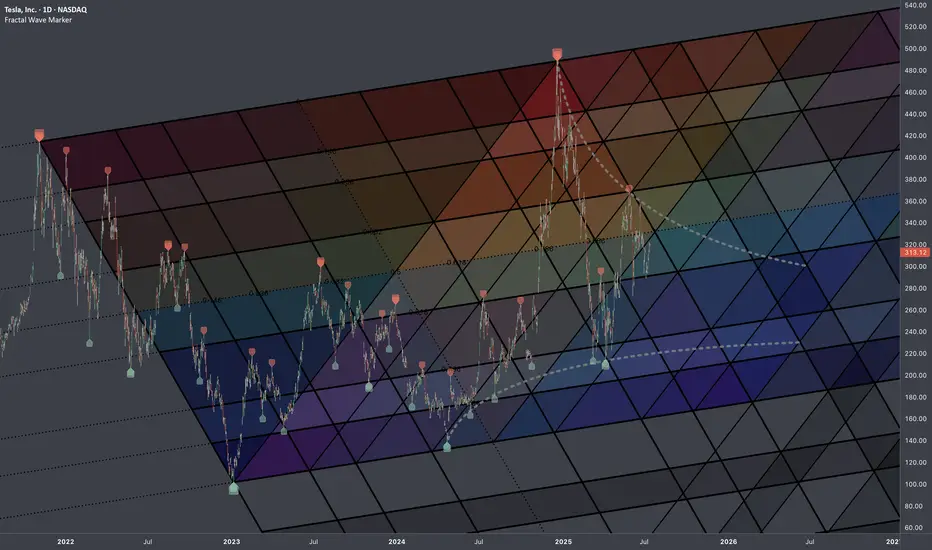
$TSLA: Fib InterconnectionsResearch Notes
Examining interconnection type with regressive angle:
Critical points:
Mapping with 3 fibonacci channels:
Don’t hesitate, a massive gold move Is brewingRefer to my previous trading idea. Gold retreated as expected. We almost caught the highest point of the day and shorted gold near 3365, and successfully hit TP: 3346, which enabled us to successfully profit 190pips in short-term trading, with a profit of nearly $10K, which is a good result in short-term trading.
Currently, the lowest point of gold in the retracement process has reached around 3335, which has fully released the short energy and vented the bearish sentiment in the market. All the bad news is out, which means good news! Although gold fell from 3375 to 3335, the retracement was as high as $40, but the rising structure has not been completely destroyed. The previous W-shaped double bottom support structure and the resonance effect of the inverted head and shoulder support structure still exist. As long as gold stays above 3325, gold bulls still have the potential to attack.
Moreover, after this round of retracement, the bearish sentiment of gold was vented, and the liquidity was greatly increased, attracting more buyers to actively enter the market. Gold may start a retaliatory rebound, and even touch 3375 again or even break through and continue to the 3380-3390 area.
So for short-term trading, I think we can try to go long on gold in the 3335-3325 area appropriately, first looking forward to gold regaining lost ground: 3350-3360 area, followed by 3380-3390 area.
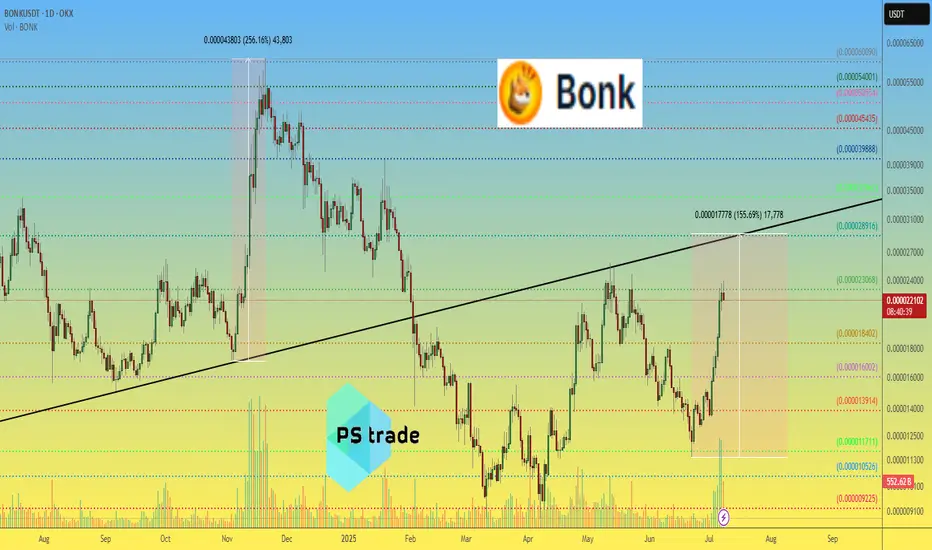
BONK price analysis “Someone” decide to revive the price of CRYPTOCAP:BONK , or are there fundamental reasons for this? (Please share your thoughts in the comments.)
📈 However, the last time there was such a powerful surge in trading volume on the OKX:BONKUSDT chart, the price managed to gain +256% in just over two weeks.
❓ Do you think that the price of #Bonk , in the current wave of growth, will manage to rise by at least +156% and reach the mark of $0.0000290, and the capitalization of the memecoin project will grow from the current $1.75 billion to $2.25 billion?
_____________________
Did you like our analysis? Leave a comment, like, and follow to get more
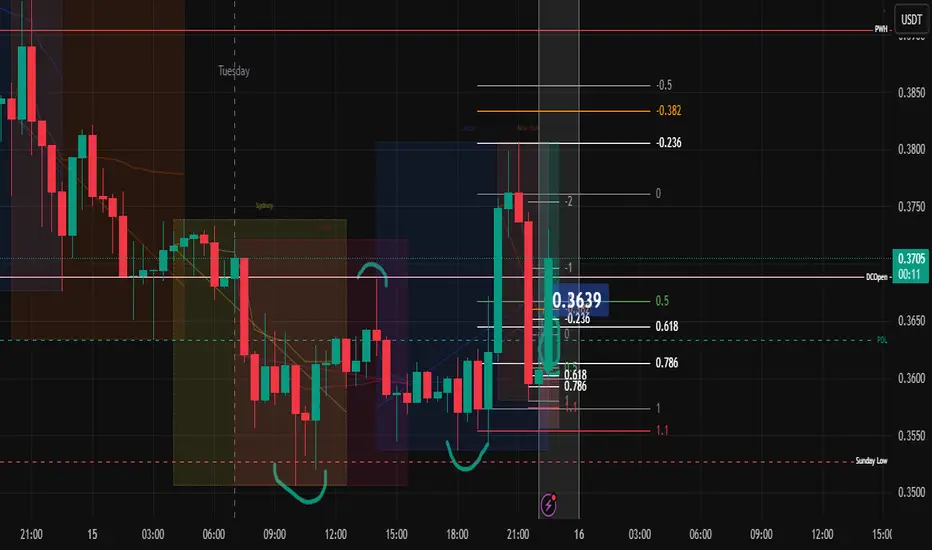
PopCat Long 15-July-2025
🧠 Trade Journal Reflection: July 15
Session: 10 p.m. – midnight (Vietnam time)
Context: Market felt “muddy” on the 1H chart. Needed time to analyze.
🔍 What I Saw:
Market was consolidating below the previous day’s low and today’s open.
Asian session stayed compressed.
London session didn’t break the range meaningfully.
New York session broke out above the day’s open—but then retraced deeply.
On the lower timeframes (45m, 30m, 15m), I identified valid swing highs/lows and noted a retracement that aligned with potential Fibs.
🎯 What I Did:
Measured my Fibonacci retracement levels.
Took time to interpret the situation—was leaning toward longing, but wasn’t fully decisive.
By the time the idea solidified, price had already moved.
I chose not to chase. Instead:
Left a limit order on the LTE (likely your identified entry zone).
Accepted that if price doesn’t come back, it’s okay—I will learn.
💡 What I Felt:
Anxious. A bit unsure. Took time to make the decision.
After placing the limit, I committed to not revenge trading or chasing another asset.
Proud that I chose patience over FOMO.
Acknowledged the lesson: Be quicker next time, but don’t force a trade.
🧭 What I Learned:
I’m becoming more self-aware. That’s rare and powerful.
Not all trades need to be executed to be valuable—this one taught me discipline.
I stayed in alignment with my time window and strategy, even though it felt uncomfortable.
If I’m more decisive and sharper tomorrow, great. If not, I’ll still be here learning.
💤 Final Words to Myself Before Sleep:
“I didn’t chase. I respected my boundaries. I traded with integrity, even if no order was filled. This is the version of me I want to show up with—calm, patient, and always learning. The market will still be here tomorrow.”
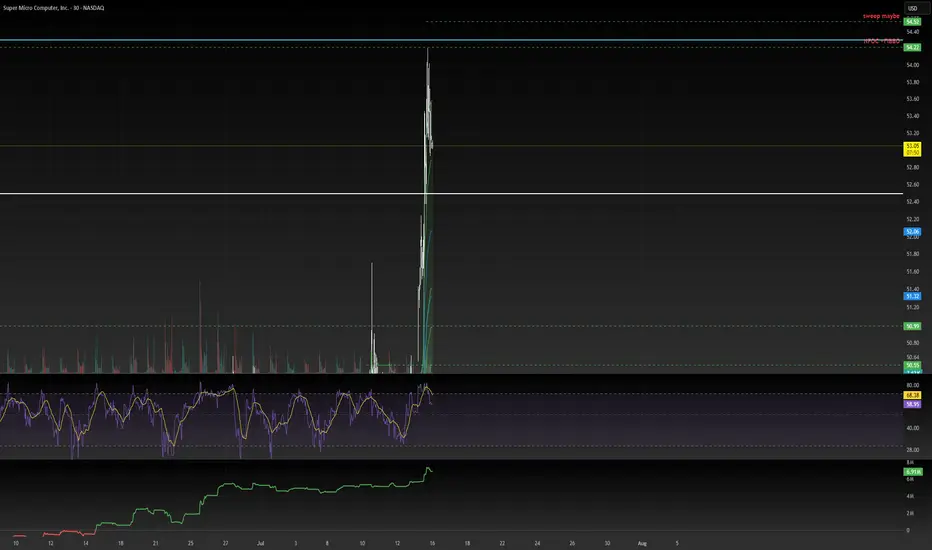
SMCI – Reloading the AI BeastSMCI continues to show strength as a key player in the AI infrastructure space. In this update, I present a new strategy with staggered entry zones at $49, $45, and $38 — designed to capture value during healthy pullbacks within a larger bullish trend.
Entry Plan:
1) $49
2) $45
3) $38
Target:
1) $56
2) $61
3) $66
📉 If price dips back to $45 or $38, I will reload heavier. No FOMO. Let the market come to us.
Drop a 👍 if you're still riding SMCI or waiting for the next entry.
This analysis is for educational and informational purposes only. It does not constitute financial advice or a recommendation to buy or sell any securities. Always do your own research and consider your risk tolerance before making investment decisions.

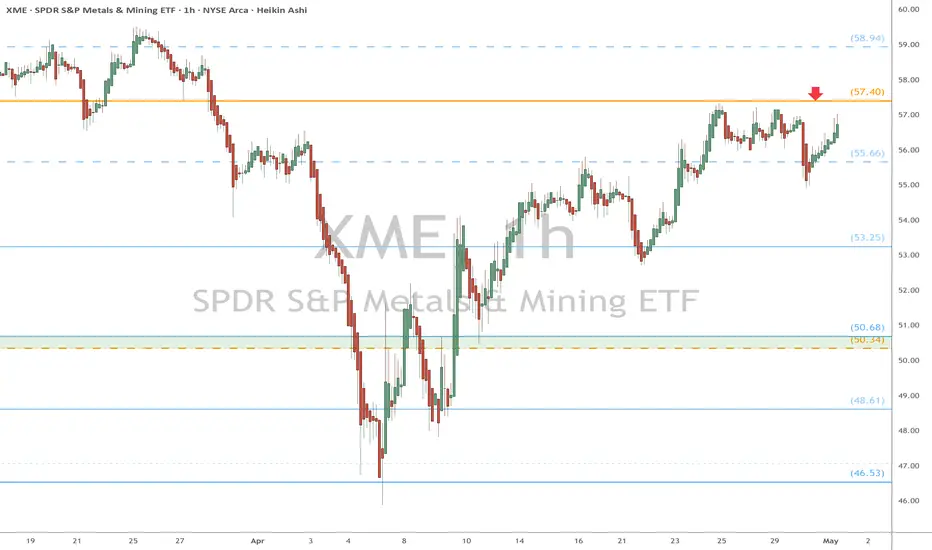
XME eyes on $57.40: Golden Genesis a MAJOR barrier already felt XME recovering nicely from the tariff tantrum.
$57.40 is the exact level of the Golden Genesis.
High Energy object whose heat is clearly noticed.
It is PROBABLE that we orbit this object a few times.
It is POSSIBLE that it rejects to the retest fibs below.
It is PLAUSIBLE that bulls could blow thru it this time.
Is it right time and choice to buy UNH Stock - {15/07/2025}Educational Analysis says that UNH Stock (USA) may give trend Trading opportunities from this range, according to my technical analysis.
Broker - NA
So, my analysis is based on a top-down approach from weekly to trend range to internal trend range.
So my analysis comprises of two structures: 1) Break of structure on weekly range and 2) Trading Range to fill the remaining fair value gap
Let's see what this Stock brings to the table for us in the future.
Please check the comment section to see how this turned out.
DISCLAIMER:-
This is not an entry signal. THIS IS FOR EDUCATIONAL PURPOSES ONLY.
I HAVE NO CONCERNS WITH YOUR PROFIT OR LOSS,
Happy Trading.

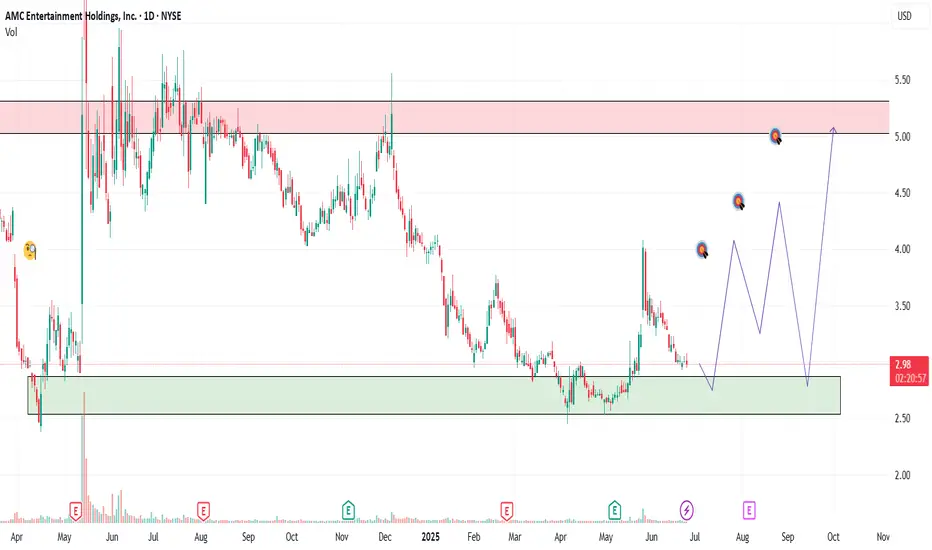
AMC | Long-Term Setup BrewingAMC has been a battlefield stock for retail traders, and while the meme frenzy has calmed, the chart shows signs of a long-term consolidation that may lead to a breakout.
We’re not chasing hype we’re playing levels. The current zone offers asymmetric risk/reward for patient swing or position traders looking for a reversion move back toward key psychological and technical levels.
🔍 Entry Zones:
✅ Market Price: ~$2.99 (initial momentum position)
🧲 Pullback #1: $2.75 (former pivot + fib level)
🧨 Pullback #2: $2.50 (key support floor and high-risk/reward entry)
🎯 Profit Targets (Swing/Position):
🎯 TP1: $3.30 – reclaim of early resistance
🎯 TP2: $4.00 – volume spike zone
🎯 TP3: $5.00+ – potential sentiment surge / short squeeze zone
📢 Disclaimer: This is not financial advice. Always manage your own risk and do your own due diligence.
analyse eurusd *The content on this analysis is subject to change at any time without notice, and is provided for the sole purpose of assisting traders to make independent investment decisions.
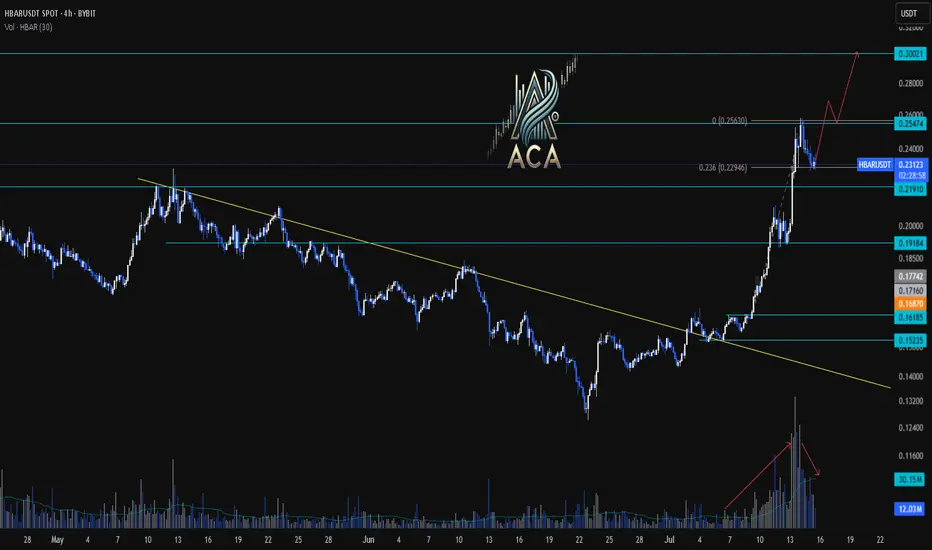
HBARUSDT 4H Chart Analysis |Volume & Fibonacci Reaction in FocusHBARUSDT 4H Chart Analysis | Volume & Fibonacci Reaction in Focus
🔍 Let’s break down the latest HBAR/USDT setup, highlighting a clear technical reaction and a new opportunity on the horizon.
⏳ 4-Hour Overview
HBAR has completed a strong impulsive leg after breaking above the RR2 of the key reversal trendline, supported by notable volume confirmation. This impressive surge was then followed by a corrective leg—a healthy sign for bulls, especially for those who missed the initial breakout.
📉 Corrective Phase & Fibonacci Support
- The current corrective leg is characterized by decreasing volume, suggesting profit-taking rather than heavy selling pressure.
- Notably, price has reacted firmly at the 0.236 Fibonacci retracement level, aligning with classic pullback zones for continuation setups.
- This volume pattern shows traders are waiting for the next major move rather than exiting positions.
🔺 Bullish Continuation Setup
- A strong candle close above the $0.255 level on either the 1H or 4H timeframe will serve as a clear bullish confirmation.
- Such a breakout may pave the way for another impulsive leg upward, with the first upside target identified near $0.30—roughly 19% higher from the recent candle close.
📊 Key Highlights:
- The prior trend reversal was validated by surge in volume and momentum.
- Volume decline during the correction favors further upside rather than distribution.
- Price is respecting key Fibonacci levels, hinting at trend continuity.
- A confirmed close above $0.255 unlocks the next target at $0.30, marking a potential 19% move.
🚨 Conclusion:
HBAR is showing textbook trend continuation signals. For those sidelined after the initial move, the current consolidation offers a safer re-entry point, with actionable confirmation above $0.255. Stay alert for a strong candle close and keep the $0.30 target in view as bullish momentum builds.
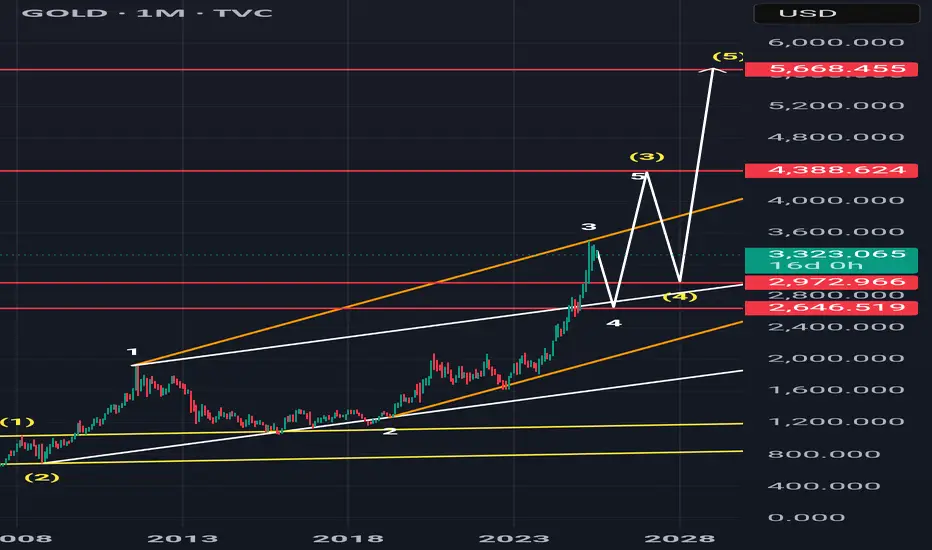
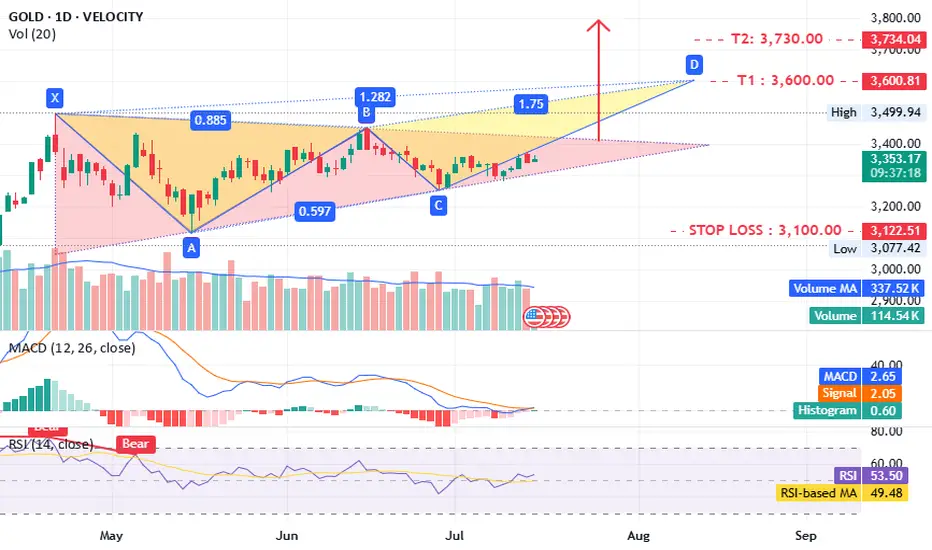
Gold what is next ?!!TVC:GOLD timeframe 1 day
is forming a potential triangle pattern, which could lead to a bearish setup.
The MACD and RSI indicators are positive, supporting this outlook. A close above 3400 would further confirm the idea.
Targets:
- T1: 3600
- T2: 3730–3800
Stop loss: 3100
Support: 3300–3260
Consider opening a long position now, with confirmation above 3400.
Disclaimer: This is not investment advice, only an analysis based on chart data. Consult your account manager before making any decisions. Good luck.
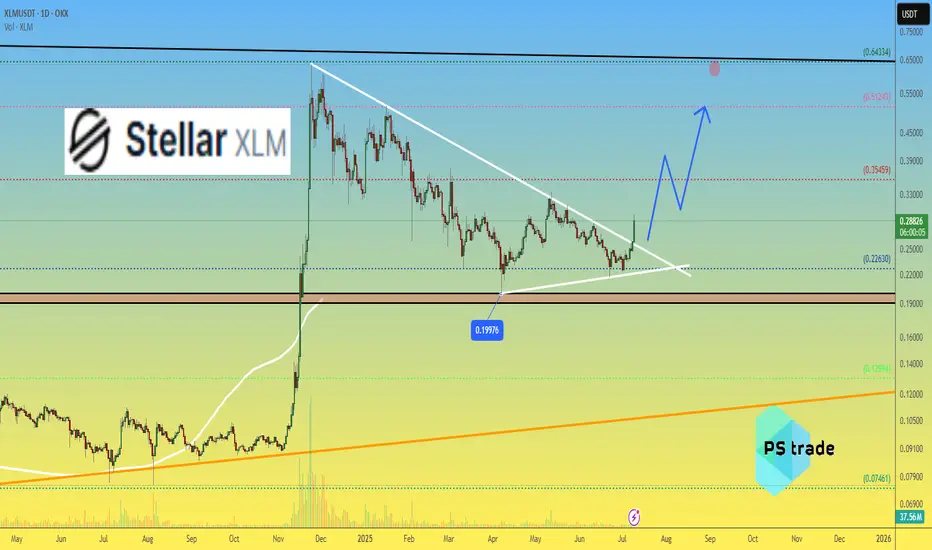
Stellar XLM price analysisToday, the price of CRYPTOCAP:XLM rose quite dramatically, doing so at a critically important moment, but trading volumes are slightly insufficient for final confirmation.
Now let's look at what we wrote for the OKX:XLMUSDT chart four months ago: “It would be ‘right’ to test $0.19-0.20 before the start of strong growth.”
👆
The minimum was $0.19976 — do we "check" and "done" that?
📈 If so, then the price of #XLM should not fall below $0.226 anymore.
And ahead lies only growth in the price of the #Stellar token to at least $0.50, or even $0.60.
🏆 Well, and about the global goal for #XLMUSD we wrote in the previous idea — read, analyze, and turn information into profit!
_____________________
Did you like our analysis? Leave a comment, like, and follow to get more
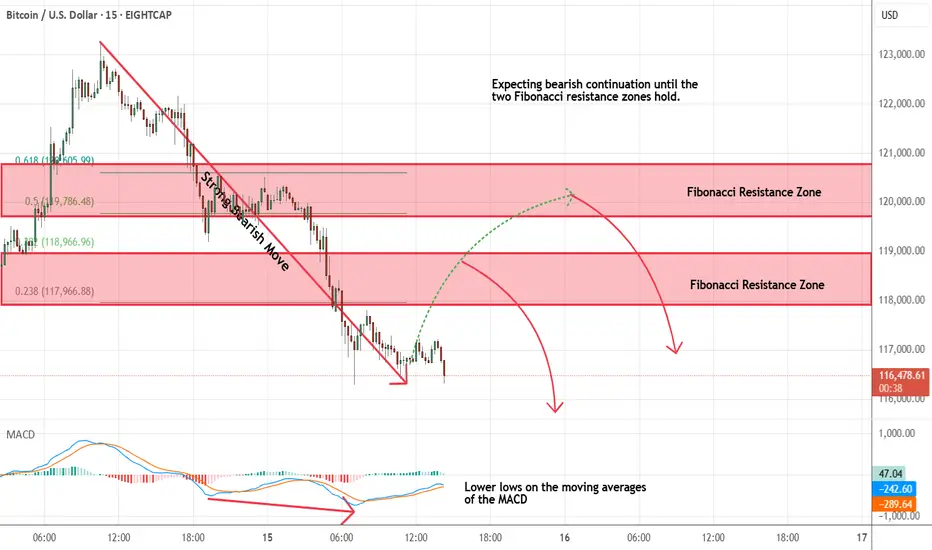
Bitcoin - Looking To Sell Pullbacks In The Short TermM15 - Strong bearish move.
Lower lows on the moving averages of the MACD.
No opposite signs.
Currently it looks like a pullback is happening.
Expecting bearish continuation until the two Fibonacci resistance zones hold.
If you enjoy this idea, don’t forget to LIKE 👍, FOLLOW ✅, SHARE 🙌, and COMMENT ✍! Drop your thoughts and charts below to keep the discussion going. Your support helps keep this content free and reach more people! 🚀
--------------------------------------------------------------------------------------------------------------------
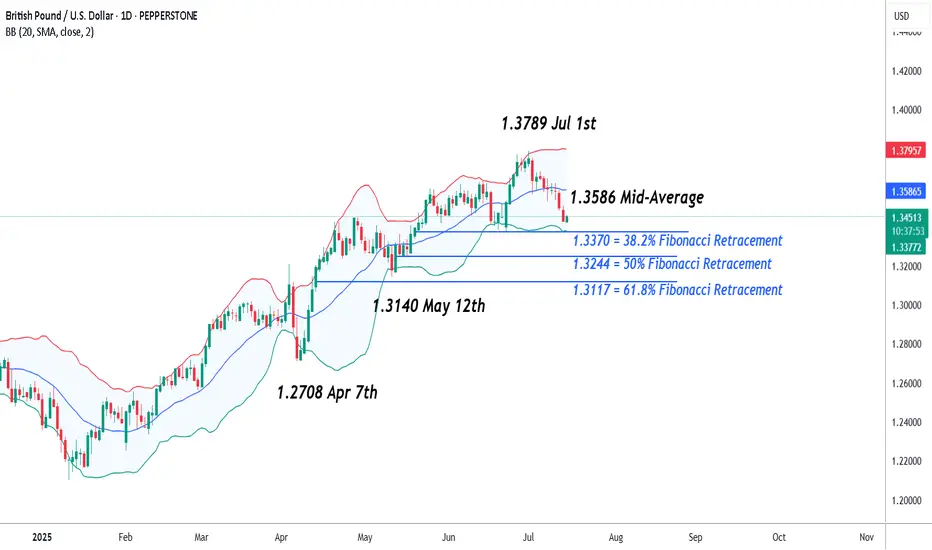
GBPUSD – Potential Short Term Volatility Ahead This WeekSo far, the month of July has not been a good one for GBPUSD, undermined by the precarious state of the UK Labour government’s finances, a deteriorating growth backdrop, and shifting interest rate differentials back in favour of the US dollar. This has seen a liquidation of stale long positioning and a steady decline from a 40 month high of 1.3789 registered on July 1st to a low of 1.3419 seen earlier today.
Looking forward, it could be another challenging week for FX traders to navigate. There are several economic data releases in the US and UK to digest, starting with the latest US CPI release later this afternoon (1330 BST), followed by the UK CPI update tomorrow (0700 BST) and then the UK Employment release on Thursday (0700 BST). All of these may have the potential to shift trader thinking on the next interest rate moves from the Federal Reserve (Fed), who are currently expected to keep rates unchanged when they next meet on July 31st, and the Bank of England (BoE), who are expected to cut by 25bps (0.25%) on August 7th.
When the outcome of these events is combined with the uncertain backdrop for global trade as President Trump’s new tariff deadline approaches on August 1st, alongside his ability to drop market moving social media headlines on a whim, this week has the potential to be a volatile one for GBPUSD.
Technical Update: Watching Closing Defence of 38.2% Retracement Support
So far, July has seen GBPUSD enter a correction phase, as prices have sold off from the 1.3789 July 1st session high into Tuesday’s current 1.3419 low. As the chart below shows, this 2.7% decline, seen over little more than a 10 session period, is now approaching what some might class as a support focus at 1.3370.
This level is equal to the 38.2% Fibonacci retracement of the April 7th to July 1st phase of strength, and could be one that traders are now monitoring on a closing basis over coming sessions. While this level remains intact, some might argue there is still a positive uptrend pattern in place.
However, it is also important to consider what are the support and resistance levels on which to focus, if either 1.3370 is broken to the downside, or it continues to stem the current phase of weakness, even helps prompt fresh attempts at price strength.
Possible Support Levels:
As we’ve suggested, it could be the 1.3370 retracement level that represents the first support, with closing breaks below this level opening potential for a more extended phase of price declines.
While much will depend on future market sentiment and price trends, closes below 1.3370 may represent possibilities of further weakness towards 1.3244, which is equal to the lower 50% retracement level. This giving way, may in time result in tests of 1.3140, the May 12th session low.
Possible Resistance Levels:
While the 1.3370 retracement continues to hold current price declines, it might be successful in prompting fresh attempts at price strength.
With that in mind, if moves back higher do materialise, a resistance point to monitor on a closing basis could be 1.3586. This is the current level of the Bollinger mid-average and this giving way on a closing basis may in turn lead to further attempts at price strength to challenge 1.3789, the July 1st high again.
The material provided here has not been prepared accordance with legal requirements designed to promote the independence of investment research and as such is considered to be a marketing communication. Whilst it is not subject to any prohibition on dealing ahead of the dissemination of investment research, we will not seek to take any advantage before providing it to our clients.
Pepperstone doesn’t represent that the material provided here is accurate, current or complete, and therefore shouldn’t be relied upon as such. The information, whether from a third party or not, isn’t to be considered as a recommendation; or an offer to buy or sell; or the solicitation of an offer to buy or sell any security, financial product or instrument; or to participate in any particular trading strategy. It does not take into account readers’ financial situation or investment objectives. We advise any readers of this content to seek their own advice. Without the approval of Pepperstone, reproduction or redistribution of this information isn’t permitted.
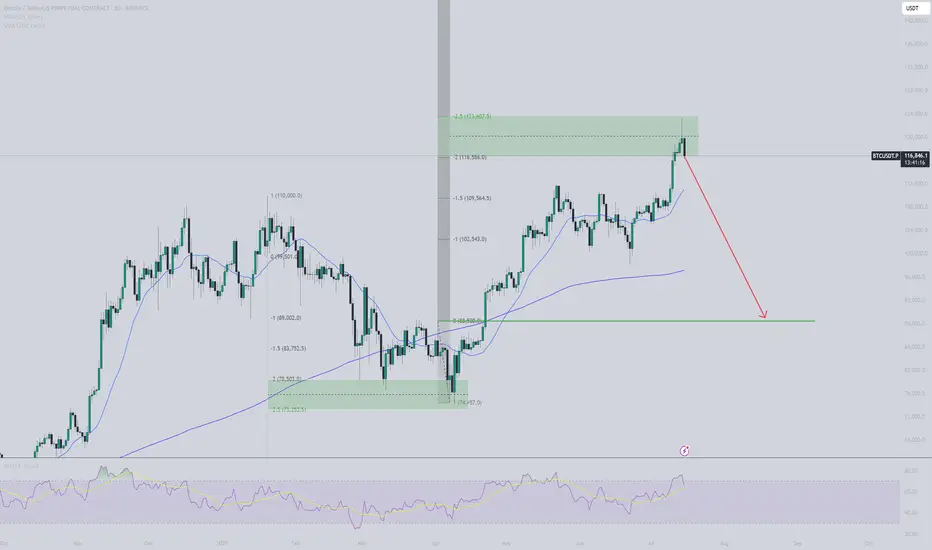
BTC retracement comingBTC seems to follow the 2-2,5 stdv price structure. Based on simply stdv from last manipulation leg down it suggests we are now at reversal zone, and I expect price to retrace down. First reaction seems to support this plan. Aiming at $88,5K.
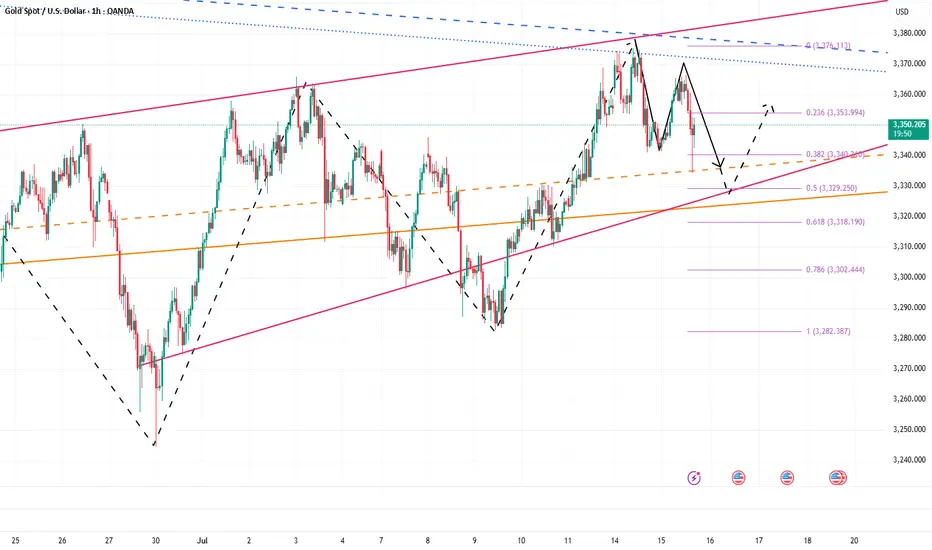
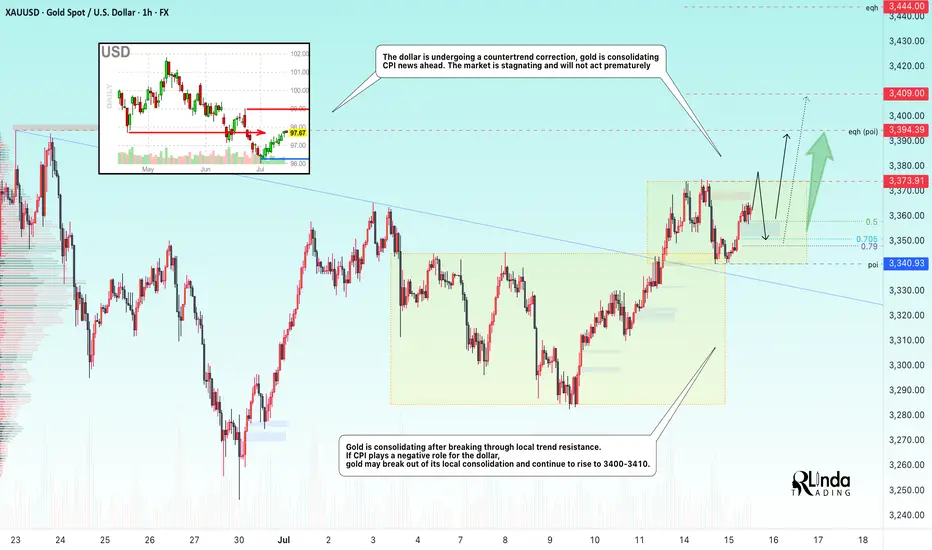
GOLD → Consolidation ahead of CPI. Chances for growth?FX:XAUUSD Gold is consolidating amid a correction in the dollar ahead of important news. Consumer price index data is due later today. The market is stagnant and will not move prematurely.
On Tuesday, gold rose slightly amid profit-taking ahead of the US CPI release. Investors are waiting for a signal from inflation: weaker data could strengthen bets on a Fed rate cut and support gold, while strong inflation would strengthen the dollar and put pressure on the metal. The situation is exacerbated by Trump's new tariff threats and his criticism of the Fed chair. Let me remind you of Trump's pressure on regulators regarding inflation and interest rate cuts.
Technically, gold is trading above the previously broken “symmetrical triangle” consolidation. Bulls are trying to hold their ground above 3340-3350. Focus on the current range of 3340-3373
Resistance levels: 3373, 3394
Support levels: 3350, 3340
Favorable news for gold could boost interest in the metal, which would generally lead to growth. However, there is a factor of unpredictability, and against this backdrop, gold may test support at 3350-3340. If the bulls manage to keep the price above this zone, we may see growth in the medium term. Otherwise, the price may drop to 3310-3280.
Best regards, R. Linda!
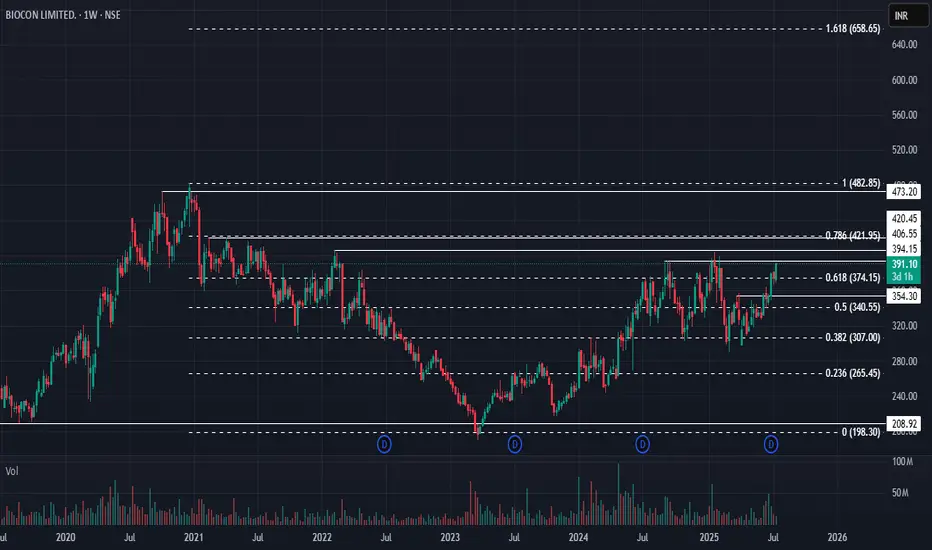
Biocon: Heading for All-Time High?🚀 Biocon: Heading for All-Time High? 🚀
📉 CMP: ₹390
🔒 Stop Loss: ₹330
🎯 Targets: ₹428 | ₹478 | ₹560
🔍 Why Biocon Looks Promising?
✅ Weekly Rounding Bottom Breakout: Breakout triggered above ₹390
✅ Weekly Box Breakout: Confirmation above ₹398 strengthens the setup
✅ Final Confirmation: A weekly close above ₹402 will validate the breakout for a potential strong upside
💡 Strategy & Risk Management:
📈 Phased Entry: Build positions gradually post confirmation to manage risk effectively
🔒 Strict SL: Maintain stop loss at ₹330 to protect capital in case of reversal
📍 Outlook: Biocon is showing strong technical signals with an all-time high on the radar, making it a compelling positional trade setup.
📉 Disclaimer: Not SEBI-registered. Please do your own research or consult a financial advisor before investing.
#Biocon #PharmaStocks #TechnicalBreakout #AllTimeHigh #SwingTrading #StockMarket #InvestmentOpportunities